Advance Access Publication 18 June 2009
Introduction
Facial expressions refl ect the function of the underlying neuromuscular structure of the face ( Ekman and Friesen, 1978 ). These expressions are used in various areas of behavioural research, including the study of emotions, social interaction, and communication ( Ekman et al. , 1991 ). Recently, the assessment of facial mobility has also been used in the medical setting. Characterization of musculature is employed for the treatment of patients with facial motor defi ciencies such as cleft lip and palate and hemifacial paralysis ( Trotman et al. , 2000 ; Dulguerov et al. , 2003 ). Dentofacial discrepancies may be the underlying reason infl uencing the facial musculature, specifi cally in the perioral region ( Rasheed and Munshi, 1996 ; Yamaguchi et al. , 2000 ). Furthermore, orthodontic treatment and orthognathic surgery may infl uence the relationship of the hard tissue structures and possibly lead to a neuromuscular adaptation of the facial musculature ( Trotman and Faraway, 2004 ).
Different methods used in the past to evaluate facial mobility might be useful instruments to detect possible neuromuscular adaptations ( Neiva and Wertzner, 1996 ; Trotman et al. , 1998 ; Miyakawa et al. , 2006 ). Among them, video sequencing is the primary technique used for the measurement of facial expressions.
Facial mobility exists from birth and has a remarkable diversity even at a young age. Previous studies have focused on the development and maturation of motor capacity from
Gender and age differences in facial expressions
Odyssia Houstis and Stavros Kiliaridis
Department of Orthodontics, University of Geneva, Switzerland
SUMMARY The aim of this research was to determine a reliable method for quantitatively evaluating the facial expressions of children and adults in order to assess their dependence on age and gender. This study evaluated 80 healthy subjects divided into four groups: 20 girls (mean age 10.6 years), 20 boys (mean age 10.8 years), 20 females (average age 25.6 years), and 20 males (average age 27.0 years). A video was used to record each individual executing three facial expressions: a rest pose, a lip pucker, and a posed smile. Representative video frames were chosen for each individual ’ s expressions; they were digitized and then analysed with software that extracted a set of horizontal and vertical distances of the face. All distances measured in the posed smile and lip pucker were expressed as a percentage change from the rest pose. Statistical analysis with a two-way multivariate analysis of variance (MANOVA) was performed, with gender and age as the independent variables.
It was evident that the ability to produce certain facial expressions differs between groups of individuals due to gender and age. Males had a greater upward vertical movement capacity in the studied facial expressions than females. Females had a more pronounced horizontal component in the posed smile. There was a trend from childhood to adulthood showing an increase in the percentage change in most vertical movements. This trend was present in both genders, though more pronounced in males.
Using a robust quantitative method for collecting and analysing facial expressions, gender differences in adults were detected as well as differences between adults and children. The trend toward increasing vertical movements in adults compared with children suggests the possibility that the mimic musculature is developmentally regulated.
childhood to adulthood ( Santrock, 1999 ; Darrah et al. , 2007 ). The development and maturation of the mimic muscles that perform facial expressions has not been given the same amount of attention. It is not clear if the mimic muscles undergo the same process of maturation with changes in facial expression, or whether these expressions remain constant throughout growth. There are indications that there are differences in facial movements between the genders in adulthood ( Weeden et al. , 2001 ). It is unclear, however, whether this sexual dimorphism is present during childhood. What is the development of the neuromuscular capacities to produce facial expressions during growth?
The aim of this study was to apply a reliable method for quantitatively evaluating facial expressions in children and adults and to detect whether there are possible differences between them depending on age and gender.
Subjects and methods
Subjects
Eighty healthy subjects were divided into four groups: 20 girls (mean age 10.6 years, range 7.5 – 12.6), 20 boys (mean age 10.8 years, range 6.9 – 12.3), 20 females (average age 25.6 years, range 22.0 – 30.3), and 20 males (average age 27 years, range 23.0 – 33.6). The adult subjects were students in the fi nal 2 years of their dental studies at the University of Geneva and in the postgraduate programmes. All subjects in the two adult groups had
complete permanent dentitions; no subject took medication or suffered from any disease. The children chosen were under their annual dental control in the same university clinic. None of the children suffered from any disease and were not under medication. Due to the arbitrary selection, children with minor malocclusions were also included, but no child had undergone orthodontic treatment.
Method
A video sequence was taken of each individual, during which a series of facial expressions was executed. During the video sequence, the subjects were seated in a chair with no back support, so that they maintained a more natural head position. The subjects were placed in front of a black background, and a soft diffused light was shone on them. Before recording, the intended facial movements were explained and a few trials were performed. The subject was then asked to execute a facial expression or produce a specifi c movement. For each movement, they were verbally instructed to perform it to the maximum possible extent. They repeated each expression and/or movement at least twice.
Recorded facial expressions
Initially, the individual at rest with their teeth in occlusion and with their lips relaxed and closed was recorded. The ‘ rest pose ’ served as a reference image for the individual ( Figure 1 ). The individuals were then asked to perform two expressions, a lip pucker and a posed smile ( Ekman and Friesen, 1978 ). A digital camcorder (Canon XL1 3CCD Digital Video Camcorder PAL, Tokyo, Japan) recorded the video session on to a videocassette. The camera was set to frame mode (12 frames/ second), allowing the selection of individual frames during the subsequent analysis. Each session took 3 – 5 minutes to execute and record the full sequence of expressions.
Each videocassette was then transferred to a computer, digitized, and the video sequence was entered into the program, Adobe Premiere 6.0 (Adobe Systems Inc., San Jose, California, USA). Using this software, the frame that captured the maximum movement in any given expression was selected.
Measurement procedure
The selected frames were then analysed with image digitizing software (Viewbox© 3.0, DHal, Kifi sia, Greece) that allows measurement of a set of horizontal and vertical distances ( Figure 2 ). Of these distances, RC – LC, extending from the right inner canthus to left inner canthus, was physically measured on the actual individual. It was then used to set a magnifi cation parameter in the software so that the image distances could be calibrated to actual physical distances.
In order to avoid anatomical variation due to physical size differences between the individuals, each distance measured in a given facial expression was expressed as a percentage change from the corresponding distance in the rest pose image, using the following equation:
facial expression rest rest
percentage change from rest − × =
100
to movement
Any negative values given by this equation represent a decrease of a distance and positive values an increase of the distance. For example, for the posed smile, the distance RCO – LCO (corners of mouth) increased from rest, thus giving a positive value for the percentage of change. However, for the same distance, when choosing the lip pucker, this distance diminished, thus giving a negative percentage change.
Statistical analysis
The Kolmogorov – Smirnov test showed a normal
distribution of all variables. Descriptive statistics were performed for all the percentage changes of all of the
Figure 2 (a and b) Points and distances used to evaluate facial expressions:
RC, right inner canthus; LC, left inner canthus; RCO, right commissure point; LCO, left commissure point; Ulip, midpoint of the upper lip on the edge of the vermilion zone; Llip, midpoint of lower lip on the edge of the vermilion zone; and Sn, subnasale. RCO – LCO, inter commissure line; RC — RCO, right inner canthus to right commissure point; LC – LCO, left inner canthus to left commissure point; Ulip — Llip, upper lip to lower lip; Sn – Ulip, subnasale to upper lip; and Sn — Llip, subnasale to lower lip.
Figure 1 Facial expressions: (a) rest (lips closed, teeth lightly in
occlusion), (b) posed smile, and (c) lip pucker (pursing of lips, as if to give a kiss).
expressions. A two-way MANOVA was performed with two independent variables (gender and age) and the various percentage changes as dependent variables. Additionally, subsequent t -tests within samples were undertaken. The signifi cance level was set at 0.05. The Statistical Package for Social Sciences for Windows, version 13.0 (SPSS Inc., Chicago, Illinois, USA) was used for these statistical tests.
Error of the method
In order to evaluate the error of the method, the videos of 40 individuals were repeated after an interval of 2 weeks. For both, video 1 and video 2, all the distances for all the expressions were measured and the percentage changes were calculated. A paired t -test was used to estimate the differences in the measurements from these two video recordings and to evaluate the systematic error. No differences were detected at a signifi cance level of 0.05.
Dahlberg ’ s formula (Se 2 = ∑ d 2 /2 n , where d = difference between measurements from video 2 and video 1; Houston, 1983 ) was used to calculate the coeffi cient of reliability (CR = 1 − Se 2 / S
t 2 , where S t = standard deviation of measurements
from video 1). The results showed excellent reliability ( Tables 1 and 2 ).
Results
Posed smile
During the production of a smile, the corners of the mouth were displaced in a horizontal direction from the rest position. This displacement seemed to be infl uenced by age and the interaction between age and gender ( Table 3 ). However, it did not occur to the same degree in the four groups studied. Although boys had a larger percentage change than girls, the opposite occurred for adult males and females ( Figure 3 ). The adult females had a larger percentage change than girls, and the boys had a larger percentage change than adult males. The corners of the mouth were not only displaced in a horizontal direction but also in an upward vertical direction; this movement was infl uenced not only by gender and age but also by the interaction of the two. Among the children, there were no differences between the girls and boys, and this displacement was not important. However, in the adults, the displacement was greater than in the children and more pronounced in males than in females.
During the posed smile, the lips separated and the distance between points Ulip and Llip increased. No differences were found between the girls and boys or between the adult males and females, but females had a smaller percentage change than girls. The midpoint of the upper lip on the edge of the vermillion zone, point Ulip, with respect to the stable point Sn (subnasale), moved upwards during smiling in all the groups. Only age had an effect on this movement as no
differences were found between girls and boys or between adult females and males, but the percentage change was greater in adults than in children.
The midpoint of the lower lip on the edge of the vermillion zone, point Llip, with respect to the stable point Sn, moved in a downward direction mainly in the children. No gender differences were observed but differences were found between the adults compared with the children. Llip was not displaced as much in the adults as it was in the children.
Lip pucker
During lip puckering, the distance between the corners of the mouth became smaller during the displacement in a horizontal direction; this was the case for all groups and genders and the interaction between age and gender seemed to have an infl uence ( Table 4 ). The males had a greater percentage change when compared with either the females or the boys. No differences were found between the boys and girls or between the females and girls ( Figure 4 ).
There was also a vertical component to the displacement of the corners of the mouth during lip pucker. Gender and age differences and an upward movement were observed mainly in adults, but not in children. This upward movement was more pronounced in males than in females.
The vertical distance between Ulip – Llip increased in all groups during the lip pucker. This mainly gender-related increase was more pronounced in males than in females, both in children and adults.
The midpoint of the upper lip, point Ulip, with respect to Sn, moved upward with a greater percentage change in the males than in any other group. Age, gender, and the interaction between age and gender infl uenced this movement. There were no differences between the girls and boys, but there were differences between adult males and females.
The midpoint of the lower lip, point Llip, with respect to Sn, moved in a downward direction in all groups except in the males. Age and the interaction of age and gender seemed to have an effect on this movement.
Discussion
The present study has shown that the ability to produce certain facial movements differs between groups of individuals due to gender and age differences. Gender differences were found in adults. Males had a greater upward vertical movement capacity in the studied facial expressions than females which is in agreement with the fi ndings of Paletz et al. (1994) and Weeden et al. (2001) that males have a greater maximum movement than females. However, if this was the case for the vertical movements, it was not so for horizontal movements of the corners of the mouth, which were not higher in the males for both expressions. For the lip pucker, males showed a larger
percentage change from rest to pucker than females. In the posed smile, however, males had a smaller horizontal percentage change than females.
Until now, there has been limited quantitative information comparing age differences with respect to these expressions between boys and males and girls and females. A small difference was found between girls and females in the horizontal percentage change for the posed smile. Boys
however had a much greater horizontal percentage change in the posed smile than males. Although boys initially had the largest percentage change in the horizontal direction than any other group, this capacity seemed to be lost in adulthood. Apart from this, there seems to be a pattern showing that from childhood to adulthood there is an increase in percentage changes in most vertical movements for both genders, though more pronounced in males.
Table 2 Percentage change of the actual lip pucker expression from rest position with the number of observations, mean values and standard deviation (SD) of videos 1 and 2, mean values and SD of the differences (video 1), P values of the paired t -test, and coeffi cient of reliability.
Distance n Video 1 Video 2 Differences
(video 2 − video 1)
P value Coeffi cient of reliability
Mean values SD Mean values SD Mean values SD
RCO − LCO % 40 − 45.82 23.42 − 45.85 21.94 − 0.02 15.65 0.993 1.000
LC − LCO % 40 − 12.44 12.34 − 12.42 11.79 0.02 8.59 0.985 0.999
RC − RCO % 40 − 11.52 13.20 − 11.92 11.73 − 0.40 9.17 0.785 0.997
Upper lip − lower lip % 40 37.59 37.85 40.46 33.62 2.87 22.28 0.420 0.996 Subnasale − upper lip % 40 − 22.06 22.59 − 24.78 20.61 − 2.72 20.39 0.402 0.995 Subnasale − lower lip % 40 2.98 16.07 3.72 15.15 0.74 14.22 0.744 0.997
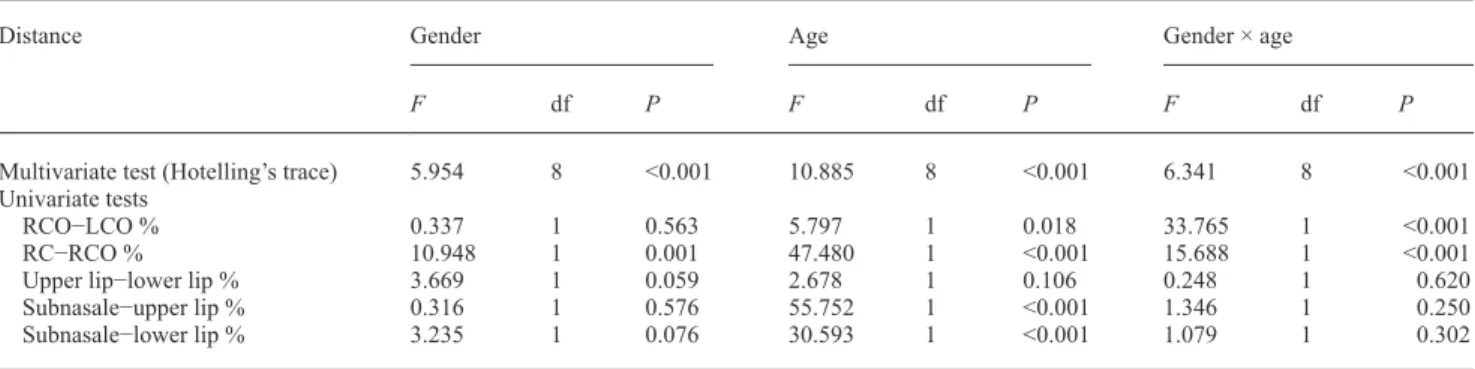
Table 3 Results for the two-way MANOVA on the effect of gender and age on all distances measured in the posed smile expression.
Distance Gender Age Gender × age
F df P F df P F df P
Multivariate test (Hotelling ’ s trace) 5.954 8 <0.001 10.885 8 <0.001 6.341 8 <0.001 Univariate tests
RCO − LCO % 0.337 1 0.563 5.797 1 0.018 33.765 1 <0.001
RC − RCO % 10.948 1 0.001 47.480 1 <0.001 15.688 1 <0.001
Upper lip − lower lip % 3.669 1 0.059 2.678 1 0.106 0.248 1 0.620
Subnasale − upper lip % 0.316 1 0.576 55.752 1 <0.001 1.346 1 0.250 Subnasale − lower lip % 3.235 1 0.076 30.593 1 <0.001 1.079 1 0.302 df, degrees of freedom.
Table 1 Percentage change of the actual posed smile expression from the rest position with the number of observations, mean values and standard deviation (SD) of videos 1 and 2, mean values and SD of the differences (video 2 − video 1), P values of the paired t -test, and coeffi cient of reliability.
Distance n Video 1 Video 2 Differences (video
2 − video 1) P value Coeffi cient of reliability
Mean values SD Mean values SD Mean values SD
RCO − LCO % 40 25.79 13.30 26.30 12.42 0.51 7.14 0.651 0.997
LC − LCO % 40 − 19.11 10.76 − 19.15 11.15 − 0.04 3.54 0.939 0.999
RC − RCO % 40 − 18.58 11.38 − 17.13 15.41 1.45 10.05 0.366 0.994
Upper lip − lower lip % 40 50.75 42.68 51.80 43.15 1.05 17.09 0.701 0.998 Subnasale − upper lip % 40 − 41.35 10.24 − 39.74 10.64 1.61 7.07 0.160 0.994 Subnasale − lower lip % 40 2.46 13.98 3.28 14.52 0.82 9.27 0.578 0.996
Figure 3 Percentage changes of the distances between rest position and posed smile: Bars represent
the mean values of the percentage change and T-bars, the 95 per cent confi dence interval of the mean. * P ≤ 0.05, ** P ≤ 0.01, *** P ≤ 0.001. ns, not signifi cant.
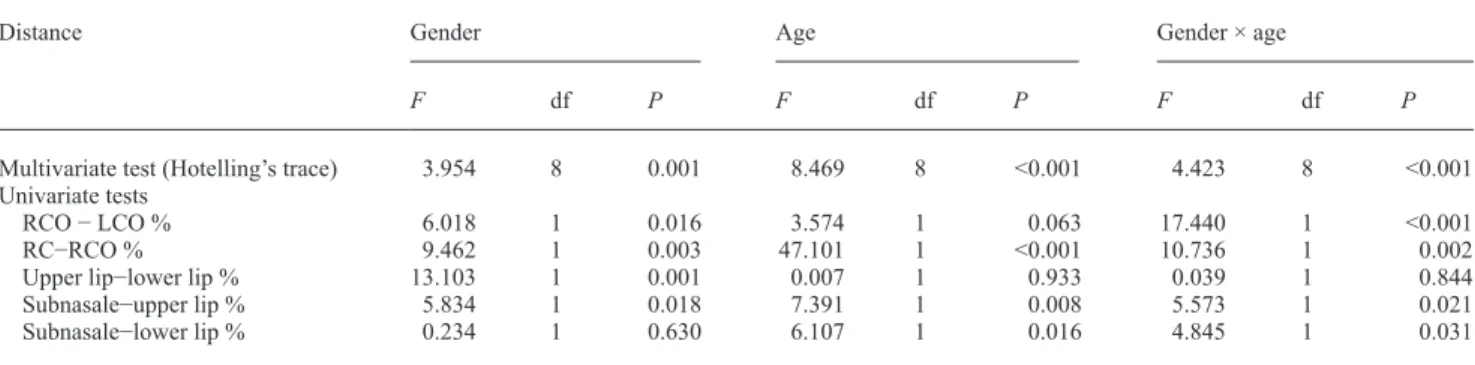
Table 4 Results for the two-way MANOVA on the effect of gender and age on all distances measured for the lip pucker expression.
Distance Gender Age Gender × age
F df P F df P F df P
Multivariate test (Hotelling ’ s trace) 3.954 8 0.001 8.469 8 <0.001 4.423 8 <0.001 Univariate tests
RCO − LCO % 6.018 1 0.016 3.574 1 0.063 17.440 1 <0.001
RC − RCO % 9.462 1 0.003 47.101 1 <0.001 10.736 1 0.002
Upper lip − lower lip % 13.103 1 0.001 0.007 1 0.933 0.039 1 0.844
Subnasale − upper lip % 5.834 1 0.018 7.391 1 0.008 5.573 1 0.021
Subnasale − lower lip % 0.234 1 0.630 6.107 1 0.016 4.845 1 0.031
df, degrees of freedom.
Ideally, a larger sample is necessary to investigate further the patterns seen in these groups of individuals. However, even with the sample from this study, there appears to be trends in age differences between these groups. Based on these results, further investigators can identify their sample size using a power analysis from this sample. The present study, based on cross-sectional recordings, was able to detect differences between the age groups. In the future, longitudinal data will allow better clarifi cation of the results and give further indications of the individual changes that occur in the different expressions.
In the posed smile expression, there was a difference between girls and females in the RC – RCO changes, but this difference was not statistically signifi cant. This may be due to a type II error, which means that the null hypothesis should not be rejected. A simple explanation for this phenomenon would be the relatively small sample size that would not allow the detection of possible differences. This may also be the case for the not signifi cant, but assumed differences in the posed smile and the lip pucker expression.
A possible explanation for the observed differences could be in the underlying muscular tissue. The risorius and buccinator muscles are responsible for horizontal movements in the posed smile, while the orbicularis oris is mainly responsible for the lip puckering movement. In both expressions, the levator labii superioris and zygomaticus major are responsible for the vertical component of the expression ( Brand and Isselhard, 1998 ). A possible explanation for the differences found between the genders or age groups could be due to developmental differences of these muscles.
Apart from this anatomical hypothesis, other hypotheses should be considered. Might there be age differences in the interpretation of the instructions? Are children less able to understand certain verbal commands than adults? Are children more similar to the female adults and the adult males are different? Is this socialization?
Otto (1998) found that females smile more expansively and more often than males. Johnston et al. (2003) reported that females reproduced a maximal smile more accurately
and postulated that it was due to their more frequent use of such an expression. It could thus be that children and females use the expression more frequently than males and therefore have ‘ wider ’ smiles. The change between boys to adult males of a decrease in this horizontal component of the smile could be due to social aspects. Males seem to have a more upward vertical component in their expressions, and less horizontal percentage change, which could be due to a phylogenetic male characteristic, the ‘ aggressive ’ demeanour ( Björkqvist, 1994 ).
It was important to select from the very diverse set of facial expressions, those that would best characterize the neuromuscular tissue to be studied and evaluated in the perioral area. The identifi cation of such expressions was aided by previous work from Ekman and Friesen (1978) , which created a database that defi ned and coded a large number of facial expressions and associated each expression with the muscles used to produce them.
The selection of expressions used in this study was also based on the reproducibility of the two expressions. The fi ndings are in agreement with the conclusions of several studies that the rest pose, the posed smile, and the lip pucker are the most reproducible expressions ( Frey et al. , 1994 ; Trotman et al. , 2000 ; Johnston et al. , 2003 ; Miyakawa et al. , 2006 ).
Due to a lack of information concerning gender and age differences, a cross-sectional study was performed in order to determine the tendencies and patterns between the groups of individuals and whether gender and age played a role in these tendencies. It was found that the use of video sequencing is a reliable tool in detecting these differences. It is important to follow the development of each group further in depth to understand why these changes between childhood and adulthood occur. Therefore, it is necessary to investigate these changes over time with longitudinal studies. Further research is necessary to examine the infl uence of dentofacial discrepancies on facial expressions as well as the possible infl uence of orthodontics or jaw orthopaedics in growing individuals.
Figure 4 Percentage changes of the distances between the rest position and lip pucker: Bars represent
the mean values of the percentage change and T-bars, the 95 per cent confi dence interval of the mean. * P ≤ 0.05, *** P ≤ 0.001. ns, not signifi cant.
Conclusions
1. Gender differences were found in adults. Males had a vertical upward component more pronounced both in the posed smile and the lip pucker, while females had a more pronounced horizontal component in the posed smile.
2. The vertical characteristics in the facial expressions are not established in children, possibly indicating devel-opment of the mimic musculature from childhood to adulthood.
Address for correspondence Odyssia Houstis Department of Orthodontics School of Dentistry University of Geneva 19 Rue Barthélemy-Menn 1205 Geneva Switzerland E-mail: [email protected] References
Björkqvist K 1994 Sex differences in physical, verbal, and indirect aggression: a review of recent research . Sex Roles 30 : 177 – 188 Brand R W , Isselhard D E 1998 Anatomy of orofacial structures . 6th edn .
Mosby Inc. , St. Louis
Darrah J , Magill-Evans J , Volden J , Hodge M , Kembhavi G 2007 Scores of typically developing children on the Peabody Developmental Motor Scales: infancy to preschool . Physical and Occupational Therapy in Pediatrics 27 : 5 – 19
Dulguerov P , Wang D , Perneger T V , Marchal F , Lehmann W 2003 Videomimicography: the standards of normal revised . Archives of Otolaryngology-Head and Neck Surgery 129 : 960 – 965
Ekman P , Friesen W V 1978 Facial action coding system: a technique for the measurement of facial movements . Consulting Psychologists Press Inc. , Palo Alto, California
Ekman P , O’Sullivan M , Friesen W V , Scherer K R 1991 Face, voice and body in detecting deception . Journal of Nonverbal Behavior 15 : 125 – 135
Frey M , Jenny A , Giovanoli P , Stüssi E 1994 Development of a new documentation system for facial movements as a basis for the international registry for neuromuscular reconstruction in the face . Plastic and Reconstructive Surgery 93 : 1334 – 1349
Houston W J B 1983 Analyses of errors in orthodontic measurements . American Journal of Orthodontics 83 : 382 – 389
Johnston D J , Millett D T , Ayoub A F 2003 Are facial expressions reproducible? . Cleft Palate-Craniofacial Journal 40 : 291 – 296
Miyakawa T , Morinushi T , Yamasaki Y 2006 Reproducibility of a method of analysis of morphological changes in perioral soft tissue in children using video cameras . Journal of Oral Rehabilitation 33 : 202 – 208
Neiva F C , Wertzner H F 1996 A protocol for oral myofunctional assessment: for application with children . International Journal of Orofacial Myology 22 : 8 – 19
Otto E 1998 Sex differences over age groups in self-posed smiling in photographs . Psychological Reports 83 : 907 – 913
Paletz J L , Manktelow M D , Chaban R 1994 The shape of a normal smile: implications for facial paralysis reconstruction . Plastic and Reconstructive Surgery 93 : 784 – 789
Rasheed S A , Munshi A K 1996 Electromyographic and ultrasonographic evaluation of the circum-oral musculature in children . Journal of Clinical Pediatric Dentistry 20 : 305 – 311
Santrock J W 1999 Life-span development , 7th edn . McGraw-Hill College Companies, Inc. , College Station, Texas
Trotman C A , Faraway J J 2004 Modeling facial movement: I. A dynamic analysis of differences based on skeletal characteristics . Journal of Oral and Maxillofacial Surgery 62 : 1372 – 1379
Trotman C A , Faraway J J , Essick G K 2000 Three-dimensional nasolabial displacement during movement in repaired cleft lip and palate patients . Plastic and Reconstructive Surgery 105 : 1273 – 1283
Trotman C A , Stohler S S , Johnston Jr L E 1998 Measurement of facial soft tissue mobility in man . Cleft Palate-Craniofacial Journal 35 : 16 – 25 Weeden J C , Trotman C A , Faraway J J 2001 Three dimensional analysis
of facial movement in normal adults: infl uence of sex and facial shape . Angle Orthodontist 71 : 132 – 140
Yamaguchi K , Morimoto Y , Nanda R S , Ghosh J , Tanne K 2000 Morphological differences in individuals with lip competence and incompetence based on electromyographic diagnosis . Journal of Oral Rehabilitation 27 : 893 – 901