Effect of acceleration forces during transport through
a pneumatic tube system on ROTEM
®
analysis
Gerhard Amann
1, Christine Zehntner
1, Florian Marti
1and Giuseppe Colucci
2,*
1
Department of Anaesthesiology and Pain Therapy ,
Kantonsspital Winterthur, Winterthur , Switzerland
2
Department of Haematology and Central Haematology
Laboratory , Inselspital, Bern University Hospital and
University of Bern , Switzerland
Abstract
Background: ROTEM
®is considered a helpful point-of-care
device to monitor blood coagulation in emergency situations.
Centrally performed analysis is desirable but rapid transport
of blood samples is an important prerequisite. The effect of
acceleration forces on sample transport through a pneumatic
tube system on ROTEM
®should be tested at each institution
to exclude a pre-analytical infl uence. The aims of the
pres-ent work were: (i) to investigate the effect of pneumatic tube
transport on ROTEM
®parameters; (ii) to compare blood
sample transport via pneumatic tube vs. manual
transporta-tion; and (iii) to determine the effect of acceleration forces on
ROTEM
®parameters.
Methods: This is a single centre study with 20 healthy
volun-teers. Five whole blood samples were transferred to the central
haematology laboratory by either normal transport or pneumatic
delivery with different speed and acceleration forces. EXTEM,
INTEM, FIBTEM and APTEM were analysed in parallel with
two ROTEM
®devices and compared. Acceleration forces were
measured during transport with two different instruments.
Results:
Increment of transport time, speed and distance
resulted in an augmentation of acceleration forces and peaks.
All results of the ROTEM
®analysis after manual transport
or pneumatic delivery were within normal range. However,
increase in acceleration forces resulted in minimally but
sta-tistically signifi cant changes in multiple ROTEM
®parame-ters. The higher the acceleration forces, the more ROTEM
®parameters are infl uenced.
Conclusions: Acceleration forces during transport through
a pneumatic tube system have an infl uence on ROTEM
®parameters. Prior to transfer blood samples via pneumatic
tube system these infl uences should be tested to exclude
clinically relevant blood coagulation activation in vitro.
Keywords: acceleration forces; coagulation; laboratory based
ROTEM
®; pneumatic tube transport; point-of-care.
Introduction
The modifi ed rotation thrombelastometry (ROTEM
®) was
developed as a point-of-care coagulation monitoring device.
The automatised system allows determination of the
coagu-lation proprieties of whole blood during clot formation and
lysis (1) . With simple handling the method enables rapid
anal-ysis and results are graphically visualised live on a display.
The device shows four pictures named EXTEM, INTEM,
FIBTEM and APTEM which depict the clotting process after
activation with different agonist. The coagulation is activated
either with ellagic acid, which leads to a standardised
acti-vation of the contact phase of the intrinsic system (INTEM)
or thromboplastin from rabbit brain which is used for the
activation of the extrinsic coagulation system (EXTEM). In
addition, reagents, such as aprotinin (APTEM) or
cytochala-sin D (FIBTEM) are used in order to study the EXTEM with
(in vitro) inhibition of fi brinolytic activity (APTEM) and the
EXTEM with inhibition of platelets (FIBTEM), respectively.
Results are available 10 – 15 min after blood collection. The
device is fast and is helpful especially in emergency
situa-tions with life-threatening bleeding
(2)
. The four pictures
should enable the coagulation defect to be identifi ed and a
therapeutic option to be found. During emergency treatment,
the simultaneous execution of ROTEM
®analysis represents
an additional task for the attending team. The ROTEM
®delta
device allows real time transmission of on-going ROTEM
®results to different sites without time delay. This option
encourages installing and performing ROTEM
®analysis in
a central laboratory. Consequently, rapid transport of blood
samples to a central laboratory is a prerequisite. Automated
transport systems have been developed to reduce the
turn-around time and workload. Pneumatic tube systems are
widely used in hospitals
(3)
. Transport of blood samples
through the pneumatic tube system may be advantageous also
for ROTEM
®analysis. However, samples in the pneumatic
tube are subjected to acceleration and deceleration forces
nec-essary to achieve high speed in order to cover long distances
quickly. Pneumatic tube systems vary in diameter, size of the
capsule, number of lines and transfer stations as well as forces
to achieve the necessary speed. These forces on blood
sam-ples are known to cause certain cell damage infl uencing
rou-tine haematology results (4, 5) . Signifi cant changes in lactate
dehydrogenase concentrations (6) , effects on blood gas
mea-surements (7 – 9) and on thromboelastographic analysis with
the TEG 5000
®(4) have been described. Pre-analytical effects
of pneumatic tube transport on coagulation parameters and
*Corresponding author: Giuseppe Colucci, Department ofHaematology and Central Haematology Laboratory Inselspital, Bern University Hospital and University of Bern, Freiburgstrasse 10, 3010 Bern, Switzerland
Phone: + 41 31 6320264, Fax: + 41 31 6323406 , E-mail: [email protected]
Received October 31, 2011; accepted February 6, 2012; previously published online March 9, 2012
platelet function have also been evaluated (10 – 12) . Finally,
each pneumatic transport system possesses a unique technical
and structural pattern and should be tested for pre-analytical
effects (13) , including effects with regard to ROTEM
®analy-sis (14) . Indeed the manufacturer of the ROTEM
®delta device
advises against the transport of blood samples via pneumatic
tube unless the infl uence of local mechanical transport system
is investigated.
The aims of the present work were: (i) to investigate the
effect of pneumatic tube transport on ROTEM
®parameters;
(ii) to compare blood sample transport via pneumatic tube vs.
manual transport; and (iii) to determine the effect of
accelera-tion forces on ROTEM
®parameters.
Materials and methods
The study was performed at the Kantonsspital Winterthur after ap-proval from the Local Ethics Committee (Kantonale Ethikkommission Z ü rich, KEK-ZH-Nr. 2011-0222). After informed consent, 20 healthy volunteers were recruited and prospectively enrolled by medical personal at our institution. Exclusion criteria were: (i) age under 18 years; (ii) systolic blood pressure below 100 mm Hg; (iii) known coagulation disorders; (iv) illness or surgery in the last 4 weeks; (v) transfusion in the last 12 months; and (vi) intake of any medica-tion including contraceptives and analgesics. Whole blood samples were collected from an anticubital vein into fi ve 4.3 mL plastic vials (S-Monovette ® 4.3 mL 0NC; Sarstedt, N ü mbrecht, Germany) con-taining 0.43 mL 0.106 mol/L trisodium citrate solution. All samples were collected in the central operating unit and labelled A, B, C, D and E, respectively. Sample A was delivered manually to the central haematology laboratory at room temperature. Sample B was sent by pneumatic tube system with a velocity of 3 m/s according to local standard “ priority ” mode. Samples C, D and E were sent through the pneumatic tube system with a velocity of 7 m/s for 270 m, 540 m and 1080 m, respectively (Table 1 ).
Pneumatic tube system and acceleration forces
The pneumatic tube system at the Kantonsspital Winterthur (Transmatic MC 14/NW 125; Transro AG, Wohlen, Switzerland) is a one-tube-system consisting of 14 lines with intersection at two trans-fer stations. Blood samples sent to the central laboratory have a stan-dard “ priority ” mode (direct transfer) and a velocity of 3 m/s. The capsules sent to destinations outside the central laboratory have a ve-locity of 7 m/s. To measure the acceleration forces during pneumatic delivery, we used two devices: IPod touch (Apple ® Inc.; Cupertino,
USA) with an associated application (SensorData, Wavefront Labs © ;
distributed by Apple ® Inc.; Cupertino, USA) which measures linear and rotation acceleration forces with a frequency of 100 Hz (see Supplemental data Figure 1A ; accompanies the online version
of this article at http://www.degruyter.com/view/j/cclm.2012.50. issue-8/issue-fi les/cclm.2012.50.issue-8.xml). This device was fi xed to the capsule (see Supplemental data Figure 2A ). Because the linear accelerations measured using the IPod are limited to maximal 2 g (unit of measure of acceleration due to gravity at the earth ’ s surface) we used a second device. The second device was a self recording im-pact accelerometer X250-2 (Gulf Coast Data Concepts © ; Waveland,
USA) which measures with a frequency of 256 Hz. The latter is very light (33 g, see Supplemental data Figure 1B) and was placed inside the capsule close to the blood sample (see Supplemental data Figure 2B). X250-2 measures forces in the range of ± 28 g . The two devices measured accelerations in three axes x, y, z, and the raw data have to be corrected for an offset value (for details see Supplemental data). Acceleration forces are expressed as area under the curve (AUC) and numbers of acceleration peaks (n).
ROTEM ® analysis
Analysis of all samples was performed using two identical ROTEM ®
delta devices (ROTEM ® 1 and ROTEM ® 2; Axon Lab AG, Baden,
Switzerland) placed at the central haematology laboratory of the Kantonsspital Winterthur. Quality control of the devices was per-formed initially following the internal quality protocol with the respec-tive reagent (ROTROL N; Pentapharm AG Basel, Switzerland). All tests were performed by the fi rst author of this study, who was initially trained and supervised by qualifi ed laboratory staff. Prior to ROTEM ® analysis, all samples were placed over the ROTEM ® delta devices at 37 ° C for 5 min and all measurements were performed at this tempera-ture. The reagents, stored at temperatures between 4 ° C and 8 ° C, were kept at room temperature for 10 min and shaken gently before pipetted. INTEM, EXTEM, FIBTEM and APTEM test were performed as de-scribed previously (14) . For each analysis standard ROTEM ® param-eters, such as clotting time (CT, s), A5 (clot thickness after 5 min, mm), A10 (clot thickness after 10 min, mm), A15 (clot thickness after 15 min, mm), A30 (clot thickness after 30 min, mm), clot formation time (CFT, s), maximum clot fi rmness (MCF, mm), alpha ( α , angle) LI30 (lysis index after 30 min), LI45 (lysis index after 45 min), ML (maximal lysis) and AUC (area under the curve) were measured. These parameters describe: (i) the period from analysis start until a 2 mm amplitude occurs (CT); (ii) the subsequent period until an amplitude of 20 mm is reached (CFT); (iii) the kinetics of clot formation ( α ); (iv) the clot fi rmness at different time points (A5 after 5 min, A10 after 10 min, A15 after 15 min and A30 after 30 min); (v) the maximum fi rm-ness that the clot achieves during the analysis (MCF); (vi) the fi brin-olysis at particular time point (LI30 after 30 min, LI45 after 45 min); and (vii) the maximum fi brinolysis detected (ML).
Statistical analysis
All quantitative data are expressed as median and interquartile range (IQR). Non-parametric statistic was applied and performed with SPSS Statistics Version 19 © software (SPSS Inc., Chicago,
Table 1 Study design (results expressed as median and interquartile range, IQR). Delivery mode Total distance Speed Pneumatic
transport time
Linear acceleration forces (AUC)
Linear acceleration peaks > 25 g (n)
Sample A Manual 50 m Walk – – –
Sample B Pneumatic priority 270 m 3 m/s 135 s (117 – 149) 95.9 (93.3 – 99.3) 3.5 (3 – 4) Sample C Pneumatic normal 270 m 7 m/s 176 s (152 – 203) 116.3 (114.5 – 117.7) 4.5 (4 – 8) Sample D Pneumatic normal 540 m 7 m/s 334 s (315 – 390) 213.1 (208.2 – 223.3) 9.0 (5 – 10) Sample E Pneumatic normal 1080 m 7 m/s 652 s (568 – 852) 413.2 (406.5 – 427.3) 18.5 (13 – 22)
IL, USA), SigmaPlot 11.0 (Systat Software, Inc., Chicago, USA) and Microsoft Excel 2010 © (Microsoft Corporation; Redmont, OR,
USA). Comparisons were performed with the Wilcoxon signed rank test. A two-tailed p value of < 0.05 was considered signifi cant. The offset correction of the X250-2 logger, the AUC of the accelera-tion vectors and the peaks were calculated with Octave 3.2.4 (Free Software Foundation; Boston, MA, USA).
Results
Twenty healthy volunteers [median age 41.4 years (range
27 – 52), comprising 8 women [median age 47 years (range 28 –
52)] and 12 men [median age 34 years (range 27 – 49)]] were
enrolled. All citrated blood samples were labelled A, B, C, D,
E, respectively and sent through pneumatic delivery system
with a defi ned velocity (samples B – E) or hand carried to
cen-tral laboratory (sample A, Table 1). Median transport time of
sample A was 157 seconds (s) (IQR: 147 – 169 s). Median
trans-port time in the pneumatic tube was 135 s (IQR: 117 – 149 s)
for sample B, 176 s (IQR: 152 – 203 s) for sample C, 334 s (IQR:
315 – 390 s) for sample D, 652 s (IQR: 568 – 852 s) for sample
E, respectively. The rotation acceleration force measured with
IPod (median AUC, rad/s) was 3745 (IQR: 3674 – 3833, range
4.24 % ) for sample B, 4400 (IQR: 4342 – 4460, range 2.67 % )
for sample C, 8557 (IQR: 8526
–
8602, range 0.88
%
) for
sample D and 17249 (IQR: 17101 – 17353, range 1.47 % ) for
sample E, respectively. The linear acceleration forces (median
AUC, m/s) measured with the device placed inside the capsule
(X250-2) was 95.9 (IQR: 93.9 – 99.3, range 5.59 % ) for sample
B, 116.3 (IQR: 114.5 – 117.7, range 2.74 % ) for sample C, 213.1
(IQR: 208.1 – 223.3, range 7.13 % ) for sample D and 413.2
(IQR: 406.5 – 427.3, range 5.03 % ) for sample E, respectively.
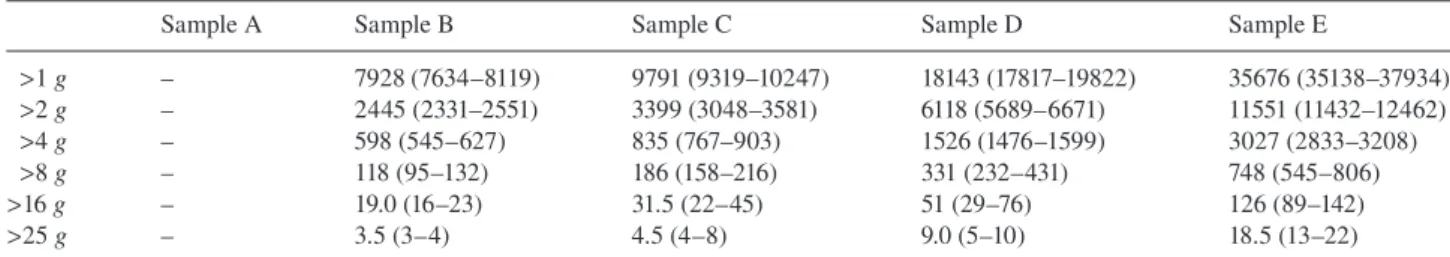
Linear acceleration peaks are summarised in Tables 1 and 2
.
Median time between blood collection and start of ROTEM
®test was 11 min (IQR: 10 – 12 min) for sample A, 17 min (IQR:
16 – 20 min) for sample B, 81 min (IQR: 79 – 86 min) for
sam-ple C, 130 min (IQR: 126 – 144 min) for samsam-ple D and 157 min
(IQR: 151 – 160 min) for sample E, respectively.
Table 2 Linear acceleration peaks measured during tube transport delivery (n, median and IQR).
Sample A Sample B Sample C Sample D Sample E
> 1 g – 7928 (7634 – 8119) 9791 (9319 – 10247) 18143 (17817 – 19822) 35676 (35138 – 37934) > 2 g – 2445 (2331 – 2551) 3399 (3048 – 3581) 6118 (5689 – 6671) 11551 (11432 – 12462) > 4 g – 598 (545 – 627) 835 (767 – 903) 1526 (1476 – 1599) 3027 (2833 – 3208) > 8 g – 118 (95 – 132) 186 (158 – 216) 331 (232 – 431) 748 (545 – 806) > 16 g – 19.0 (16 – 23) 31.5 (22 – 45) 51 (29 – 76) 126 (89 – 142) > 25 g – 3.5 (3 – 4) 4.5 (4 – 8) 9.0 (5 – 10) 18.5 (13 – 22)
Table 3 Results of thromboelastometry: manual transport (sample A) and pneumatic delivery (3 m/s, 270 m: sample B): median and interquartile range (IQR).
EXTEM INTEM
Sample A (manual) Sample B p-Value Sample A (manual) Sample B p-Value
CT 50 (47 – 54) 51 (46 – 53) 0.738 176 (165 – 202) 169 (158 – 185) 0.245 A5 45 (41 – 48) 46 (42 – 48) 0.263 46 (43 – 49) 46 (43 – 49) 0.258 A10 56 (52 – 58) 56 (52 – 57) 0.021 55 (53 – 58) 55 (52 – 57) 0.182 A15 60 (57 – 62) 59 (56 – 60) < 0.001 59 (56 – 62) 59 (56 – 60) 0.024 A30 62 (59 – 64) 61 (58 – 63) < 0.001 60 (57 – 62) 58 (56 – 61) 0.004 CFT 86 (76 – 102) 87 (77 – 97) 0.734 66 (58 – 81) 66 (58 – 77) 0.869 MCF 62 (60 – 64) 61 (59 – 63) < 0.001 62 (57 – 62) 60 (57 – 61) 0.027 α 73 (70 – 74) 72 (71 – 75) 0.839 77 (74 – 78) 77 (75 – 78) 0.953 AUC 6212 (5933 – 6382) 6089 (5858 – 6249) < 0.001 6118 (5678 – 6212) 5964 (5640 – 6087) 0.033 FIBTEM APTEM
Sample A (manual) Sample B p-Value Sample A (manual) Sample B p-Value
CT 46 (44 – 48) 47 (43 – 49) 0.922 51 (48 – 54) 48 (47 – 55) 0.756 A5 10 (10 – 13) 12 (10 – 13) 0.241 46 (40 – 49) 44 (43 – 48) 0.241 A10 11 (11 – 13) 12 (10 – 13) 0.277 55 (51 – 58) 55 (51 – 57) 0.135 A15 12 (11 – 14) 13 (10 – 13) 0.715 60 (57 – 62) 59 (55 – 61) 0.068 A30 12 (11 – 13) 13 (11 – 14) 0.561 62 (58 – 64) 61 (57 – 62) < 0.001 CFT – – – 88 (73 – 105) 89 (76 – 97) 0.277 MCF 12 (11 – 13) 13 (11 – 14) 0.706 62 (58 – 64) 61 (58 – 63) 0.021 α 68 (63 – 72) 67 (64 – 70) 0.829 72 (69 – 75) 72 (71 – 74) 0.326 AUC 1183 (1112 – 1350) 1222 (1078 – 1335) 0.674 6209 (5818 – 6355) 6044 (5775 – 6248) 0.008 ROTEM ® parameters: clotting time (CT, s), clot thickness (A5 after 5 min, A10 after 10 min, A15 after 15 min, A30 after 30 min, respectively, mm), clot formation time (CFT, s), maximum clot fi rmness (MCF, mm), alpha ( α , angle) and AUC (area under the curve).
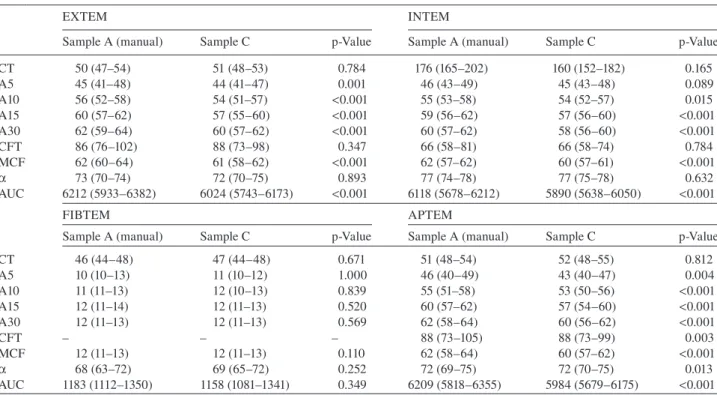
Table 4 Results of thromboelastometry: manual transport (sample A) and pneumatic delivery (7 m/s, 270 m: sample C): median and interquartile range (IQR).
EXTEM INTEM
Sample A (manual) Sample C p-Value Sample A (manual) Sample C p-Value
CT 50 (47 – 54) 51 (48 – 53) 0.784 176 (165 – 202) 160 (152 – 182) 0.165 A5 45 (41 – 48) 44 (41 – 47) 0.001 46 (43 – 49) 45 (43 – 48) 0.089 A10 56 (52 – 58) 54 (51 – 57) < 0.001 55 (53 – 58) 54 (52 – 57) 0.015 A15 60 (57 – 62) 57 (55 – 60) < 0.001 59 (56 – 62) 57 (56 – 60) < 0.001 A30 62 (59 – 64) 60 (57 – 62) < 0.001 60 (57 – 62) 58 (56 – 60) < 0.001 CFT 86 (76 – 102) 88 (73 – 98) 0.347 66 (58 – 81) 66 (58 – 74) 0.784 MCF 62 (60 – 64) 61 (58 – 62) < 0.001 62 (57 – 62) 60 (57 – 61) < 0.001 α 73 (70 – 74) 72 (70 – 75) 0.893 77 (74 – 78) 77 (75 – 78) 0.632 AUC 6212 (5933 – 6382) 6024 (5743 – 6173) < 0.001 6118 (5678 – 6212) 5890 (5638 – 6050) < 0.001 FIBTEM APTEM
Sample A (manual) Sample C p-Value Sample A (manual) Sample C p-Value
CT 46 (44 – 48) 47 (44 – 48) 0.671 51 (48 – 54) 52 (48 – 55) 0.812 A5 10 (10 – 13) 11 (10 – 12) 1.000 46 (40 – 49) 43 (40 – 47) 0.004 A10 11 (11 – 13) 12 (10 – 13) 0.839 55 (51 – 58) 53 (50 – 56) < 0.001 A15 12 (11 – 14) 12 (11 – 13) 0.520 60 (57 – 62) 57 (54 – 60) < 0.001 A30 12 (11 – 13) 12 (11 – 13) 0.569 62 (58 – 64) 60 (56 – 62) < 0.001 CFT – – – 88 (73 – 105) 88 (73 – 99) 0.003 MCF 12 (11 – 13) 12 (11 – 13) 0.110 62 (58 – 64) 60 (57 – 62) < 0.001 α 68 (63 – 72) 69 (65 – 72) 0.252 72 (69 – 75) 72 (70 – 75) 0.013 AUC 1183 (1112 – 1350) 1158 (1081 – 1341) 0.349 6209 (5818 – 6355) 5984 (5679 – 6175) < 0.001 ROTEM ® parameters: clotting time (CT, s), clot thickness (A5 after 5 min, A10 after 10 min, A15 after 15 min, A30 after 30 min, respectively, mm), clot formation time (CFT, s), maximum clot fi rmness (MCF, mm), alpha ( α , angle) and AUC (area under the curve).
Table 5 Results of thromboelastometry: manual transport (sample A) and pneumatic delivery (7 m/s, 1080 m: sample E): median and interquartile range (IQR).
EXTEM INTEM
Sample A (manual) Sample E p-Value Sample A (manual) Sample E p-Value
CT 50 (47 – 54) 48 (44 – 49) 0.008 176 (165.25 – 201.5) 156 (150 – 177) 0.058 A5 45 (41 – 48) 43 (40 – 46) < 0.001 46 (43 – 49) 45 (41 – 48) 0.003 A10 56 (52 – 58) 53 (50 – 55) < 0.001 55 (53 – 58) 54 (51 – 56) < 0.001 A15 60 (57 – 62) 57 (55 – 60) < 0.001 59 (56 – 62) 57 (54 – 59) < 0.001 A30 62 (59 – 64) 60 (56 – 61) < 0.001 60 (57 – 62) 58 (53 – 60) < 0.001 CFT 86 (76 – 102) 91 (80 – 103) 0.442 66 (58 – 81) 72 (60 – 84) 0.202 MCF 62 (59 – 64) 60 (57 – 62) < 0.001 62 (57 – 62) 59 (54 – 60) < 0.001 α 73 (70 – 75) 72 (69 – 74) 0.301 76 (74 – 78) 76 (74 – 78) 0.890 AUC 6212 (5933 – 6382) 5983 (5636 – 6159) < 0.001 6118 (5678 – 6212) 5872 (5410 – 6015) < 0.001 FIBTEM APTEM
Sample A (manual) Sample E p-Value Sample A (manual) Sample E p-Value
CT 46 (44 – 48) 44 (41 – 47) 0.001 51 (48 – 54) 49 (46 – 51) 0.096 A5 10 (10 – 13) 11 (10 – 12) 0.542 46 (40 – 49) 43 (39 – 46) < 0.001 A10 11 (11 – 13) 11 (11 – 12) 0.080 55 (51 – 58) 52 (50 – 55) < 0.001 A15 12 (11 – 14) 12 (11 – 13) 0.173 60 (57 – 62) 56 (54 – 59) < 0.001 A30 12 (11 – 14) 13 (11 – 14) 0.678 62 (58 – 64) 59 (56 – 61) < 0.001 CFT – – – 88 (73 – 105) 91 (76 – 104) 0.490 MCF 12 (11 – 13) 12 (11 – 13) 0.263 62 (58 – 64) 60 (56 – 61) < 0.001 α 68 (63 – 72) 69 (64 – 72) 0.903 72 (69 – 75) 72 (69 – 75) 0.588 AUC 1183 (1112 – 1350) 1200 (1059 – 1298) 0.245 6209 (5818 – 6355) 5915 (5593 – 6104) < 0.001 ROTEM ® parameters: clotting time (CT, s), clot thickness (A5 after 5 min, A10 after 10 min, A15 after 15 min, A30 after 30 min, respectively, mm), clot formation time (CFT, s), maximum clot fi rmness (MCF, mm), alpha ( α , angle) and AUC (area under the curve).
All results of the ROTEM
®analysis of sample A were within
normal range (Table 3
) (15) . Transport through the pneumatic
tube system with a low velocity of 3 m/s (according to local
standard “ priority ” mode, sample B) produce minimal but
sta-tistically signifi cant changes in multiple parameters of EXTEM
(A10, A15, A30, MCF and AUC, Table 3) and one parameter
of INTEM and APTEM (A30, Table 3). Increase in
accelera-tion forces resulted in changes evident in multiple ROTEM
®parameters (Tables 3 – 5
, and Supplemental data Tables 1 and 2
).
The higher the acceleration forces, the more ROTEM
®param-eters are infl uenced, including INTEM and APTEM (Tables 4
and 5). FIBTEM is only minimally or not infl uenced by high
acceleration forces (Table 5). Although these differences are
statistically signifi cant, all results of ROTEM
®parameters of
samples transported via pneumatic tube system are within the
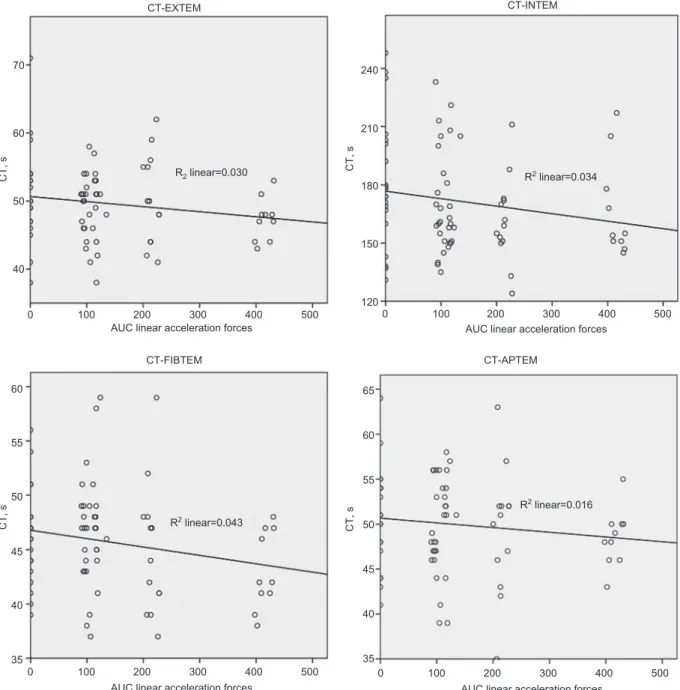
normal range. The changes in ROTEM
®parameters are more
numerous with the increase in linear and rotation acceleration
forces (Figures 1 – 3 , and Supplemental data Figure 3 ). Lysis
parameters are infl uenced only by high acceleration forces (see
Supplemental data Table 3
).
Discussion
Originally designed as a point-of-care device, the
ROTEM-analyser allows a fast evaluation of coagulation function in
whole blood. Results of ROTEM
®parameters are visualised
live on display directly after the start of blood analysis. The
70 60 CT, s R2 linear=0.030 CT, s R2 linear=0.043 CT-EXTEM CT-FIBTEM CT-APTEM CT-INTEM R2 linear=0.034 R2 linear=0.016 50 40 0 100 200 300
AUC linear acceleration forces400 500
0 35 45 50 CT, s CT, s 55 60 40 100 200 300
AUC linear acceleration forces
400 500 350 40 45 50 55 60 65 100 200 300
AUC linear acceleration forces
400 500 0 100 120 150 180 210 240 200 300
AUC linear acceleration forces
400 500
device may be useful, especially in emergency situations with
severe bleeding where time is critical, the attending
physi-cian needs to obtain information on the type and dimension
of a coagulation disorder fast. But often, emergency medical
and nursing staff are busy treating the patient, and the
perfor-mance of laboratory analysis on site may be delayed. Under
these circumstances it may be advantageous to perform
analysis centrally. Rapid transportation of blood samples to
the central laboratory is then a prerequisite. For this purpose
pneumatic tube transport systems have been developed and
are widely utilised today. To assure quality of analysis, blood
coagulation activation by acceleration and deceleration along
the trajectory in the pneumatic tube delivery system should be
excluded. Comparison of manual and pneumatic delivery of
blood samples should be performed to exclude pre-analytical
infl uences (13, 14) . The fi rst aim of the present study was to
investigate the effect of transport on ROTEM
®parameters.
We show that the mode of transport can infl uence the results.
The second aim of this work was to compare blood sample
transport via pneumatic tube vs. manual and we show that the
differences, although minimal are signifi cant. At our
institu-tion, samples being sent to the central laboratory unit have a
slow velocity (of 3 m/s) with a special, direct “
priority-trans-port ” . Our fi ndings show that although all results were within
the normal ranges, the transport through the pneumatic system
had infl uence on the multiple ROTEM
®parameters. Finally,
to determine the effect of acceleration forces on ROTEM
®results we used different speed and distances resulting in
7065
A10, mm R2 linear=0.066 A10, mm
R2 linear=0.002 R2 linear=0.051 R2 linear=0.038 A10-EXTEM A10-INTEM A10-FIBTEM A10-APTEM 60 55 50 45 25 20 A10, mm A10, mm 10 15 45 50 55 60 65 70 45 50 55 60 65 5 0 100 200 300
AUC linear acceleration forces400 500
0 100 200 300
AUC linear acceleration forces400 500
0 100 200 300
AUC linear acceleration forces400 500
0 100 200 300
AUC linear acceleration forces400 500 Figure 2 Variation of A10 by increasing linear acceleration forces.
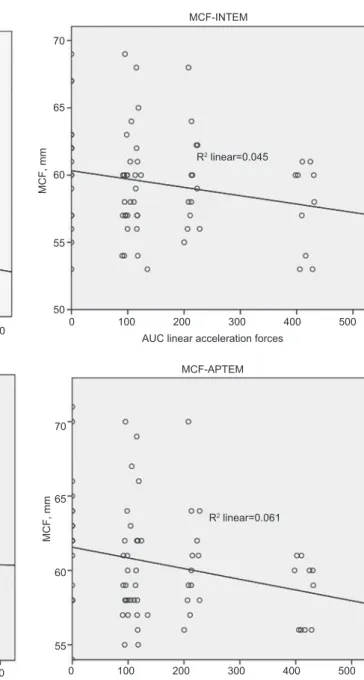
75 65 70 MCF, mm R2 linear=0.066 MCF, mm R2 linear=0.045 R2 linear=0.003 R2 linear=0.061 MCF-EXTEM 60 55 65 70 60 55 50 25 20 15 10 55 60 MCF, mm MCF, mm 65 70 5 0 100 200 300 MCF-FIBTEM MCF-APTEM MCF-INTEM
AUC linear acceleration forces400 500
0 100 200 300
AUC linear acceleration forces
400 500
0 100 200 300
AUC linear acceleration forces
400 500 0 100 200 300
AUC linear acceleration forces
400 500
Figure 3 Variation of MCF by increasing linear acceleration forces.
augmentation of acceleration forces. To measure the
accel-eration forces we used two different accelerometers (16) . We
show that an increase in acceleration forces resulted in
varia-tion of multiple ROTEM
®parameters, especially amplitude
(A) and maximum clot fi rmness (MCF). The changes in the
ROTEM
®parameters are more numerous with the increase
in linear and rotation acceleration forces. Interestingly, the
FITBEM is infl uenced only minimally, even with high
accel-eration forces. The FIBTEM is like the EXTEM but presence
of cytochalasin D blocks the contribution of platelets to whole
blood coagulation. It is not excluded, that the result observed
in this study could be caused by the alteration of
thrombo-cyte function. Of note, the FIBTEM is probably the ROTEM
®parameter which mostly affects patients ’ management.
This study reinforces the thesis, that comparison of manual
and local pneumatic delivery should be performed to exclude
relevant in vitro blood coagulation activation (14) . At each
insti-tution an evaluation of the transport system is necessary before
samples are routinely transported with a pneumatic tube system.
This evaluation is needed at each institution because the
trans-port systems are different (dependent on architectural, length
differences, acceleration forces, … ) and every single system
should be considered as a unique entity. In the present work all
results are within the normal range and differences are
prob-ably clinically not relevant. However, this conclusion cannot
be extrapolated to patients with bleeding disorders. The
com-parison should be performed with patient samples as well. An
additional weakness of this study is the time difference between
blood collection, transportation and ROTEM
®analysis. This
difference was due to the availability of only two ROTEM
®devices. However, prior publications show stability of blood
samples until 4 h after sampling (15, 17) . In addition, our results
show a difference already between manual and standard “
pri-ority ” mode and this difference slightly increases with
accel-eration and rotation forces. These results are discrepant but not
contradictory to our previously published work (14) because the
studies are conducted at two different institutions with different
tube transport systems and different acceleration forces.
In conclusion, acceleration forces during transport through
a pneumatic tube system infl uence ROTEM
®parameters
in whole blood samples in healthy volunteers. Prior to the
transfer of blood samples via a pneumatic tube system these
infl uences should be tested to exclude clinically relevant
pre-analytical blood activation in vitro.
Acknowledgments
We thank Axon Lab for lending ROTEM ® delta devices and reagents.
Further we thank Jan Kipping, Darwin Lavric, Peter Schumacher (consulting engineers) and Lorenzo Alberio, for their help and ad-vice regarding motion values. Giuseppe Colucci is supported by an unrestricted grant of CSL Behring.
Confl ict of interest statement
Authors ’ confl ict of interest disclosure: The authors stated that there are no confl icts of interest regarding the publication of this article. Research funding: None declared.
Employment or leadership: None declared. Honorarium: None declared.
References
1. Nielsen VG. A comparison of the Thrombelastograph and the ROTEM. Blood Coagul Fibrinolysis 2007;18:247 – 52.
2. Rugeri L, Levrat A, David JS, Delecroix E, Floccard B, Gros A, et al. Diagnosis of early coagulation abnormalities in trauma patients by rotation thrombelastography. J Thromb Haemost 2007;5:289 – 95.
3. Fernandes CM, Worster A, Eva K, Hill S, McCallum C. Pneumatic tube delivery system for blood samples reduces turnaround times without affecting sample quality. J Emerg Nurs 2006;32:139 – 43. 4. Wallin O, Soderberg J, Grankvist K, Jonsson PA, Hultdin J.
Preanalytical effects of pneumatic tube transport on routine
haematology, coagulation parameters, platelet function and global coagulation. Clin Chem Lab Med 2008;46:1443 – 9. 5. Koessler J, Kobsar AL, Brunner K, Stolz H, Dossler B, Walter
U, et al. The preanalytical infl uence of two different mechanical transport systems on laboratory analysis. Clin Chem Lab Med 2011;49:1379 – 82.
6. Pragay DA, Fan P, Brinkley S, Chilcote ME. A computer directed pneumatic tube system: its effects on specimens. Clin Biochem 1980;13:259 – 61.
7. Astles JR, Lubarsky D, Loun B, Sedor FA, Toffaletti JG. Pneumatic transport exacerbates interference of room air contamination in blood gas samples. Arch Pathol Lab Med 1996;120:642 – 7. 8. Victor Peter J, Patole S, Fleming JJ, Selvakumar R, Graham PL.
Agreement between paired blood gas values in samples trans-ported either by a pneumatic system or by human courier. Clin Chem Lab Med 2011;49:1303 – 9.
9. Collinson PO, John CM, Gaze DC, Ferrigan LF, Cramp DG. Changes in blood gas samples produced by a pneumatic tube system. J Clin Pathol 2002;55:105 – 7.
10. Dyszkiewicz-Korpanty A, Quinton R, Yassine J, Sarode R. The effect of a pneumatic tube transport system on PFA-100 trade mark closure time and whole blood platelet aggregation. J Thromb Haemost 2004;2:354 – 6.
11. Hubner U, Bockel-Frohnhofer N, Hummel B, Geisel J. The effect of a pneumatic tube transport system on platelet aggre-gation using optical aggregometry and the PFA-100. Clin Lab 2010;56:59 – 64.
12. Bolliger D, Seeberger MD, Tanaka KA, Dell-Kuster S, Gregor M, Zenklusen U, et al. Pre-analytical effects of pneumatic tube transport on impedance platelet aggregometry. Platelets 2009;20:458 – 65.
13. Plebani M, Zaninotto M. Pneumatic tube delivery systems for patient samples: evidence of quality and quality of evidence. Clin Chem Lab Med 2011;49:1245 – 6.
14. Colucci G, Giabbani E, Barizzi G, Urwyler N, Alberio L. Laboratory-based ROTEM((R)) analysis: implementing pneu-matic tube transport and real-time graphic transmission. Int J Lab Hematol 2011;33:441 – 6.
15. Lang T, Bauters A, Braun SL, Potzsch B, von Pape KW, Kolde HJ, et al. Multi-centre investigation on reference ranges for ROTEM thromboelastometry. Blood Coagul Fibrinolysis 2005;16:301 – 10.
16. Streichert T, Otto B, Schnabel C, Nordholt G, Haddad M, Maric M, et al. Determination of hemolysis thresholds by the use of data loggers in pneumatic tube systems. Clin Chem 2011;57: 1390 – 7.
17. Zurcher M, Sulzer I, Barizzi G, Lammle B, Alberio L. Stability of coagulation assays performed in plasma from citrated whole blood transported at ambient temperature. Thromb Haemost 2008;99:416 – 26.