Continuous electronic data capture of physiology,
behavior and experience in real life: towards
ecological momentary assessment of emotion
Frank H. Wilhelm
a,*, Monique C. Pfaltz
a, Paul Grossman
ba
Health Psychophysiology Laboratory, Department of Clinical Psychology and Psychotherapy, Institute for Psychology, University of Basel, CH-4055 Basel, Switzerland bPsychophysiology Research Laboratory, Department of Psychosomatic and Internal Medicine,
University of Basel Hospital, Hebelstrasse 2, CH-4031 Basel, Switzerland Received 20 July 2005; accepted 21 July 2005
Available online 1 September 2005
Abstract
Emotions powerfully influence our physiology, behavior, and experience. A comprehensive assessment of affective states in health and disease would include responses from each of these domains in real life. Since no single physiologic parameter can index emotional states unambiguously, a broad assessment of physiologic responses is desirable. We present a recently developed system, the LifeShirt, which allows reliable ambulatory monitoring of a wide variety of cardiovascular, respiratory, metabolic, motor-behavioral, and experiential responses. The system consists of a garment with embedded inductive plethysmography and other sensors for physiologic data recording and a handheld computer for input of experiential data via touch screen. Parameters are extracted offline using sophisticated analysis and display software. The device is currently used in clinical studies and to monitor effects of physical and emotional stress in naturalistic settings. Further development of signal processing and pattern recognition algorithms will enhance computerized identification of type and extent of physical and emotional activation.
q2005 Elsevier B.V. All rights reserved.
Keywords: Emotion; Respiration; Ambulatory monitoring; Inductive plethysmography; Affective computing; Wearable computers
www.elsevier.com/locate/intcom
0953-5438/$ - see front matter q 2005 Elsevier B.V. All rights reserved. doi:10.1016/j.intcom.2005.07.001
* Corresponding author. Tel./fax: C41 61 267 0593.
1. Introduction
Recording and recognizing physiologic signatures of emotion has become an increasingly important field of research in human–computer interaction (Picard, 1997). Continuous ambulatory monitoring of the affective state of individuals can expand our understanding of stress and emotions in daily life and their relationship to performance, health and disease. Emotional activation is manifest in three systems: the verbal-cognitive or language system, the behavior-motor system, and the physiologic system (Lang, 1978). Although activity in these systems originates within and is integrated by the central nervous system, the systems often empirically demonstrate a great degree of independence, with typical correlation coefficients in the order of 0.3–0.6 (Wilhelm et al., 2001d; Wilhelm and Roth, 2001). This non-redundancy makes capturing data from all three systems imperative. Emotional activation may be represented in a more reliable way if indices from different response systems are aggregated, and multisystem classification could result in reducing error of each individual measurement method (generally assumed to be independent) with respect to characterization of discrete emotional and behavioral states.
The physiologic system itself is multi-faceted since each response domain (e.g. cardiovascular, respiratory, electrodermal, skeletomotor, electrocortical, ocular and gastrointestinal) has its own unique, but interactive, organismic and protective functions (Sterling and Eyer, 1988). The patterning of the best adaptive response depends on the demand characteristics of the situation (‘situational response specificity’) and biological/ psychological characteristics of an individual (‘individual response stereotypy’) (Myrtek, 1984). Given this complexity, a comprehensive measurement of affective states would register responses across several physiologic domains since no single physiologic parameter is likely to index specific emotional states unambiguously.
Respiration is an important physiologic function that is multi-dimensional in nature. A detailed quantification of volume, timing and shape parameters in the respiratory pattern waveform can map into different emotional states along the dimensions of calm-excitement, relaxation–tenseness, and active vs. passive coping (Boiten et al., 1994; Grossman, 1983; Grossman and Wientjes, 2001; Wientjes, 1992). Specific emotion expressions, such as crying, startling or shouting, have unique respiratory signatures. Initial evidence indicates that respiratory parameters also map into the ‘affective space’ (Lang, 1995) dimensions of valence (aversive vs. appetitive stimulus quality) and arousal (activating vs. calming stimulus quality)(Ritz and Thons, 2002; Van Diest et al., 2001).
Detailed measurement of respiratory responses has been neglected in emotion research and in clinical practice, in large part because of the difficulties obtaining accurate measurements, both inside and outside the laboratory. The scarcity of respiratory monitoring in clinical contexts is of particular concern since any disturbance of respiratory function is potentially life threatening and carries great weight in clinical decisions. Long-term monitoring of respiratory function outside the hospital would be desirable for a variety of disorders that are known to be associated with respiratory abnormalities, e.g. sleep apnea syndrome, chronic obstructive pulmonary disease, pulmonary emphysema, restrictive lung disease, asthma, cardiac failure, or epilepsy. Furthermore, since emotions can profoundly affect respiration, our understanding of a spectrum of mental
and psychophysiological states and disorders associated with emotional activation is likely to benefit from a detailed monitoring of respiratory function. Assessment of respiratory responses may be relevant for a broad variety of research areas, including studies of the physiologic effects of mental load and stress, investigations of physiologic correlates of emotions and affect, and research linking physiologic responses to subjective distress and psychosomatic disorders.
Respiratory monitoring has also gained significance by the increasing realization that respiratory sinus arrhythmia (RSA), a commonly employed measure of heart rate variability, can better track changes in the activity of the parasympathetic nervous system (‘vagal activity’) when it is adjusted for respiratory confounds. Both tidal volume (quantifying the depth of each breath) and respiratory rate changes can seriously distort the relationship between vagal activity and RSA (Grossman et al., 1991). Recently, algorithms have been proposed that employ continuously measured respiratory parameters to reduce this distortion (Grossman et al., 2004; Wilhelm et al., 2004).
2. Inductive plethysmography measurement technology
Inductive plethysmography (IP) is the gold standard for unobtrusive respiratory monitoring and has been used widely in clinical and research settings. It was first implemented in the Respitracee device (Non-Invasive Monitoring Systems, Inc., Miami Beach, FL, USA) (Sackner et al., 1980). To date, approximately 1600 published scientific studies have used this technology and established it as the standard for non-invasive assessment of the pattern of breathing. This technique approximates the temporal dynamics and quantity of air moved by the respiratory system by measuring the expansion and contraction of both the rib cage and abdominal compartments (Gonzalez et al., 1984; Hill et al., 1982; Tobin et al., 1983). A respiratory IP sensor consists of an undulated arrangement of electrical wires embedded in elastic bands. A high-frequency, low-voltage oscillating current is passed through the wires to generate a magnetic field needed to measure the self-inductance of the coils, which is proportional to the cross-sectional area surrounded by the band. Calibration of the rib cage and abdominal bands by a fixed volume bag and summing of the two signals allows measurement of tidal volume (the air moved during inhalation and exhalation, in milliliters) (Chadha et al., 1982; Sackner et al., 1989).
In past years, we used a portable multi-channel recording system in our research (Vitaport, TEMEC Instruments, BV, The Netherlands) and the Respitrace device (Non-Invasive Monitoring Systems, Inc., Miami Beach, FL, USA) to study respiratory abnormalities in patients with anxiety disorders in their natural environment (Alpers et al., 2005; Wilhelm et al., 2001a,c; Wilhelm and Roth, 1996; 1997). Significant limitations were the size, troublesome operation, and difficulty in holding the sensors in place during normal daily activities, which rendered the system inadequate for routine clinical use and large-scale studies. In addition, in the absence of any satisfactory respiratory data analysis software, we were forced to develop our own (Wilhelm et al., 1999; Wilhelm and Roth, 1993).
3. The LifeShirt system
Technical innovations have led to the development of the LifeShirtw system
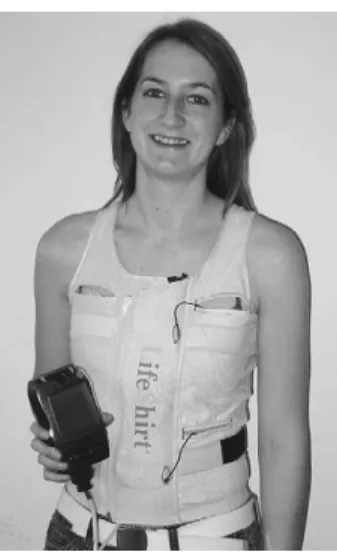
(VivoMetrics, Inc., Ventura, CA, USA), which represents a significant leap forward in ambulatory measurement technology. The LifeShirt is an easy-to-use non-invasive ambulatory monitoring system consisting of a garment with an array of embedded sensors, a handheld computer with data collection software, and a sophisticated software package (VivoLogicw) for comprehensive offline signal analysis, display, and report sheet
generation. Sensors are attached via secure connectors and a cable to a small custom-designed interface directly plugged into the port of the handheld computer (Fig. 1). The compact and lightweight computer serves as a digital recorder and can be worn on a belt or put into the pocket of a jacket. Since reliable online scoring of respiratory waveforms cannot easily be achieved because of the complexity of respiratory patterns and common movement artifacts (Wilhelm and Roth, 1998b), raw waveforms from the LifeShirt are captured with high sampling rates for storage and off-line detailed analysis. An exchangeable flash memory card provides large storage capacity.
3.1. Cardiovascular and respiratory monitoring
A large number of physiological parameters of clinical interest and of relevance for assessment of emotion and behavioral activity are extracted from the relatively small array of non-invasive sensors. The sensor array of the LifeShirt system is embedded in a sleeveless undergarment made of washable, reusable and highly stretchable material that fits snugly and can be worn comfortably for extended periods. Sensors for monitoring a variety of physiological signals relating to cardiovascular and respiratory activity are embedded in the shirt (Fig. 2). This ensures their correct and durable placement and makes it easier to set up the sensor array for multi-channel recording. The respiratory sensors are
based on IP technology, have a width of only about 1 inch and are excited through an extremely low current to minimize battery usage. One sensor is sewn into the shirt at the level of the rib cage and one at the level of the abdomen.
In addition to the two respiratory IP sensors, an extended investigational version of the LifeShirt system has a particularly sensitive IP sensor placed around the upper body to record chest wall movement resulting from heart activity (‘thoracocardiography’, e.g. Sackner et al., 1991). After suppression of respiratory movement with digital filtering this signal reflects the pumping activity of the heart (Bloch et al., 1999). Estimates of stroke volume (the amount of blood ejected with each heart beat) and cardiac output (the amount ejected per minute) can be then derived and calculated. These indices of systemic metabolic load can aid in determining if an individual experiences a stressful situation as a challenge or a threat (e.g.Quigley et al., 2002; Tomaka et al., 1997).
An electrocardiogram (ECG) is additionally recorded by means of three electrodes placed directly onto the skin on the upper chest and on the lateral surface of the abdomen. This standard configuration provides a single lead for ECG recording. The R-waves in the ECG are easily detected as upward spikes, and the consecutive intervals between them (R–R intervals) are converted to heart rate. The single-lead ECG waveform also allows a rough quantification of cardiac arrhythmias, e.g. intermittent short R–R intervals followed by compensatory long R–R intervals. However, since many ECG characteristics may not be visible in a single lead, a clinically validated 12-lead ECG is necessary for accurate classification of arrhythmias.
3.2. Physical activity monitoring
A small and sensitive accelerometer measures the intensity and direction of accelerating forces on the body. It is placed onto the shirt over the navel and measures acceleration in all three spacial axes. Since gravity pulls on the accelerometer in a downward direction, even subtle changes in the position of the trunk can be measured,
e.g. for distinguishing upright from supine postures. The accelerometer also reacts to walking and other activity with an undulating signal. This is being rectified and integrated and provides an index of intensity of physical activity. This so called ‘actigraphy’—often measured with a wrist-watch monitor (e.g. Actiwatchw, Mini Mitter Co., Inc., Bend,
OR)—is a widely used method in clinical and circadian rhythm research to quantify physical activity during the day, identify periods of rest and sleep, and quantify sleep efficiency and awakenings (e.g.Teicher, 1995). The signal also permits focusing in on portions of the tracing in which motion artifacts might be present and serves as a source of information that allows for physiologic data like heart or respiratory rate to be interpreted according to relative levels of activity.
3.3. Sleep monitoring
The IP technology of the LifeShirt is an excellent tool for detecting breathing abnormalities during sleep. A high level of agreement with polysomnography for the detection of apneas and hypopneas has been demonstrated in the sleep laboratory (Coyle et al., 2003a,b). Breathing pattern analysis allows a rough discrimination between wake state, rapid eye movement (REM) sleep, and non-REM sleep in most individuals since these states are characterized by typical breathing patterns. For example, good markers of REM vs. non-REM sleep are lower values of percent contribution of the rib cage excursions to tidal volume (about 50% reduction from non-REM) because of the partial chest immobility during REM sleep.
3.4. Optional sensors
With the addition of optional electroencephalogram (EEG, measuring brain waves) and electroocculogram channels (EOG, measuring eye movement), the LifeShirt system is able to reliably monitor sleep architecture for staging of sleep into phases of REM, non-REM, stages 1C2, and stages 3C4. Thus, more subtle disturbances in sleep that may occur with clinical conditions such as depression can be quantified. The VivoLogic software can also compute sleep latency and total sleep time. Other peripheral diagnostic devices with analog or digital output may be used as components of the LifeShirt system for special purposes. These include pulse oximetry (for measurement of arterial oxygen saturation, which can be low in people with apneas), ambulatory blood pressure, capnography (for measurement of expired CO2, a sensitive measure of hyperventilation),
electrodermal activity (a measure of sympathetic nervous system activity), skin temperature, core temperature (measured at the ear or under the arms), and leg accelerometry (to better quantify foot steps and differentiate the sitting from the supine posture).
3.5. VivoLog electronic diary
An important module of the LifeShirt System is the VivoLogwsoftware which captures
experiential (i.e. self-report) data from individuals. This data is input via the touch screen of the handheld computer and is recorded and displayed synchronized to the data stream of
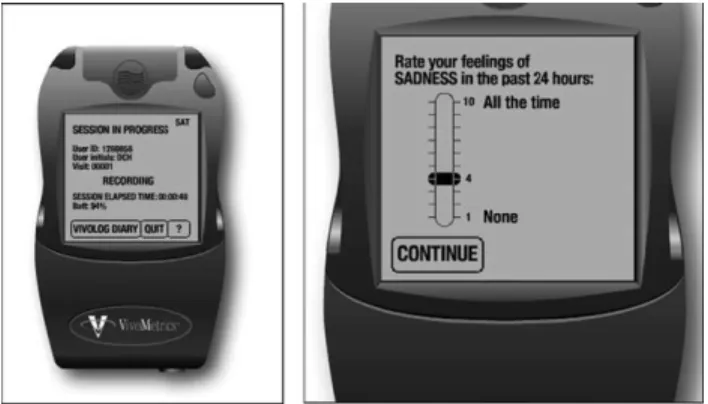
the physiologic signals. Specific self-report items regarding mood state, symptoms, cognitions, and types of activities (e.g. ‘I feel anxious’, ‘My heart is pounding’, ‘I think I cannot achieve the task in time’, and ‘I am at work’), instructions and reminders to perform certain tasks, and rating scales (Likert-type vs. visual analogue, with anchors) can be programmed for specific applications. Fig. 3 provides examples of displays of the VivoLog electronic diary.
3.6. VivoLogic physiologic data analysis and display
When the recording is finished, the data on the memory card can be transferred to a personal computer running under the Windows operating system. The VivoLogicw
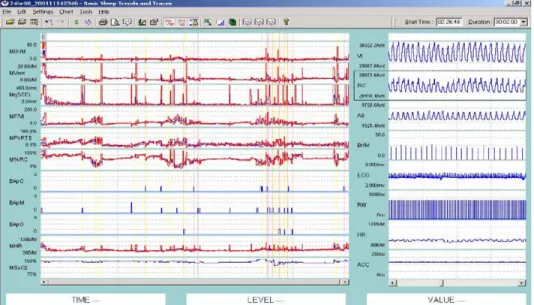
software allows reviewing the quality of raw waveforms and extracted parameters, editing of artifact segments that cannot be scored automatically, and marking of data segments of special interest. In practice, visual inspection of all raw waveforms is usually not attempted since this would be unrealistic with the large amounts of data being processed. Instead, 1-min trends of derived breath-by-breath or beat-by-beat parameters can be presented as medians with their quartile ranges. Such analysis minimizes the influence of outliers that might spuriously affect mean values. In addition, very large quartile ranges flag the 1-min trend data as likely artifactual. SeeFig. 4for an example display of raw waveforms and 1-min trends.
The VivoLogic software extracts a variety of calibrated respiratory pattern measures such as minute ventilation, tidal volume, breath-by-breath tidal volume variability, respiratory rate, fractional inspiratory ratio, and peak inspiratory flow.Table 1provides a detailed description of parameters that can be recorded with the LifeShirt and their significance. The VivoLogic software has embedded algorithms to accurately assess sleep disordered breathing (Coyle et al., 2003a,b). It can automatically detect and classify apneas and hypopneas (for example, into central, mixed or obstructive apneas), Cheyne-Stokes respiration, sighs, and coughs. In addition to respiratory measures, a variety of autonomic nervous system (ANS) function parameters are quantified. In brief, the ANS is
Fig. 3. VivoLog electronic diary: example displays. Left panel: general recording mode, with button for starting electronic diary entries; right panel: 1 (not at all) to 10 (all the time) rating scale for sadness during the day, used in a study with patients with major depressive disorder.
comprised of two branches, the sympathetic nervous system and parasympathetic nervous system which control largely unconscious, reflex, bodily adjustments such as in the size of the pupil, the rate and magnitude of cardiac and respiratory activity, the width of the blood vessels, the activity of sweat glands, and the digestive functions of the stomach and intestines.
A primary ANS measure of anxiety/stress activation is heart rate. This measure is a strong indicator of mental stress, when controlled for physical activity. For example, in one study comparing acutely anxious situational phobics with non-anxious controls, it had the largest effect size of 12 measures for discriminating groups and for indexing change from baseline in phobics (Wilhelm and Roth, 1998a).Fig. 5provides an example of heart rate changes during episodes of anxiety in a client with social phobia. His main concerns were severe anxiety and symptoms (primarily shortness of breath and heart racing) during scheduled monthly presentations during business meetings at his company. The anxiety episode was accompanied by clearly visible cardiac and respiratory alterations.
Heart rate is dually controlled by the sympathetic (increase) and parasympathetic (decrease) branch of the ANS that may act independently (Berntson et al., 1991; Grossman et al., 1990a). Thus, additional information can be retrieved from analyzing activity of the branches separately (Berntson et al., 1994; Wilhelm et al., 2001d). Sympathetic activation can be inferred from analysis of the pulse wave transit time to the finger (PTT) if the finger photoplethysmograph, integrated in the oximetry sensor, is used during recording. The PTT interval is measured from the R-wave of the ECG to the upstroke of the peripheral
Fig. 4. VivoLogic analysis software example display. Left traces are 1-min medians and quartile ranges of a selected subset of analyzed variables of significance during a night recording. Right traces represent raw waveforms of a selected 1-min segment of the data (Vt, calibrated tidal volume curve; RC, rib cage; AB, abdomen; Br/M, times of breath onsets; ECG, electrocardiogram; RW, times of R-waves; HR, heart rate, ACC, acceleromter).
Table 1
Parameters extracted from LifeShirt system recordings and their significance
Parameter Significance
Electronic diary items Programmable self-report measures of symptom experience, mood, cognitions, and activities; selections made on multiple-choice menus or Likert-type rating scales; less susceptible to response biases than paper-and-pencil diaries (Shiffman, 2000); allows synchronization with physiologic data in the VivoLogic software
Physical activity Measure of gross motor physical activity (Fahrenberg et al., 1997); provides context for interpretation of physiologic activation parameters
Posture Measure of upright vs. supine posture (Fahrenberg et al., 1997)
Heart rate (HR) Highly sensitive measure of anxiety and stress (Wilhelm and Roth, 1998a) Respiratory sinus
arrhythmia (RSA)
Putative non-invasive measure of cardiac parasympathetic influences. Measured as the peak-valley difference in R–R intervals associated with breathing (Grossman and Wientjes, 1986). Highly correlated with high-frequency heart rate variability spectral power (0.15–0.40 Hz), but less susceptible to misestimation during slow breathing (Grossman et al., 1991)
HF power High-frequency heart rate variability spectral power (0.15–0.40 Hz); reflects parasympathetic influences on the cardiovascular system
LF power Low frequency heart rate variability spectral power (0.04–0.15 Hz); reflects both sympathetic and parasympathetic influences on the cardiovascular system and is strongly associated with blood pressure regulation (Kamath et al., 1987) VLF power Very low frequency heart rate variability spectral power (0.0033–0.04 Hz); in
addition to sympathetic and parasympathetic inputs, may be influenced by the thermoregulatory, peripheral vasomotor, and renin–angiotensin systems (Kamath et al., 1987)
ULF power Ultra low frequency heart rate variability spectral power (1.15!10K5–0.0033 Hz); reflects circadian and other long-term variations in heart rate (Kamath et al., 1987)
LF/HF ratio Ratio of low- to high-frequency power; a disputed measure of sympathovagal balance (Kouakam et al., 1999)
Pulse wave transit time to the finger (PTT)
Putative non-invasive measure of general cardiovascular sympathetic influences; related to cardiac contractility, blood pressure, and arterial tone (Weiss et al., 1980)
Blood volume pulse (BVP) Measured as the difference between peak and valley of the peripheral pulse waveform. Reflects peripheral vasoconstriction, an a-adrenergic sympathetic measure (Miller and Ditto, 1991)
PO2 Clinical measure of arterial oxygen saturation. Normally O98%, but decreased during apnea and in certain cardiopulmonary disorders
PETCO2 Clinical measure of arterial carbon dioxide concentration. Decreased during mental stress and anxiety (Schleifer and Ley, 1994; Wilhelm et al., 2001a) Systolic/diastolic blood
pressure
Clinical measure of hypo- or hypertension. Reflects cardiovascular sympathetic influences
Respiratory rate (f) Highly sensitive but non-specific sign of emotional activation, respiratory function and dysfunction
Tidal volume (Vt) Highly sensitive but non-specific sign of emotional activation, respiratory function and dysfunction
Tidal volume variabilty Reflects anticipatory and acute anxiety (Wilhelm et al., 2001a). Quantified as the van Neuman statistic of breath-by-breath variation over 1-min periods. Elevated at baseline in panic disorder (Wilhelm et al., 2001f)
pulse. The relative importance of parasympathetic cardiovascular influences can be inferred from analysis of RSA. It is primarily measured using the peak-to-trough method (Grossman et al., 1990b): for each breathing cycle, the shortest R–R interval during inspiration is subtracted from the longest R–R interval during expiration. RSA reflects parasympathetic neural control of the heart. Breath-by-breath RSA values can be
Table 1 (continued)
Parameter Significance
Minute ventilation Proxy for oxygen consumption, which is directly related to total organismic metabolic activity. Increased with exercise, in anxiety/stress and pain (hyperventilation) (Wilhelm et al., 2001c) and certain respiratory disorders. Decreased (hypoventilation) with obstructed breathing, narcotic and sedative overdoses. Can be used to partial out the physical activity component from heart rate to retrieve the ‘additional heart rate’ that is due to emotional factors (Wilhelm and Roth, 1998c)
Peak inspiratory flow Reflects respiratory center drive and breathlessness (Milic-Emili, 1982). Similar to mean inspiratory flow, but less dependent on accurate estimation of the onset and end of inspiration
Ventilation/peak inspiratory flow
Measure of appropriateness of ventilation to respiratory drive. Helps distinguish organic from psychogenic breathlessness (Chadha et al., 1984)
Fractional inspiratory time ‘Duty cycle’ (Ti/Tt, ratio of inspiratory to total breath time). Low values may reflect severe airways obstruction since expiratory time is prolonged. Low values also occur in normal speech and can be used to detect speech behavior reflective of social engagement in ambulatory recordings (Wilhelm et al., 2003). Values increase during snoring
Sigh frequency Number of tidal volumes/min that are 2.5 times baseline volume. Increase in count reflects intensity of anxiety (Wilhelm and Roth, 1996). Elevated at baseline in panic disorder (Wilhelm et al., 2001e)
Respiratory rate/tidal volume ratio
‘Rapid shallow breathing index’ (f/Vt), reflects the work of breathing (Johannigman et al., 1997)
Peak/mean inspiratory and expiratory flow
Reflects presence of upper airway flow limitation during inspiration or expiration (Loube et al., 1999)
%RC/Vt Percent contribution of the rib cage excursions to tidal volume. Higher in women than men and during acute hyperventilation (Cohen et al., 1992). Increased variability with respiratory muscle fatigue or dysfunction
Phase relation Measure of thoracoabdominal coordination during breathing. Increased in severe airways obstruction. Increased during respiratory muscle fatigue or dysfunction Apnea and hypopnea
detection
Diagnostic components of sleep apnea/hypopnea syndrome and periodic breathing. Hypopnea defined as !50% baseline Vt for O10 s. Apnea defined as !25% baseline Vt for O10 s
Apnea and hypopnea classification
Phase relation between chest and abdomen classifies apnea/hypopnea events into central, mixed, and obstructive (1808) types
Magnitude of periodic Vt oscillations
Magnitude of oscillations of periodic breathing and Cheyne-Stokes respiration cycles associated with apnea or hypopnea (Waggener et al., 1984)
Cycle time of periodic Vt oscillations
Cycle length of periodic breathing and Cheyne-Stokes respiration. Longer cycle time points to a basis in chronic heart failure, shorter times to idiopathic central sleep apnea syndrome (Waggener et al., 1984)
Forced expiratory volume in 1 s (FEV1.0)
Requires a voluntary breathing maneuver. Reflects severity of airway obstruction, e.g. in asthma. Similar to % vital capacity expired in 1 s, which can also be measured
normalized by tidal volume and respiratory rate, both critical confounds in the estimation of within-individual changes in parasympathetic activity currently neglected in most research (e.g. Grossman et al., 1991; Grossman and Kollai, 1993; Hirsch and Bishop, 1981; Saul et al., 1989; Wilhelm et al., 2001a, 2004). In addition, supplementary spectral analytic measures can be computed.Table 1provides a description of these and other ANS parameters.
4. Conclusions
The LifeShirt is a sophisticated system for measuring a variety of respiratory and autonomic parameters related to emotional activation and disease. It is much improved compared to any previously available ambulatory respiratory monitoring systems in terms of accuracy, ease of use and comfort. In addition, it has the capability of recording a variety of parameters related to cardiac function and can obtain posture and motility information important as context parameters for unsupervised monitoring or as primary variables in themselves. All the sensors and electronics are state-of-the-art technology and are integrated within a shirt and a small handheld computer device. The system is a logical
Fig. 5. Annotated ambulatory recording of client with a diagnosis of social phobia before, during and after a 10-min business meeting presentation. A small subset of recorded and analyzed parameters is diplayed: M%RC, minute-by-minute median of rib cage contribution to tidal volume; vent, breath-by-breath continuous estimate of minute ventilation; HR, beat-by-beat continuous estimate of heart rate; AccM, motion component of accelerometry. Note that heart rate changes in anticipation and during the presentation are far out of proportion to the minimal ongoing physical activity and thus clearly emotion triggered.
extension of the ECG Holter monitor and may open a new era in ambulatory monitoring for both scientific research and clinical practice.
Research on the emotion–respiration relationships has been largely restricted to respiration rate and tidal volume. Finer distinctions, such as peak inspiratory flow (a measure of respiratory drive and breathlessness) (Milic-Emili, 1982), tidal volume variability (Wilhelm et al., 2001b,e,f), or breathing suspension (Stein et al., 1995; Wilhelm and Roth, 1998a) can add additional information to the assessment of the quality and intensity of emotion and affective disorders. An unprecedented range of these and other respiratory parameters can be assessed with the LifeShirt technology. It can be used for ambulatory monitoring of physiologic parameters and motility during wake, sleep, and activity states. In addition, reports of mood, cognitions, symptoms, and types of activity can be gathered easily and reliably, overcoming the limitations of retrospective reports or paper-and-pencil diaries (Shiffman, 2000). In other words, all three emotional response systems—language, physiology, and motor behavior—are recorded. Intervals when patients reported specific symptoms can receive special attention in the inspection of physiologic parameters.
The system is user-friendly enough to be applied in clinical practice and in healthy individuals for obtaining information about their psychophysiological state, for example, during mental or sports performance or during human–computer interaction. One apparent area for application of this new technology is the monitoring of breathing patterns and cardiovascular responses over extended periods in individuals who experience anxiety and stress. Many unresolved issues leave our current understanding of emotions in daily life incomplete. The comprehensive cardiovascular, respiratory, motor behavior, and subjective experience assessment achievable with the LifeShirt system should help advance this understanding. The LifeShirt system has the potential of becoming an important tool for advancing health care, together with a vast array of other technologies (Maheu et al., 2005).
5. Future work
Biosignal analysis algorithms under development include classification of locomotor activity (Keenan and Wilhelm, 2005b), advanced adaptive and wavelet filters for eliminating movement artifact from the respiratory IP signals (Keenan and Wilhelm, 2005a), and detection of speaking periods from respiratory patterns (Wilhelm et al., 2003). Implementation of a method for quantifying emotional activation by identifying periods when heart rate increases out of proportion to ongoing physical activity and metabolic requirements (‘additional or emotional heart rate’) (Wilhelm and Roth, 1998c) is currently underway. Complex demodulation is being implemented as a method that can provide time-dependent changes in heart rate variability amplitude and frequency on a continuous basis and may yield insights into short-term alterations in autonomic regulation during acute changes in emotion activation (Wilhelm et al., 2005).
A significant next step in the development of the LifeShirt, currently in a pilot stage, is real-time physiologic signal analysis and wireless transfer of reduced data to a receiving unit. Parameters that are analyzed online from the raw signals include heart rate,
respiratory rate, temperature, motility, and posture. Limitations in the transmission rate or quality can make it advantageous to analyze raw waveforms within the telemetry device and only transmit the reduced parameters at a much lower sample rate less vulnerable to distortion. For removing movement artifacts, computationally economical algorithms with low latency are being developed, for example, running median filters and parameter thresholds continuously adjusting to the physical activity level sensed by accelerometry. This technological advance may make feasible the accurate reliable remote monitoring of core vital signs over extended periods, even when wireless transmission is hampered. Potential applications of this technology are healthcare and high-risk work environments such as those faced by fire fighters or paramedics. Live streaming of data over the Internet may be utilized for monitoring at any distance and for providing a real-time interface for the health and affective information obtained with the LifeShirt for surveillance of emergency dispatch teams, biofeedback training and more generally for optimizing human–computer interaction.
A long-term developmental goal is identification of specific emotion signatures in real life using the vast sensor array of the LifeShirt and advanced pattern recognition algorithms offline and possibly online. A pioneering laboratory-based study by Picard and colleagues (Picard et al., 2001) indicates that identification of affective states from a few physiological signals, at least when calibrated for each individual, is within our reach.
Acknowledgements
This work was supported by the Swiss National Science Foundation (grant 105311-105850) and the 6th Framework Project Euclock (No. 018741).
References
Alpers, G.W., Wilhelm, F.H., Roth, W.T., in press. Psychophysiological measures during exposure in driving phobic patients. Journal of Abnormal Psychology.
Berntson, G.G., Cacioppo, J.T., Quigley, K.S., 1991. Autonomic determinism: the modes of autonomic control, the doctrine of autonomic space, and the laws of autonomic constraint. Psychological Review 98, 459–487. Berntson, G.G., Cacioppo, J.T., Binkley, P.F., Uchino, B.N., Quigley, K.S., Fieldstone, A., 1994. Autonomic cardiac control. III. Psychological stress and cardiac response in autonomic space as revealed by pharmacological blockades. Psychophysiology 31 (6), 599–608.
Bloch, K., Jugoon, S., Sackner, M., 1999. Inductance cardiography (thoracocardiography): a novel, noninvasive technique for monitoring left ventricular filling. Journal of Critical Care 14 (4), 177–185.
Boiten, F., Frijda, N., Wientjes, C., 1994. Emotions and respiratory patterns: review and critical analysis. International Journal of Psychophysiology 17 (2), 103–128.
Chadha, T., Watson, H., Birch, S., Jenouri, G., Schneider, A., Cohn, M., et al., 1982. Validation of respiratory inductive plethysmography using different calibration procedures. American Review of Respiratory Disease 125 (6), 644–649.
Chadha, T.S., Schneider, A.W., Birch, S., Jenouri, G., Sackner, M.A., 1984. Breathing pattern during induced bronchoconstriction. Journal of Applied Physiology: Respiratory, Environmental & Exercise Physiology 56 (4), 1053–1059.
Cohen, C.A., Zagelbaum, G., Gross, D., Roussos, C., Macklem, P.T., 1992. Clinical manifestations of inspiratory muscle fatigue. American Journal of Medicine 73 (3), 308–316.
Coyle, M.A., Carter, G., Horsager, A.M., Mendelson, W.B., 2003a. Validation of an autoscoring algorithm to detect obstructive sleep apnea. Sleep 26, A395.
Coyle, M.A., Carter, G., Mendelson, W.B., 2003b. Validation of an ambulatory non-invasive cardio-respiratory monitoring system to detect obstructive sleep apnea. American Journal of Respiratory and Critical Care Medicine 167 (7), A404.
Fahrenberg, J., Foerster, F., Smeja, M., Muller, W., 1997. Assessment of posture and motion by multichannel piezoresistive accelerometer recordings. Psychophysiology 34 (5), 607–612.
Gonzalez, H., Haller, B., Watson, H.L., Sackner, M.A., 1984. Accuracy of respiratory inductive plethysmograph over wide range of rib cage and abdominal compartmental contributions to tidal volume in normal subjects and in patients with chronic obstructive pulmonary disease. American Review of Respiratory Disease 130 (2), 171–174.
Grossman, P., 1983. Respiration, stress, and cardiovascular function. Psychophysiology 20 (3), 284–300. Grossman, P., Kollai, M., 1993. Respiratory sinus arrhythmia, cardiac vagal tone, and respiration: within- and
between-individual relations. Psychophysiology 30 (5), 486–495.
Grossman, P., Wientjes, K., 1986. Respiratory sinus arrhythmia and parasympathetic cardiac control: some basic issues concerning quantification, applications and implications. In: Grossman, P., Janssen, K.H.L., Vaitl, D. (Eds.), Cardiorespiratory and Cardiosomatic Psychophysiology. Plenum Press, New York, pp. 117–138. Grossman, P., Wientjes, C.J., 2001. How breathing adjusts to mental and physical demands. In: Haruki, Y.,
Homma, I., Umezawa, A., Masaoka, Y. (Eds.), Respiration and Emotion. Springer, New York, pp. 43–55. Grossman, P., Stemmler, G., Meinhardt, E., 1990a. Paced respiratory sinus arrhythmia as an index of cardiac
parasympathetic tone during varying behavioral tasks. Psychophysiology 27 (4), 404–416.
Grossman, P., van Beek, J., Wientjes, C., 1990b. A comparison of three quantification methods for estimation of respiratory sinus arrhythmia. Psychophysiology 27 (6), 702–714.
Grossman, P., Karemaker, J.K., Wieling, W., 1991. Prediction of tonic parasympathetic cardiac control using respiratory sinus arrhythmia: The need for respiratory control. Psychophysiology 28, 201–216.
Grossman, P., Wilhelm, F.H., Spoerle, M., 2004. Respiratory sinus arrhythmia, cardiac vagal control and daily activity. American Journal of Physiology 287 (2), H728–H734.
Hill, S., Blackburn, J., Williams, T., 1982. The Measurement of Respiratory Flow by Inductance Pneumography. Academic Press, London.
Hirsch, J.A., Bishop, B., 1981. Respiratory sinus arrhythmia in humans: How breathing pattern modulates heart rate. American Journal of Physiology 241, H620–H629.
Johannigman, J.A., Davis, K., Campbell, R.S., Branson, R.D., Luchette, F.A., Hurst, J.M., 1997. Use of the rapid/shallow breathing index as an indicator of patient work of breathing during pressure support ventilation. Surgery 122 (4), 737–740.
Kamath, M., Ghista, D., Fallen, E., Fitchett, D., Miller, D., McKelvie, R., 1987. Heart rate variability power spectrogram as a potential noninvasive signature of cardiac regulatory system response, mechanisms, and disorders. Heart Vessels 3 (1), 33–41.
Keenan, D.B., Wilhelm, F.H., 2005a. Adaptive and wavelet filtering methods for improving accuracy of respiratory measurement. Biomedical Sciences Instrumentation 41, 37–42.
Keenan, D.B., Wilhelm, F.H., 2005b. Classification of locomotor activity by acceleration measurement: validation in Parkinson disease. Biomedical Sciences Instrumentation 41, 329–334.
Kouakam, C., Lacroix, D., Zghal, N., Logier, R., Klug, D., Le Franc, P., et al., 1999. Inadequate sympathovagal balance in response to orthostatism in patients with unexplained syncope and a positive head up tilt test. Heart 82 (3), 312–318.
Lang, P.J., 1978. Anxiety: toward a psychophysiological definition. In: Akiskal, H.S., Webb, W.L. (Eds.), Psychiatric Diagnosis: Exploration of Biological Criteria. Spectrum, New York, pp. 265–389.
Lang, P.J., 1995. The emotion probe: studies of motivation and attention. American Psychologist 50, 372–385. Loube, D.I., Andrada, T., Howard, R.S., 1999. Accuracy of respiratory inductive plethysmography for the
diagnosis of upper airway resistance syndrome. Chest 115 (5), 1333–1337.
Maheu, M.M., Pulier, M.L., Wilhelm, F.H., McMenamin, J.P., Brown-Connolly, N.E., 2005. The Mental Health Professional and the New Technologies. Lawrence Erlbaum, Mahwah, NJ.
Miller, S., Ditto, B., 1991. Exaggerated sympathetic nervous system response to extended psychological stress in offspring of hypertensives. Psychophysiology 28 (1), 103–113.
Myrtek, M., 1984. Constitutional Psychophysiology. Academic Press, Orlando, FL. Picard, R.W., 1997. Affective Computing. MIT press, Cambridge, MA.
Picard, R.W., Vyzas, E., Healey, J., 2001. Toward machine emotional intelligence: analysis of affective physiological state. IEEE Transactions on Pattern Analysis and Machine Intelligence 23 (10), 1175–1191. Quigley, K., Barrett, L., Weinstein, S., 2002. Cardiovascular patterns associated with threat and challenge
appraisals: a within-subjects analysis. Psychophysiology 39 (3), 292–302.
Ritz, T., Thons, M., 2002. Airway response of healthy individuals to affective picture series. International Journal of Psychophysiology 46 (1), 67–75.
Sackner, J., Nixon, A., Davis, B., Atkins, N., Sackner, M., 1980. Non-invasive measurement of ventilation during exercise using a respiratory inductive plethysmograph. I. American Review of Respiratory Disease 122 (6), 867–871.
Sackner, M., Watson, H., Belsito, A., Feinerman, D., Suarez, M., Gonzalez, G., et al., 1989. Calibration of respiratory inductive plethysmograph during natural breathing. Journal of Applied Physiology 66 (1), 410– 420.
Sackner, M., Hoffman, R., Stroh, D., Krieger, B., 1991. Thoracocardiography. Part 1. Noninvasive measurement of changes in stroke volume comparisons to thermodilution. Chest 99 (3), 613–622.
Saul, J.P., Berger, R.D., Chen, M.H., Cohen, R.J., 1989. Transfer function analysis of autonomic regulation. II. Respiratory sinus arrhythmia. American Journal of Physiology 256 (1 Pt 2), H153–H161.
Schleifer, L., Ley, R., 1994. End-tidal pCO2 as an index of psychophysiological activity during VDT data-entry work and relaxation. Ergonomics 37 (2), 245–254.
Shiffman, S., 2000. Real-time self-report of momentary states in the natural environment: computerized ecological momentary assessment. In: Stone, A.A., Turkkan, J.S. et al. (Eds.), The Science of Self-report: Implications for Research and Practice. Lawrence Erlbaum, Publishers, Mahwah, NJ, pp. 277–296. Stein, M.B., Millar, T.W., Larsen, D.K., Kryger, M.H., 1995. Irregular breathing patterns during sleep in patients
with panic disorder. American Journal of Psychiatry 152, 1168–1173.
Sterling, P., Eyer, J., 1988. Allostasis: a new paradigm to explain arousal pathology. In: Fisher, S., Reason, J. (Eds.), Handbook of Life Stress, Cognition and Health. Wiley, New York, pp. 629–649.
Teicher, M., 1995. Actigraphy and motion analysis: new tools for psychiatry. Harvard Review of Psychiatry 3 (1), 18–35.
Tobin, M.J., Chadha, T.S., Jenouri, G., Birch, J.S., Gazeroglu, H.B., Sackner, M.A., 1983. Breathing patterns. 1. Normal subjects. Chest 84 (2), 202–205.
Tomaka, J., Blascovich, J., Kibler, J., Ernst, J., 1997. Cognitive and physiological antecedents of threat and challenge appraisal. Journal of Personality and Social Psychology 73 (1), 63–72.
Van Diest, I., Winters, W., Devriese, S., Vercamst, E., Han, J., Van de Woestijne, K., et al., 2001. Hyperventilation beyond fight/flight: respiratory responses during emotional imagery. Psychophysiology 38 (6), 961–968.
Waggener, T.B., Brusil, P.J., Kronauer, R.E., Gabel, R.A., Inbar, G.F., 1984. Strength and cycle time of high-altitude ventilatory patterns in unacclimatized humans. Journal of Applied Physiology: Respiratory, Environmental & Exercise Physiology 56 (3), 576–581.
Weiss, T., Del Bo, A., Reichek, N., Engelman, K., 1980. Pulse transit time in the analysis of autonomic nervous system effects on the cardiovascular system. Psychophysiology 17 (2), 202–207.
Wientjes, C., 1992. Respiration in psychophysiology: methods and applications. Biological Psychology 34 (2–3), 179–203.
Wilhelm, F.H., Roth, W.T., 1993. Exam 2.0: a program to visualize, edit and analyze large vectors of data, with application to biomedical engineering. Paper Presented at the First Matlab Conference, Boston, USA. Wilhelm, F.H., Roth, W.T., 1996. Ambulatory assessment of clinical anxiety. In: Fahrenberg, J., Myrtek, M.
(Eds.), Ambulatory Assessment: Computer-Assisted Psychological and Psychophysiological Methods in Monitoring and Field Studies. Hogrefe & Huber Publishers, Gottingen, Germany, pp. 317–345.
Wilhelm, F.H., Roth, W.T., 1997. Acute and delayed effects of alprazolam on flight phobics during exposure. Behaviour Research and Therapy 35 (9), 831–841.
Wilhelm, F.H., Roth, W.T., 1998a. Taking the laboratory to the skies: ambulatory assessment of self- report, autonomic, and respiratory responses in flying phobia. Psychophysiology 35 (5), 596–606.
Wilhelm, F.H., Roth, W.T., 1998b. Trusting computerized data reduction too much: a critique of Anderson’s ambulatory respiratory monitor. Biological Psychology 49 (1–2), 215–219 (discussion 221–212). Wilhelm, F.H., Roth, W.T., 1998c. Using minute ventilation for ambulatory estimation of additional heart rate.
Biological Psychology 49 (1–2), 137–150.
Wilhelm, F.H., Roth, W.T., 2001. The somatic symptom paradox in DSM-IV anxiety disorders: suggestions for a clinical focus in psychophysiology. Biological Psychology 57 (1–3), 105–140.
Wilhelm, F.H., Grossman, P., Roth, W.T., 1999. Analysis of cardiovascular regulation. Biomedical Sciences Instrumentation 35, 135–140.
Wilhelm, F.H., Alpers, G.W., Meuret, A.E., Roth, W.T., 2001a. Respiratory pathophysiology of clinical anxiety outside the laboratory: assessment of end-tidal pCO2, respiratory pattern variability, and transfer function RSA. In: Fahrenberg, J. (Ed.), Progress in Ambulatory Assessment. Hogrefe & Huber, Go¨ttingen, pp. 313– 343.
Wilhelm, F.H., Gerlach, A.L., Roth, W.T., 2001b. Slow recovery from voluntary hyperventilation in panic disorder. Psychosomatic Medicine 63, 638–649.
Wilhelm, F.H., Gevirtz, R., Roth, W.T., 2001c. Respiratory dysregulation in anxiety, functional cardiac, and pain disorders: assessment, phenomenology, and treatment. Behavior Modification, 513–545.
Wilhelm, F.H., Kochar, A.S., Roth, W.T., Gross, J.J., 2001d. Social anxiety and response to touch: incongruence between self-evaluative and physiological reactions. Biological Psychology 58, 181–202.
Wilhelm, F.H., Trabert, W., Roth, W.T., 2001e. Characteristics of sighing in panic disorder. Biological Psychiatry 49 (7), 606–614.
Wilhelm, F.H., Trabert, W., Roth, W.T., 2001f. Physiological instability in panic disorder and generalized anxiety disorder. Biological Psychiatry 49 (7), 596–605.
Wilhelm, F.H., Handke, E.M., Roth, W.T., 2003. Detection of speaking with a new respiratory inductive plethysmography system. Biomedical Sciences Instrumentation 39, 136–141.
Wilhelm, F.H., Grossman, P., Coyle, M.A., 2004. Improving estimation of cardiac vagal tone during spontaneous breathing using a paced breathing calibration. Biomedical Sciences Instrumentation 40, 317–324. Wilhelm, F.H., Grossman, P., Roth, W.T., 2005. Assessment of heart rate variability during alterations in stress: