HEAD AND NECK RADIOLOGY
Diffusion tensor imaging (DTI) and tractography of the brachial
plexus: feasibility and initial experience in neoplastic conditions
Maria Isabel Vargas&Magalie Viallon&Duy Nguyen&
Jacqueline Delavelle&Minerva Becker
Received: 23 August 2009 / Accepted: 26 November 2009 / Published online: 7 January 2010 # Springer-Verlag 2009
Abstract
Introduction The objective of this study was to assess the feasibility and potential clinical applications of diffusion tensor imaging (DTI) and tractography in the normal and pathologic brachial plexus prospectively.
Methods Six asymptomatic volunteers and 12 patients with symptoms related to the brachial plexus underwent DTI on a 1.5T system in addition to the routine anatomic plexus imaging protocol. Maps of the apparent diffusion coeffi-cient (ADC) and of fractional anisotropy (FA), as well as tractography of the brachial plexus were obtained. Images were evaluated by two experienced neuroradiologists in a prospective fashion. Three patients underwent surgery, and nine patients underwent conservative medical treatment. Results Reconstructed DTI (17/18) were of good quality (one case could not be reconstructed due to artifacts). In all volunteers and in 11 patients, the roots and the trunks were clearly delineated with tractography. Mean FA and mean ADC values were as follows: 0.30±0.079 and 1.70 ± 0.35 mm2/s in normal fibers, 0.22 ± 0.04 and 1.49 ±
0.49 mm2/s in benign neurogenic tumors, and 0.24±0.08 and 1.51±0.52 mm2/s in malignant tumors, respectively. Although there was no statistically significant difference in FA and ADC values of normal fibers and fibers at the level of pathology, tractography revealed major differences regard-ing fiber architecture. In benign neurogenic tumors (n=4), tractography revealed fiber displacement alone (n=2) or fiber displacement and encasement by the tumor (n=2), whereas in the malignant tumors, either fiber disruption/destruction with complete disorganization (n=6) or fiber displacement (n=1) were seen. In patients with fiber displacement alone, surgery confirmed the tractography findings, and excision was successful without sequelae.
Conclusion Our preliminary data suggest that DTI with tractography is feasible in a clinical routine setting. DTI may demonstrate normal tracts, tract displacement, defor-mation, infiltration, disruption, and disorganization of fibers due to tumors located within or along the brachial plexus, therefore, yielding additional information to the current standard anatomic imaging protocols.
Keywords Brachial plexus . Peripheral nerves . MRI–DTI tractography . Neurogenic tumors . Neoplastic lesions
Introduction
Diffusion tensor imaging (DTI) and tractography (3D fiber tracking) are new noninvasive techniques to study in vivo the neuronal tract structure and orientation of axons allowing quantitation of tissue characteristics. DTI is based on a tensor model to characterize diffusion anisotropy and related parameters, the mathematical representation of water diffusion also providing data for tractography based
M. I. Vargas (*)
:
D. Nguyen:
J. Delavelle Department of Neuroradiology, DISIM, Geneva University Hospital,4 Rue Gabrielle-Perret-Gentil, 1211 Genève 14, Switzerland e-mail: [email protected] M. Viallon
Radiology, Geneva University Hospital and University of Geneva, Geneva, Switzerland
M. Becker
Unit of Head and Neck Radiology,
Geneva University Hospital and University of Geneva, Geneva, Switzerland
on anisotropy [1–5]. The first application of tractography was in the brain [4,6–8] followed by the spinal cord [3,9– 11] and some peripheral nerves such as the sciatic, median, radial, and ulnar nerves [12–14]. As suggested by several authors, DTI with fiber tracking may provide clinically relevant information and may depict abnormalities beyond the resolution of conventional anatomic MR techniques [2, 12, 14]. Mean fractional anisotropy (FA) and apparent diffusion coefficient (ADC) map values which reflect micro-structural changes have been reported to be abnormal in areas that may appear normal on anatomic MR images [3,15].
Although tractography in the brain can be obtained routinely in most patients, DTI with tractography recon-structions of plexus brachialis fibers is technically chal-lenging. The difficulties to obtain reproducible fiber tracking of the brachial plexus are related to the small size of the nerve fibers, the orientation, and the particular localization of the brachial plexus situated between the neck and the shoulder with a surface to cover that is not uniform resulting in important geometric distortion and artifacts. Recently, Takahara et al. [16] have demonstrated the feasibility of diffusion-weighted (DW) neurography of the brachial plexus in five volunteers and in five patients using a whole-body DW technique with background body signal suppression, and Tsuchiya et al. [17] have obtained neurographic images of the nerve roots and proximal portions of the contiguous peripheral nerves using a single-shot echo-planar short-term inversion recovery (STIR)-based sequence in three volunteers and eight patients. However, in both publications, neither FA nor ADC values for normal and pathologic fibers were provided nor was fiber tracking done.
Our group has recently reported the feasibility of high-resolution MRI of the brachial plexus using an isotropic 3D STIR sequence as a reliable alternative to 2D STIR imaging [18]. We have shown that this morphologic sequence allows improved detection of the site of nerve compression in neoplastic lesions by enabling curved thin MPR reconstruc-tions along the individual nerve fibers. The sequence may also be used as a mask for DTI reconstruction [18].
The purpose of the present study was to analyze the diffusion tensor-based information from DTI with fiber
tracking to provide mean FA and mean ADC values on tractography images of normal volunteers and of patients with brachial plexopathy caused by neoplasms and to assess potential differences between normal volunteers and patients in a routine clinical setting. We also addressed the question whether tractography reconstrunctions may allow more precise differentiation of neurogenic masses and whether alteration of fiber tracts caused by primary or secondary tumors may be reliably displayed with this new technique.
Materials and methods
Study population
Our study had received prior approval from the Institutional Review Board, and informed consent was obtained for all volunteers but was waived for the patient group which underwent routine MR imaging for medical reasons. Six asymptomatic volunteers (four males and two females, median age 41 years; age range 32–57 years, Table 1) and 12 patients (eight males and four females, median age 54 years; age range, 28–80 years) without a history of previous trauma and with symptoms related to the brachial plexus (dysesthesia, n=2; paresthesia, n=2; hypoesthesia, n=1, motor deficit, n=3; Claude–Bernard–Horner syn-drome, n=2, large palpable mass along the supraclavicular region but otherwise asymptomatic, n=2) were included in this prospective study. Individual patient characteristics, clinical symptoms, and tumor types are summarized in Table2. Although the 3D T2 STIR data of patients nr. 1, 2, 5, and 9 have been reported in a previous paper [18], we included these patients in the current study as the DTI tractography data have so far neither been analyzed nor reported.
Acquisition protocol
MRI was performed on a 1.5T scanner (Avanto, Siemens Medical Systems, Erlangen, Germany). Volunteers and patients were scanned in the supine position combining
Table 1 Mean values were calculated from six asymptomatic volunteers.
Roots Mean right FA Mean left FA Mean left + right FA
Mean right ADC (mm2/s)
Mean left ADC (mm2/s) Mean left + right ADC C5 0.288 0.294 0.280 1,773 1,607 1,622 C6 0.314 0.296 0.289 1,775 1,681 1,649 C7 0.287 0.324 0.294 1,674 1,632 1,587 C8 0.349 0.265 0.288 1,689 1,794 1,672
three elements of the neck array coil, six elements of the head array coils, and three elements of the spine array coils to cover the field of view (FOV) with 12 coil elements. The images were performed during quiet respiration, and the patients were asked to refrain from coughing and vigorous swallowing during image acquisition. Prior to DTI, ana-tomic plexus imaging was performed in all cases beginning with a sagittal and a coronal localizer, followed by axial and sagittal FSE T2-weighted images (TR =3,411 ms, TE= 110 ms, slice thickness 3 mm), coronal SE T1-weighted images (TR=491 ms, TE=11 ms, slice thickness =3 mm), and a 3D T2 short-tau inversion recovery sampling perfection with application-optimized contrasts using dif-ferent flip angle evolutions (STIR SPACE) sequence as recently described in the literature [18] with the following parameters: TE = 149 ms, TR = 2,000 ms, TI = 160 ms, turbofactor=73, TA=6–7 min, FOV=256, matrix size= 256×260, number of slices≥96, TI=160 ms, iPAT factor= 3, and an isotropic voxel size of 0.9 to 1 mm3. In addition, fat-saturated SE T1-weighted images in the coronal and
axial planes (TR=612 ms, TE=11 ms, slice thickness= 3 mm) were obtained after i.v. injection of Gadolinium chelates (0.1 mmol/kg of body weight) after the DTI acquisition. The field of view was 200×200 mm for all axial sequences and 280×280 mm for all coronal sequences; the matrix was 384×384 for the FSE T2 and 320×320 for the SE T1-weighted sequences.
The diffusion tensor axial images were acquired with a single-shot spin echo diffusion-weighted echo planar imaging (EPI) sequence using the following main MR parameters: TE=78 ms, TR=9,000 ms, parallel acquisitions (iPAT=2, grappa reconstruction), Nex =1; FOV 256, Matrix 128×128, slice thickness=2 mm resulting in a voxel size of 2×2×2 mm, b values=0 and 900 s/mm2, and 30 gradient directions. Diffusion weighting was implemented using a Stejskal–Tanner diffusion scheme (monopolar gradient) in order to achieve shorter TE, better signal/noise ratio (SNR), and reduced acquisition time. The DTI sequence duration was 5 min and 44 s. The DTI sequence was positioned according to the level of the pathology as identified on the
Table 2 Individual patient characteristics, clinical symptoms, and tumor types. Age
(years)
Sex Symptoms Pathologya DTI findings Mean
FA Mean ADC (mm2/s) 1 28 M Paresthesias C8-Th1 (left)
Multiple schwannomas (both sides) Fibers passing around the multiple masses
0.255 1.597 2 42 F Dysesthesia Left C5 schwannoma Fibers spreading out
around the tumor
0.167 1.567 3 43 F Bulge over
the scalene muscles
Plexiform neurofibroma (both sides) Fibers well seen within the masses
0.311 0.210
4 42 M Paresthesias Left neurogenic benign tumor Fibers around and inside the mass
0.232 1.555 5 80 M Hypoesthesia Metastases from esophageal
adenocarcinoma (C1 and first left rib)
Infiltration of fibers, disruption/destruction
0.200 2.173
6 65 M CBHb Right lung adenocarcinoma disruption/destruction/ disorganization
0.198 1.534 7 50 M Dysesthesia Left lung adenocarcinoma disruption/destruction/
disorganization
0.272 2.036 8 64 F CBHb Right metastasis from hepatocellular
carcinoma of the liver
disruption/destruction/ disorganization
0.267 1.297 9 58 M Motor deficit
right arm
Right non-Hodgkin lymphoma DTI could not be reconstructed
0.306 1.356 10 60 M Motor deficit
right arm
Right PNET disruption/destruction/ disorganization
0.282 1.487 11 62 F Motor deficit
C5-C8
Left and right metastases from breast carcinoma
destruction/ disorganization 0.240 1.817 12 56 H Palpable
supraclavicular mass
Right level 3 and 4 lymph node
metastases of a squamous cell carcinoma of the hypopharynx
displacement of fibers C5 - C7
0.242 1.435
aPathology based on surgical specimen or image guided biopsy in all patients with the exception of patient 2 with known neurofibromatosis
type-1 and plexiform neurofibroma. In patient nr 4, biopsy showed a benign neurogenic lesion, but differentiation between schwannoma and neurofibroma was not possible due to the limited histologic material available. Follow-up over a period of 2 years in this patient did not show any evolution of the benign neurogenic tumor
3D STIR sequence; however, for all patients, it included at least the area from C5 to C8.
Data processing and analysis
FA, ADC maps, and tensor calculation were performed inline by the MRI scanner. Color coding displaying the direction of the main eigenvector was chosen according to the standard-ized color code used in brain studies: blue indicating the pure cranio-caudal direction, red the pure left–right direction, green the pure antero-posterior direction, and intermediate colors indicating corresponding double oblique directions. The DTI datasets were post-processed using commercially available software (Neuro 3D task cards Siemens Medical Systems, Erlangen, Germany). Fiber tracks of the brachial plexus were calculated using a fourth order Runge–Kutta algorithm from several seed points placed at different levels on the spinal cord in the trunks and cords of the brachial plexus in the pathologic side. The post-processing procedure took around 60 min/ subject. The used FA thresholds were set depending on the lowest value found in each plexus (0.15±0.05), the angle thresholds were 30°, and the step length set to 0.9 mm.
Fiber tracking reconstruction were performed by one board-certified neuroradiologist and analyzed in consensus by two board-certified neuroradiologists with 13 and 30 years of experience, respectively. Quantitative measurement of FA and ADC values were obtained by positioning user-defined regions of interest (ROI) on the axial parameter maps at the level of the proximal roots from C5 to C8 in all volunteers on the right side and on the left side separately and at level of the symptomatic lesion. The size of the ROIs was constant (0.2 cm2), and special attention was paid to position the ROIs as precisely as possible on the respective fibers so as to minimize partial volume effects. Measurements were per-formed twice to evaluate intra-observer reliability.
Evaluation of DTI images included: identification of fibers at the level of individual roots, trunks, and cords; assessment of fiber position with respect to the tumor mass; evaluation of fiber displacement; and identification of fiber destruction/ disruption or disorganization. Destruction/disruption was defined as abrupt loss of continuity of fibers seen on tractography images, whereas disorganization was defined as an abnormal anatomic array of fibers spreading out in different directions.
Statistical evaluation
Statistical comparison of repeated measurements was done using a t test and intra-observer variability of FA, and ADC values was also assessed by calculating the intraclass correlation coefficient (ICC) taking into account two way random effects (observer effect and measurement effect). In addition, a t test was also used to compare the difference
between FA and ADC values found in normal volunteers and in patients with benign versus malignant tumors. The statistical analysis was performed using commercially available software (Stata v10, College Station, Texas, USA) by an experienced PhD.
Results
Volunteers
DTI reconstruction with tractography was feasible in all six volunteers. An example of a normal brachial plexus tractography is provided in Fig. 1. In all volunteers, the roots and the trunks were identified on the DTI sequence bilaterally from C5 to T1. FA and ADC measurements were
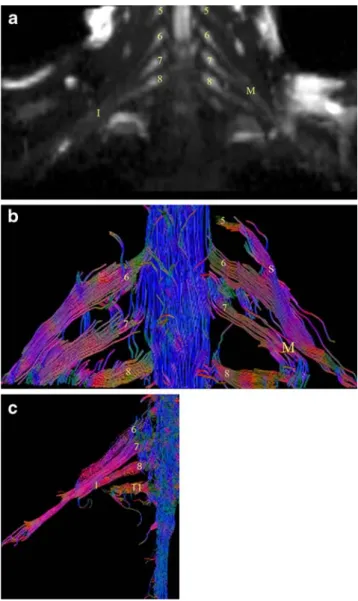
Fig. 1 a Normal neurography (b =1,000) and b tractography of the brachial plexus in a 37-year-old male volunteer. Roots from C5 to C8 (5, 6, 7, 8) and superior (S), middle (M) trunks and c inferior (I) trunk of the brachial plexus
performed on right and left side at each individual level from C5 to C8. The mean global FA and ADC values (all levels and all sides together) were 0, 30±0.079, and 1.70± 0.35 mm2/s, respectively.
Measurements performed for each root from C5 to C8 indicated no statistically significant difference in FA or ADC mean values between individual root levels (p>0.2): FA/ADC=0.28±0.06/1.62±0.32 at C5; FA/ADC=0.28± 0.09/1.64±0.38 at C6; FA/ADC =0.29±0.06/1.58±0.37 at C7, FA/ADC =0.28±0.09/1.67±0.27 at C8
On the right side, the mean values of FA and ADC measurements were 0.29 ±0.08 and 1.78 ± 0.38 mm2/s, respectively, and on the left side 0.29±0.05 and 1.70± 0.36 mm2/s, respectively.
Although the t test showed that neither a significant difference between right/left FA (p=0.87) and right/left ADC (p=0.37) nor between measurements of both FA (p= 0.22) and ADC (p=0.13) was found, the ICC coefficient indicated a poor level of concordance between intra-observer measurements regarding FA and ADC (right FA (icc=0.259, f=1.7), left FA (0.399, f=2.33), right ADC (0.51, f=3.08), and left ADC (0.352, f=2.085)).
Patients
In one patient, DTI could not be reconstructed due to important image distortion and motion artifacts (patient nr. 9, Table 2), although we were able to measure the FA and the corresponding ADC values. The reconstructed tractographies in the remaining 11 individuals were all of good quality, as assessed by the two reviewers. The fibers and trunks were visualized in all patients, and the cords were visualized in six patients. Results of DTI findings and FA and ADC measurements of the studied patient group are summarized in Table2.
In the patient population, the mean FA value measured at the level of pathology was 0.24±0.04 and the mean ADC value was 1.60±0.37 mm2/s.
Mean measurements of FA and ADC values in benign tumors were 0.22±0.04 and 1.49±0.49 mm2/s, respectively. Mean FA and ADC measurements in malignant tumors were 0.24±0.08 and 1.51±0.52 mm2/s, respectively. We found no significant differences in FA (p=0.5) and ADC (p=0.3) values between benign and malignant tumors (Table2).
The tractography images obtained in patients with benign neurogenic tumors (n=4) clearly demonstrated the fibers passing around the tumor (displacement, n=2, Fig.2) or the fibers passing inside the tumor without destruction or disruption of fibers (n=2, Figs. 3 and 4). In the six malignant tumors where tractography images could be reconstructed, we noted destruction/disruption and disorga-nization of the fibers, trunks, or cords (n=6, Fig. 5) or displacement of the fibers (n=1).
Patients nr. 1 and 2 with benign neurogenic tumors underwent surgery, which confirmed the tractography findings. The symptomatic lesions were resected without difficulty, as the plexus fibers passed around the lesions and were only displaced but not invaded at surgery (Fig. 2). Regarding the postoperative outcome, no deficit was observed in these two patients. However, when tractography showed nondisrupted and displaced fibers passing inside the tumor (patients nr.3 and 4), after discussion of the tractography findings with the surgeon, no surgical
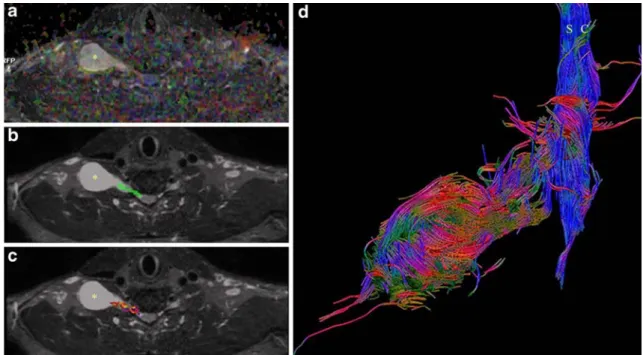
interven-Fig. 2 a MIP Coronal reconstruction of the 3D STIR SPACE sequence showing a distal schwannoma of the brachial plexus (white asterisk). Note that despite the high resolution of the anatomic sequence, it is very difficult to assess the integrity and position of the C7 fibers at the level of the schwannoma. The fusiform thickening of the proximal portion of C8 corresponds to a second schwannoma (black asterisk). b Fused ADC image and tractography and c tractography alone showing the displaced fibers of the posterior cord (white arrows) passing around the schwannoma (asterisk) suggesting an easier surgical enucleation. The findings were confirmed at surgery
tion was planned but a wait-and-see policy. Non-evolution of these lesions was confirmed on follow-up MRI and clinical/ electromyographic control (Figs.3 and4) obtained during a time period of up to 2 years after the initial evaluation. In the remaining patients with malignant tumors (Fig.5) involving the brachial plexus in which loss of complete fiber architecture was seen at DTI, combined chemo-radiotherapy was performed. In one patient with metastatic lymphadenop-athy and disseminated extranodal tumor spread, the tumor masses displaced the brachial plexus fibers (patient nr. 12). Surgery confirmed the findings, and the patient had additional chemo-radiotheraphy after surgical intervention.
Discussion
Results of our study show that DTI with tractography reconstructions using an EPI sequence with a monopolar gradient is able to depict the long trajectory of the brachial plexus fibers in normal volunteers and in patients with neoplastic conditions. We have also shown that FA and ADC values can be obtained in individual nerve fibers both at anatomically normal appearing levels and at the level of symptomatic lesions.
Tractography is powerful tool developed to aid image interpretation. The primary purpose of tractography is to
Fig. 3 Step-by-step reconstruction of the tractography of the brachial plexus in a 42 year-old male patient a axial FA maps, combined with STIR 3D anatomical mask and b axial STIR 3D MPR with
superimposed seed points c resulting fibers from the previous seed points d final result showing the fibers within and around the benign neurogenic tumor (asterisks in a,b,c)
Fig. 4 MIP Coronal reconstruction obtained from the STIR 3D dataset (a), further fused with tractography (b) revealing plexiform neurofibromas (asterisks) in a patient with proved neurofibromatosis
type 1 involving the entire brachial plexus (c). Note the other neurofibromas in the left cervical region (white arrows)
clarify the directional architecture of tissues by integrating pathways of maximum diffusion coherence [19]. DTI is actually the only method which can give an indirect view of the microstructure of nervous tissue in addition to the fiber trajectory. Peripheral nerves may be seen using diffusion tensor imaging (Fig.1) because diffusion of water molecules preferably follows the direction of the fibers and is restricted perpendicularly to them (inherent anisotropic diffusion).
The fibers depicted with tractography are often consid-ered to represent individual axons or nerve fibers, but they are more correctly viewed in physical terms as lines of fast diffusion that follow the local diffusion maxima and that only generally reflect the axonal architecture [19].
DTI of the brachial plexus is technically challenging because of motion and respiratory artifacts (particularly in large patients), swallowing and CSF pulsation artifacts. In addition, due to the proximity of the lung apex, field inhomogeneity is often present at the interface between the lung and the chest wall, as well as in the region of the lower infraclavicular portion of the brachial plexus. As DTI is based on an EPI sequence, susceptibility-induced artifacts are inherent resulting in massive image distortion. Because of a relatively large voxel size of 2×2×2 mm, partial volume effects caused by the small size and oblique orientation of fibers are difficult to avoid. Extended spatial coverage for the entire plexus results in a long acquisition time that prevents using additionally signal averaging to improve SNR and respiratory triggering in order to freeze
motion. According to our preliminary experience, diffusion weighting implemented using a monopolar gradient diffusion kernel (Stejskal–Tanner) is the best clinical compromise allowing one to achieve a much shorter TE than the bipolar gradient, minimizing T2* signal decay and distortion thereby resulting in higher SNR in minimum acquisition time. Low SNR, inherent motion, and partial volume effects can strongly impair the accuracy of FA measurements and fiber tracking performances [20].
As an alternative to fiber tracking based on streamlining model, as done in this prospective study, Hagmann and colleagues, as well as other investigators, evaluated statistical fiber tracking methods based on consideration of the tensor as a probability distribution of fiber orientation [21, 22]. Data from our preliminary study show that the post-processing permits the reconstruction of the most relevant fibers, and this is easier when the nervous structures are larger than in the normal patients (Fig. 4).
Although, when using the t test, no difference in FA and ADC values was found for the different measurements made by one rater; we found a poor–fair level of concordance between intra-observer measurements of both FA and ADC when using the ICC statistics. A high intra-observer variability of FA values was previously reported in the brain especially in the internal capsule and centrum semiovale [23]. The lower reliability of FA measurements is thought to be caused by partial volume effects, the complex architecture within each individual pixel, spatial distortion,
Fig. 5 Sixty-five-year-old patient with adenocarcinoma of the lung. a, b Coronal and axial T1 w FAT SAT with gadolinium and coronal 3DSTIR image c showing a large right-sided mass infiltrating the plexus brachialis region. Assessment of the integrity of the roots and
trunks is impossible as they have the same signal intensity as the tumor. Coronal ADC map superimposed with tractography recon-struction showing the resulting disorganization and interruption of nerve fibers on the tractography reconstruction image (d)
image noise that produce errors in the calculated tensor, and, therefore, in its eigenvalues and eigenvectors which strongly influence FA values [24]. As mentioned in the“Introduction,” challenges of DTI imaging in the brachial plexus include respiratory motion and geometric distortion that can induce variable tissue shift contributing indirectly to the average noise and affecting FA measurements. FA and ADC values should, therefore, be interpreted with caution.
Our initial experience at 1.5T shows that DTI and fiber tracking may be of potential interest in the assessment of neoplastic pathologies and may offer a new approach for imaging brachial plexus diseases and for understanding the underlying pathophysiological mechanisms. However, further improvements in the robustness of this technique are necessary to make it routinely available for a larger range of patients.
DTI with tractography does not replace anatomic plexus imaging as provided with 2D T1- and T2-weighted sequences or with the 3D STIR SPACE sequence. However, it may give additional information regarding the integrity of plexus fibers and their pattern of displacement or impairment with respect to the tumor mass (Figs.2and3), which is not always easy to diagnose with anatomic images alone.
Based on the results of our study, we cannot make the difference between benign and malignant tumors using FA and ADC measurements although recent publications suggest that ADC values may help differentiate between the two as malignant tumors due to their high cellularity typically have a lower ADC as compared to benign tumors [25, 26]. Possible explanations why we did not have a significant difference between FA and ADC values of benign and malignant tumors include the small number of tumors in our series and the heterogenous histology, which may also play a role. Nevertheless, our preliminary data suggest that we may differentiate between benign and malignant tumors by using DTI and tractography because the fibers in benign tumors pass around or inside the mass without being destroyed. However, in malignant tumors due to rapid tumor growth, the fibers are destroyed and consequently disrupted. In these cases, our data suggest that the fiber tracking technique shows complete disorganiza-tion and destrucdisorganiza-tion of the cords and trunks.
In summary, our results suggest that DTI with fiber tracking reconstruction is technically feasible in the majority of patients in a clinical routine setting and may demonstrate normal tracts, tract displacement, or corresponding alter-ations (deformation, infiltration, or disruption) due to pathological processes located within or along the brachial plexus. Our initial experience shows that DTI may also be useful in surgical planning.
Conflict of interest statement We declare that we have no conflict of interest.
References
1. Mori S, Kaufmann WE, Davatzikos C, Stieltjes B, Amodei L, Fredericksen K, Pearlson GD, Melhem ER, Solaiyappan M, Raymond GV, Moser HW, van Zijl PC (2002) Imaging cortical association tracts in the human brain using diffusion-tensor-based axonal tracking. Magn Reson Med 47:215–223
2. Mori S, Crain BJ, Chacko VP, van Zijl PCM (1999) Three-dimensional tracking of axonal projections in the brain by magnetic resonance imaging. Ann Neurol 45:265–269
3. Vargas MI, Delavelle J, Jlassi H, Rilliet B, Viallon M, Becker CD, Lövblad KO (2008) Clinical applications of diffusion tensor tractography of the spinal cord. Neuroradiology 50(1):25–29 Epub 2007 Oct 2
4. Pierpaoli C, Jezzard P, Basser PJ, Barnett A, Di Chiro G (1996) Diffusion tensor MR imaging of the human brain. Radiology 201 (3):637–648
5. Bammer R, Acar B, Moseley ME (2003) In vivo MR tractography using diffusion imaging. Eur J Radiol 45:223–234
6. Gillard JH, Papadakis NG, Martin K, Price CJ, Warburton EA, Antoun NM, Huang CL, Carpenter TA, Pickard JD (2001) MR diffusion tensor imaging of white matter tract disruption in stroke at 3 T. Br J Radiol 74(883):642–647
7. Shimony JS, McKinstry RC, Akbudak E, Aronovitz JA, Snyder AZ, Lori NF, Cull TS, Conturo TE (1999) Quantitative diffusion-tensor anisotropy brain MR imaging: normative human data and anatomic analysis. Radiology 212(3):770–784
8. Wieshmann UC, Clark CA, Symms MR, Franconi F, Barker GJ, Shorvon SD (1999) Reduced anisotropy of water diffusion in structural cerebral abnormalities demonstrated with diffusion tensor imaging. Magn Reson Imaging 17(9):1269–1274 9. Clark CA, Werring DJ (2002) Diffusion tensor imaging in spinal
cord: methods and applications - a review. NMR Biomed 15(7–8): 578–586 Review
10. Wheeler-Kingshott CA, Hickman SJ, Parker GJ, Ciccarelli O, Symms MR, Miller DH, Barker GJ (2002) Investigating cervical spinal cord structure using axial diffusion tensor imaging. Neuro-image 16(1):93–102
11. Ducreux D, Lepeintre JF, Fillard P, Loureiro C, Tadié M, Lasjaunias P (2006) MR diffusion tensor imaging and fiber tracking in 5 spinal cord astrocytomas. AJNR Am J Neuroradiol 27(1):214–216
12. Hiltunen J, Suortti T, Arvela S, Seppä M, Joensuu R, Hari R (2005) Diffusion tensor imaging and tractography of distal peripheral nerves at 3 T. Clin Neurophysiol 116(10):2315–2323 13. Skorpil M, Engström M, Nordell A (2007)
Diffusion-direction-dependent imaging: a novel MRI approach for peripheral nerve imaging. Magn Reson Imaging 25(3):406–411
14. Khalil C, Hancart C, Le Thuc V, Chantelot C, Chechin D, Cotten A (2008) Diffusion tensor imaging and tractography of the median nerve in carpal tunnel syndrome: preliminary results. Eur Radiol 18(10):2283–2291 Epub 2008 Apr 17
15. Renoux J, Facon D, Fillard P, Huynh I, Lasjaunias P, Ducreux D (2006) MR diffusion tensor imaging and fiber tracking in inflammatory diseases of the spinal cord. AJNR Am J Neuroradiol 27(9):1947–1951
16. Takahara T, Hendrikse J, Yamashita T, Mali WP, Kwee TC, Imai Y, Luijten PR (2008) Diffusion-weighted MR neurography of the brachial plexus: feasibility study. Radiology 249(2):653–660 17. Tsuchiya K, Imai M, Tateishi H et al (2007) Neurography of the
spinal nerve roots by diffusion tensor scanning applying motion-probing gradients in six directions. Magn Reson Med Sci 6(1):1–5 18. Viallon M, Vargas MI, Jlassi H, Lövblad KO, Delavelle J (2008) High-resolution and functional magnetic resonance imaging of the brachial plexus using an isotropic 3D T2 STIR (Short Term
Inversion Recovery) SPACE sequence and diffusion tensor imaging. Eur Radiol 18(5):1018–1023
19. Hagmann P, Thiran JP, Jonasson L, Vandergheynst P, Clarke S, Maeder P, Meuli R (2003) DTI mapping of human brain connectivity: statistical fibre tracking and virtual dissection. Neuroimage 19:545–554
20. Kristoffersen A (2009) Diffusion measurements and diffusion tensor imaging with noisy magnitude data. J Magn Reson Imaging 29(1):237–241
21. Parker GJ, Haroon HA, Wheeler-Kingshott CA (2003) A framework for a streamline-based probabilistic index of connec-tivity (PICO) using a structural interpretation of MRI diffusion measurements. J Magn Reson Imaging 18:242–254
22. Behrens TE, Woolrich MW, Jenkinson M, Johansen-Berg H, Nunes RG, Clare S, Matthews PM, Brady JM, Smith SM (2003)
Characterization and propagation of uncertainty in diffusion-weighted MR imaging. Magn Reson Med 50:1077–1088 23. Ozturk A, Sasson AD, Farrell JA, Landman BA, da Motta AC,
Aralasmak A, Yousem DM (2008) Regional differences in diffusion tensor imaging measurements: assessment of intrarater and interrater variability. AJNR Am J Neuroradiol 29(6):1124–1127
24. Wakana S, Caprihan A, Panzenboeck MM, Fallon JH, Perry M, Gollub RL, Hua K, Zhang J, Jiang H, Dubey P, Blitz A, van Zijl P, Mori S (2007) Reproducibility of quantitative tractography methods applied to cerebral white matter. Neuroimage 36(3):630–644 25. Chawla S, Kim S, Wang S, Poptani H (2009) Diffusion-weighted
imaging in head and neck cancers. Future Oncol 5(7):959–975 26. Vandecaveye V, De Keyzer F, Vander Poorten V et al (2009) Head
and neck squamous cell carcinoma: value of diffusion-weighted MR imaging for nodal staging. Radiology 251(1):134–146