ORIGINAL PAPER
Online electrothermal heating of laser-generated aerosols:
effects on aerosol particle size and signal intensities
in ICPMS
Robert Brogioli&Bodo Hattendorf&Joachim Koch&
Helmar Wiltsche&Luca Flamigni&Detlef Günther
Received: 12 August 2010 / Revised: 8 October 2010 / Accepted: 2 November 2010 / Published online: 24 November 2010 # Springer-Verlag 2010
Abstract To achieve separation of isobaric interferences and minimization of matrix related interferences for laser ablation-inductively coupled plasma mass spectrometry (LA-ICPMS) electrothermal heating of laser generated aerosols was investigated by analyzing a range of solid samples: NIST SRM 610, MBH B26, BAM M381, BAM M601 and Tantalum. ICPMS measurements showed that individual elements can be removed from the laser-generated aerosol at characteristic temperatures for different solid materials. Signal reduction as high as 3 orders of magnitude were achieved for volatile elements, such as Ag and Cd when heating laser-generated aerosol of NIST SRM 610 silicate glass. A signal reduction of more than 99% was obtained for Rb while Sr remained practically unaffected. A temperature- and matrix-dependent change of particle size distribution after aerosol heating was observed by means of laser light scattering (direct aerosol visualization) and scanning electron microscopy. In the temperature range between 900 and 1,200 °C, element unspecific signal
suppression was observed, which could be related to a change of the particle size distributions.
Keywords ETV. ICPMS . Laser ablation . Element separation . Spectral interferences . Particle size distribution .87Rb/87Sr separation
Introduction
Laser ablation–inductively coupled plasma mass spectrome-try (LA-ICPMS) has become a widespread analytical technique for direct solid sample analysis of major, minor, and trace elements [1–3]. Examples of application of this technique can be found in the fields of geology, material science, forensic, medicine, and biology [3]. Very fast and simple sample preparation, sub-ppm level limits of detection for most elements together with micrometer-range spatial resolution are the key features of this technique. Although a minimum of sample preparation and pretreatment has advantages in terms of analysis times and reduces the risk of sample contamination, matrix separation to account for matrix effects or spectral interferences has not been possible. For conventional solution nebulization ICPMS, sample pretreatment techniques have been developed in order to separate isobaric interfering elements or separate matrix components prior to the introduction in the ICPMS instru-mentation. For instance, online coupling of ion-exchange chromatography to ICPMS has been demonstrated to be effective in the separation of the87Rb/87Sr isobars for example in the field of geochronology [4] and for provenience analysis of foodstuffs [5–7]. The use of ion chromatography ICPMS for the elimination of isobaric interferences for the determination of fission products and actinides is widely used [8]. Furthermore, high-pressure liquid chromatography
Published in the special issue Laser Ablation with Guest Editors Detlef Günther and Jan Fietzke.
Electronic supplementary material The online version of this article (doi:10.1007/s00216-010-4410-4) contains supplementary material, which is available to authorized users.
R. Brogioli
:
B. Hattendorf:
J. Koch:
L. Flamigni:
D. Günther (*)Laboratory of Inorganic Chemistry, ETH Zurich, Wolfgang-Pauli Strasse 10,
8093 Zurich, Switzerland
e-mail: guenther@inorg.chem.ethz.ch H. Wiltsche
Institute for Analytical Chemistry and Food Chemistry, Graz University of Technology,
Stremayrgasse 9, 8010 Graz, Austria
ICPMS has been demonstrated to be a powerful tool for the online separation of isobaric interferences of stable isotopes and long-lived radionuclides in radioactive materials [9]. In a similar way, the same analytical technique has been employed in order to overcome the isobaric interference between238U and 238Pu for the determination of plutonium isotope concentrations in irradiated nuclear fuels [10].
Electrothermal vaporization (ETV) as an alternative sample introduction system has been demonstrated to be versatile and effective in overcoming spectral and isobaric interferences for ICPMS thanks to its capability to selectively vaporize target analytes and pre-vaporize sol-vent or matrix components. Matrix- and solsol-vent-related polyatomic interferences have already been mitigated using this technique in 1991 by Carey et al. [11] and are continuously developed further [12–15]. Using the same principle, it is also possible to temporally resolve the signal of isobaric species. This has been investigated by Gregoire in order to measure Os isotope ratios in Iridosmine samples minimizing the isobaric overlap with187Re [16]. In another study, Holcombe et al. optimized an ETV-ICP(TOF)MS system in order to enhance the temporal separation of isobaric isotopes [17]. More recently, the temporal separa-tion of Rb and Sr during vaporizasepara-tion has been achieved and benchmarked analyzing the reference material NIST SRM 607 by coupling an ETV unit to a multicollector ICPMS [18]. In another recent study, the use of ETV together with dynamic reaction cell has been used in order to resolve the signal of90Sr from90Zr and 90Y [19].
In general, in comparison to chromatographic techniques, ETV has been demonstrated to be less time-consuming and less prone to sample contamination. Unfortunately, ETV-ICPMS analysis lacks spatial resolution which on the other side can be achieved by LA-ICPMS. Combining these two methods would allow spatially resolved analysis together with interferences minimization.
In an initial study by Vaculovic et al. [20], an ETV unit has been coupled to a LA-ICPMS system in order to investigate the effects of thermal treatment on the laser-generated aerosol of metallic samples and alloys. It could be shown that the matrix elements’ signals were suppressed at characteristic furnace temperatures. Based on those findings, this work has explored the potential use of thermal treatment of laser-generated aerosols to achieve online separation of elements for LA-ICPMS thus avoiding isobaric interferences or diminishing matrix-related spec-troscopic and non-specspec-troscopic interferences.
Experimental
In order to investigate the effects of electrothermal heating on laser-generated aerosols and understand the interactions
of the laser-generated aerosol with the graphite tube, two main aspects were investigated during this study: the temperature dependence of the ion signal and the particle size dependence of the laser-generated aerosol upon electrothermal heating. The laser ablation system utilized during the experiments was a 213 nm Nd:YAG laser system (LSX213, CETAC Technologies, USA). Operating param-eters are listed in Table1. The laser-generated aerosol was transported by helium through a PVC tube (6 mm inner diameter) to the inlet of an HGA-600MS electrothermal vaporization unit (Perkin Elmer, Canada). Inside the HGA-600MS, the aerosol was transported through the graphite tube where it was heated to a specific temperature (up to 2,650 °C). This temperature was adjusted in the control software for the HGA-600MS but no attempt was made to verify the actual temperature inside the tube with the laser aerosol passing through. Neither chemical modifiers nor additional gases were introduced into the graphite tube during online heating of the laser-generated aerosols. The ETV graphite tubes utilized were HGA Pyrocoated L’vov Graphite Tubes (Perkin Elmer, Canada) without platform. These tubes are 28 mm in length and 8 mm in diameter (6 mm inner diameter). In contrast to conventional ETV-ICPMS, where graphite tubes are in direct contact with solvents, acids and chemical modifiers they only got in contact with helium and eventually particles from the laser-generated aerosols. No macroscopic signs of deterioration of the graphite tubes like cracks were noticed after numerous cycles including extended heating periods (80 s) at temperatures between 2,000 and 2,650 °C. Tubes heated at temperatures higher than 2,000 °C could be utilized for more than 1,800 s, which would correspond to more than 350 atomization cycles in conventional ETV-ICPMS, still leading to reproducible results (within 10%). Heating cycles at temperatures above 2,000 °C for more
Table 1 LSX 213: laser ablation parameters for different type of analysis of the laser-generated aerosols
ICPMS measurements Particle size distribution and morphology Direct aerosol visualization
Laser type Nd:YAG Wavelength 213 nm Spot size 25-50μm 25μm 150μma Energy density 17-19 J/cm2 Scan rate 10μm/s Repetition rate 2-10 Hzb 10 Hz Carrier gas He
Flow rate 0.5 l/min
aFor direct aerosol visualization more ablated mass was needed bAblation frequency was lowered to 2 Hz for Cu and to 5 Hz for Zn and MBH B26
than 80 s were not used in this study. Depending on the type of aerosol analysis, the aerosol exiting the ETV unit was either analyzed by ICPMS for the elemental response, a laser light scattering set up or collected on filter for scanning electron microscopy (SEM) measurements.
The materials investigated within this study were: SRM 610 (NIST, USA, silicate glass), B26 (MBH Analytical Ltd., England, 62.9% Cu, 30.0% Zn), ZRM M601 (BAM, Germany, pure zinc), ZRM M384 (BAM, Germany, pure copper), and Ta as metal (data not shown).
Temperature dependence of ion signal intensity after aerosol electrothermal heating
For ion signal measurements the ETV unit was connected either to an Elan 6000 (Perkin Elmer, Canada) or an Element 2 (Thermo Finnigan, Germany) ICPMS. Argon as make-up gas was introduced directly in front of the ICPMS via a “T” connecting tube. The Element 2 was used to measure signal intensities of Cr and Ca where the influence of spectral interferences due to the release of carbon from the ETV was substantial. The ICPMS were tuned daily in order to reach maximum sensitivity (for Li, Al, Ce, U, and Th), an oxide rate formation lower than 1% (Th/ThO) and U/Th ratio of ~1 (Table2) while ablating NIST SRM 610. In order to calculate the degree of ion signal suppression after thermal heating of the aerosol, the temperature program shown in Fig. 1 was applied. Matrix and trace elements were analyzed for NIST SRM 610 whereas for MBH B26, BAM M601, BAM M381, and Ta metal only the main components were analyzed.
Temperature dependence of aerosol particle size and morphology after aerosol electrothermal heating Laser light scattering at a cross section at the end of the transport tubing downstream the ETV unit was used to determine changes in particle size. Therefore, this region was irradiated by a light sheet produced after a vertical aperture of about 0.5 mm of width, by a pulsed, frequency-doubled Nd:YAG laser (Minilite PIV, Continuum, USA). The distance between light sheet and tube end was kept as small as possible to avoid the region where the aerosol is
mixing with the ambient air. Scattered light was monitored side-on using a high-resolution (1,600×1,200 pixels) CCD camera of 10-bit dynamic range (JAI-M2, Stemmer Imaging GmbH, Germany) equipped with a macro zoom objective (×4 maximum magnification, Stemmer Imaging GmbH, Germany). Both camera and Nd:YAG laser were triggered by a multi-channel delay box (DG-535, Stanford Research Systems, USA). A sketch of the optical layout and trigger scheme applied as well as further details about the experimental arrangement can be found in reference [21]. Uncompressed frames obtained from the camera were analyzed using the ImageJ microscopy software [22]. To estimate the changes in scattering light intensity, a circular region of interest was selected inside the inner perimeter of the tube, from which all pixel values were integrated using the built-in “Measure” function. A custom-written routine allowed all frames to be sequentially processed as batch. Size calibration under these working conditions was rather difficult. Therefore, data of these particle studies represent relative differences only.
It should be noted that changes in the scattering light intensities are in this case considered to be mainly a result of variations of the mean particle size. Initially, particle sizes are in the range where Rayleigh scattering dominates, which scales with d6. Thus an increase in scattering light intensities would indicate that larger particles are present in the aerosol, while, due to conservation of mass, their number density is reduced by d−3.
For further particle size measurements of heated aerosols of NIST SRM 610, the ETV was connected to an optical particle counter (OPC): HS-LAS (Particle Measuring Systems, USA) with a measurement range between 65 nm and 1 μm covering 32 discrete channels of variable width [23]. The aerosol, while being heated for 60 s at constant temperature, was diluted with N2 (0.7 l/min) by a bucket wheel diluter (MD19-li, Matter Engineering, Switzerland) before entering the OPC to avoid detector saturation. The experiment was repeated for the following furnace temper-atures: ambient, 800, 900, 1,000, 1,100, 1,200, 1,300, 1,400, 1,500, and 2,000 °C. To calculate the particles’ volume, spherical geometry of the particles was assumed. For morphology studies aerosol particles were collected on Isopore™ Membrane Filters 0.4 μm HTTP (Millipore,
Table 2 ICPMS operating parameters
NIST SRM 610 (Elan 6000) MBH B26, BAM M601, BAM M381, Ta NIST SRM 610 (Element 2)
RF power 1,300 W 1,300 W 1,300 W
Skimmer cone Platinum 0.8 mm Nickel 0.8 mm Platinum 0.8 mm Sampler cone Platinum 1.1 mm Aluminum 0.8 mma Platinum 1.0 mm Make-up gas (Ar) 0.76 l/min 0.70 l/min 0.88 l/min
a
USA). The filters with collected particles were then mounted on a graphite adhesive tape and images were acquired by SEM (1530 FEG Gemini, Carl Zeiss AG, Germany). The aerosol was collected on the filters for 60 s after heating to 1,100, 2,000, and 2,500 °C.
Results and discussion
Temperature dependence of ion signals intensity after aerosol electrothermal heating
Silicate glass: NIST SRM 610
Figure 2 shows an example of the signal intensities measured by ICPMS for three trace elements in NIST SRM 610 in dependence on furnace temperature. The elements were selected to illustrate the main effects of the ETV heating on the laser-generated aerosol from silicate glass. As expected from the observations reported by Vaculovic et al. [20] the elements present in the aerosol showed a signal decrease at element characteristic temper-atures. The onset of the signal decrease (inflection temperature) was ~500 °C for Ag, between 1,000 and 1,200 °C for Rb, ~2,300 °C for Sr.
Nevertheless, a major difference was observed in the temperature range between 1,000 and 1,300 °C, where a signal suppression was observed for all measured elements (trace and main components) in NIST SRM 610. From here on, this phenomenon will be referred to as element-non-specific signal suppression. The degree of this non-element-non-specific signal suppression was up to 2 orders of magnitude for all measured isotopes. Interestingly, the signal at m/z =20 (Ar2+, Ne+) and m/z=76 (Ar2+) did not exhibit a significant
change in intensity in this temperature range indicating that the plasma conditions were not perturbed significantly. The possible reasons of this element-non-specific signal sup-pression will be discussed more in detail in the “Aerosol particle size and morphology after thermal treatment” section. This section will focus on the element-specific signal suppression observed in the temperature range between ambient and 900 °C and 1,300–2,600 °C, respectively. In this temperature range, the signal decrease is most likely occurring due to evaporation of elements (according to their thermodynamic properties) from aerosol particles with subsequent deposition (condensation) on the cool surface downstream the heated zone of the graphite tube.
Following this decrease, ion signals of several elements (like Rb and Ag in Fig. 2) increase again as the furnace temperature exceeds 2,000 °C. This increase is most likely the result of re-mobilization of previously condensed material from a region near the exit of the furnace, where the temperature may reach the vaporization point [20]. The signal increase at high temperatures might partly also be caused by an enhancement of sensitivity due to the release of carbon from the graphite tube affecting the plasma characteristics [24] (13C+ signal intensity depending on furnace temperature is shown in Fig. 2). The addition of carbon in parallel to laser-generated aerosol showed an enhancement of the net signal for elements with high first ionization potential (e.g., As) by a factor ~2 when heating the furnace up to 2,650 °C. For other elements, the enhancement was not as significant (<20%). It is therefore impossible that a signal increase by an order of magnitude as observed for example for Ag is predominantly caused by the presence of carbon within the aerosol.
In Table 3, the elements analyzed in this study are classified according to the maximum element-specific signal suppression after ETV heating of the laser-generated aerosol. Elements whose signal was suppressed to background intensities like Ag and Cd are grouped
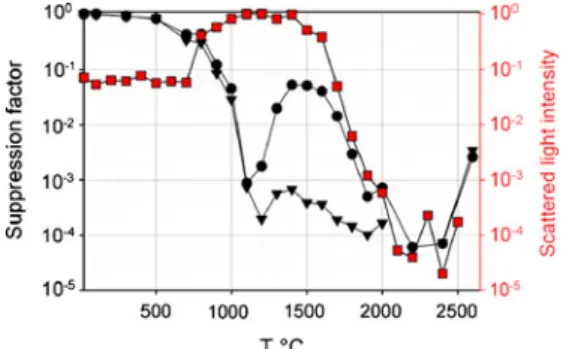
Fig. 2 Temperature profile showing the signal suppression of109Ag+ (squares), 85Rb+ (triangles) and 88Sr+ (circles) for the aerosol generated from NIST SRM 610, together with the signal recorded for13C+(red line) and the scattered light intensity (dashed line). See text for details
Fig. 1 Measurement of suppression factors: first the background and the laser ablation signals were acquired. After approximately 40 s of ablation, the ETV is heated to a constant temperature for 80 s while laser ablation is stopped after heating for 60 s. The ratio of the background-corrected ion signal intensities with and without laser ablation signal and laser ablation plus electrothermal heating is then calculated to yield the suppression factor. At the end of the sequence, the temperature was raised up to 2,650 °C for 2 s for furnace cleaning. This sequence was applied for furnace temperatures between 100 and 2,600 °C in steps of 100 °C
together with elements experiencing signal suppression equal or above 99%. It is important to note that the maximum signal suppression is dependent on the level of contamination within the furnace. Installation of a new set of graphite contacts and graphite tube led to lower absolute signal intensities at increased temperatures. If the furnace was repeatedly heated to 2,650 °C for 50 s the background signals could even be lowered further.
In contrast to what has been observed for the pure materials in the study of Vaculovic [20] where elements like W and Mo did not exhibit significant signal suppression, their signals reached background level when introducing an aerosol generated from NIST SRM 610. It is thus apparent that the dependence of the ion signal intensities on furnace temperature is affected by the chemical form of the elements in the sample matrix and the resulting aerosol. A tentative comparison of inflection temperature and melting point of the corresponding oxides (Fig. 3) shows some correlation for the majority of the analyzed elements. This correlation is somewhat surprising since the proposed mechanism for the element-specific suppression involves vaporization rather than melting. On the other hand, there are elements which show significant deviations from this trend. Elements such as Cs, Rb, or Ta for example show higher inflection temperatures than their respective melting points while elements like Cd, Mo, W, or Th show a negative offset. Some compounds like Rb2O, WO2, or
MoO2 would decompose at the indicated temperature but
do not show a similar behavior. Reactions with carbon released from the graphite tube or interactions of the aerosol particles with the tube walls may thus play a significant role in the element-specific suppression. These processes are subject to further investigations.
From these observations, it becomes obvious that the element-specific signal suppression is not only depending on the physical properties of the elements but also on the
respective chemical species present in the aerosol. Howev-er, the actual composition of the individual aerosol particles is difficult to assess and there are studies which have been shown that elements fractionate between different particles and particle sizes [25–27]. Further investigations are needed to elucidate the processes causing the element-specific signal suppression.
Separation of Rb and Sr Of particular interest is the determination of Sr isotope ratios in geochronology applications. Because of the presence of the isobaric interference from 87Rb in these samples, methods have been developed to separate Sr from Rb for pneumatic nebulization ICPMS as well for ETV-ICPMS. For LA-ICPMS, online separation has not been attempted yet. Consequently, only mathematical correction has been applied when measuring samples by LA-ICPMS and only samples with relative low Rb concentration could be analyzed yet. Recent reports have described isotope ratios determination in samples with a maximum Rb/Sr concen-tration ratio of 0.002 [28] and up to 0.14 [29].
In the current study, the reference material NIST SRM 610 was analyzed where Rb and Sr are both present with a concentration of ~500 ppm. With the experimental setup used, it was possible to decrease the signal intensity of Rb by 99% at an ETV temperature of 2,000 °C where the Sr signal still remains basically unaffected (Fig. 2). After extended cleaning of the furnace by repeated heating to the
Fig. 3 Comparison between measured onset of signal decrease (inflection T) and oxide melting temperature (from [34]) for major and trace elements measured in NIST SRM 610. In the temperature range between 1,000 and 1,300 °C (gray area), the exact inflection temperature is not known because all signals are suppressed in an element-non-specific way. Error bars indicate the estimated uncertainty for assigning the inflection temperature from the temperature profiles. single asterisk Decomposition, double asterisk sublimation
Table 3 Maximum signal suppression measured after aerosol thermal treatment Maximum signal suppression Elements >99 Cua, Zna, Asa, Moa, Aga, Cda, Sna, Sba, Tea, Cs, Ce, Wa, Aua, Tla, Pba, Bi, U
80–99% Li, Na, Mn, Rb, Ba, Cr 30–80% Be, Ca, Sr, La, Th <20% Al, Ti, Y, Zr, Lu, Hf, Ta
Ca and Cr were measured with sector field ICPMS in medium resolution because of spectral interferences from carbon. For the less abundant interferences occurring on Al, Ti, Mn, Cu, and Zn the background signal during furnace heating was subtracted from the ion signal during laser ablation
maximum temperature, the suppression rate for Rb can be further enhanced by a factor 2.
If this result is compared to the results obtained by Rowland et al. [18], where ~98% of Rb was selectively pre-vaporized from NIST SRM 607 with the use of ETV-ICPMS, the same separation efficiency was achieved online for LA-ETV-ICPMS. This will allow the determi-nation of Sr isotope ratios in samples where the Rb/Sr ratio is close to 1.
Brass, Cu, and Zn
Also for the brass sample, both element-specific and element-non-specific signal suppression were observed (Fig. 4). Element-non-specific signal suppression occurred in a temperature range between 700 and 1,500 °C, which is significantly wider than for NIST SRM 610. The signal suppression for Zn and Cu was greater than 99.9% at 2,200 °C. In comparison to the silicate glass, the signal of Zn has a lower inflection temperature (~1,000 °C instead of 1,700 °C), which in this case compares much better with the boiling temperature of the pure metal (907 °C). The opposite was observed for the Cu signal, where the signal suppression occurred at approx. 1,400 °C, a higher temperature than in the silicate glass, but closer to the metal’s melting point (1,084 °C) than the boiling point (2,927 °C). It is however, more difficult to estimate the onset of the element-specific suppression for Cu and Zn because it overlaps with the non-specific suppression in both cases.
Sn, Sb, Pb, and Bi were also analyzed and their signals were suppressed by more than 3 orders of magnitude at a temperature of 2,200 °C. The inflection temperatures of Sn and Sb for brass are approximately 1,500 °C, again higher than observed for NIST SRM 610. Like for Zn, the inflection temperatures are closer to the elements’ boiling points (Sn: 2,602 °C, Sb: 1,587 °C) than to the respective melting points (Sn: 231 °C, Sb: 630 °C).
At 2,600 °C, the signal intensity of all measured elements increases by about one order of magnitude indicating a thermal release of previously condensed material.
The signal suppressions for the pure metals are shown in Figs. 5 (Cu) and 6 (Zn). Again, element-non-specific suppression occurs at temperatures between 700 and 1,300 °C. In contrast to brass the ion signal intensity of Cu is fully retained after the non-specific suppression at 1,500 °C and then followed by a monotonic decrease. This indicates that the onset of element-specific suppression is shifted to a higher temperature compared to brass and the silicate glass. Additionally, a much lower degree of suppression is attained at 2,300 °C than for brass.
Zn also shows a slightly different intensity profile than for brass but with an apparent onset of the element-specific suppression lowered to about 400 °C. Like for Cu however, the ion signals reach a distinctly higher level after the non-specific signal suppression at 1,400 °C and the maximum suppression observed is about an order of magnitude higher than in brass. In general, the change in the onset of the element-non-specific suppression follows the trend of the melting points with Cu≥brass>Zn, further supporting coalescence of molten nanoparticles to be responsible for the non-specific signal suppression.
Fig. 5 Integrated scattered laser light intensity (squares) and signal ratio for65Cu+(circles), after ETV heating of laser-generated aerosol
from pure copper (BAM M381)
Fig. 4 Integrated scattered laser light intensity (squares) and signal suppression for 65Cu+ (circles) and 66Zn+ (triangles) during ETV heating of laser-generated aerosol from brass (MBH B26)
Fig. 6 Integrated scattered laser light intensity (squares) and signal ratio for66Zn+(circles), after ETV heating of laser-generated aerosol from pure zinc (BAM M601)
Aerosol particle size and morphology after thermal treatment
The light scattering intensity of the aerosol exiting the graphite tube was analyzed for the same furnace tempera-ture as the suppression measurements and for all materials. The integrated light scattering intensity (assumed to be proportional to particle size and the number of particles) was then compared to the ion signal intensity measured by ICPMS. Scattering light intensities were recorded for experiments without laser-generated aerosol to visualize the effect of carbon released from the furnace in compar-ison. Irrespective of the furnace temperature, however, the scattering intensity was not significant, indicating that either the particle sizes released from the furnace or their amount was too small for detection. It is thus assumed that the changes in scattering intensity are solely a result of a modification of the initial, laser-generated aerosol due to the temperature inside the furnace.
Silicate glass: NIST SRM 610
The Electronic supplementary material contains an animat-ed sequence showing the scatteranimat-ed light intensity recordanimat-ed for the aerosol after passing through the graphite furnace at temperatures between 20 °C and 2,600 °C (Electronic supplementary material Video S1). The scattered light shows a stationary inhomogeneous dispersion pattern of the aerosol like it has already been observed in a previous study [30]. Upon heating to approximately 1,000 °C, a very similar dispersion pattern is observed, but the intensity of the scattered light is notably increased. This is attributed to a significant increase of the number density of larger particles in the aerosol. This result could be confirmed by measurements of the particle size distribution, which showed a shift to bigger particles at temperatures between 900 and 2,000 °C (Electronic Supplementary Material Fig. S2). At temperatures greater than 2,300 °C, the scattered laser light intensity decreases and falls below the intensity observed for 20 °C. Only a few bright spots were detected in this case. A lower scattered light intensity indicates less and especially smaller aerosol particles, which agrees with SEM measurements of particles collect-ed on filters at 2,500 °C (Electronic supplementary material Fig. S3).
In Fig. 2, the integrated scattered light intensity is displayed together with the signal intensity ratios. The scattered light intensity shows an abrupt increase in a temperature range between 800 and 1,100 °C which corresponds to temperature range where element-non-specific signal suppression was observed. At higher temperature, the integrated scattered light decreases mono-tonically until the highest temperature applied. This agrees
with the decrease of the particle sizes found on filters (Electronic supplementary material Fig. S3) at a furnace temperature of 2,500 °C compared to 2,000 °C (Electronic supplementary material Fig. S4).
The fact that aerosol particles from NIST SRM 610 grow bigger after heating at ~1,100 °C is surprising but is most likely a result of coalescence of molten nanoparticles. This particle growth may also serve as an explanation for the element-non-specific signal suppression as a result of incomplete vaporization of the large particles inside the ICP as proposed by Kuhn et al. [31]. Additionally, a lower transport efficiency of the larger particles between the graphite furnace and the ICPMS [32] may play a role. It is, however, not well understood, why the ion signal intensities for elements with low melting points re-appear at furnace temperatures above 1,300 °C. The profile of the scattered light intensity would indicate that large particles remain in the aerosol for temperatures up to 2,200 °C, where the non-specific signal suppression is not apparent anymore. Even though the slight decrease in scattering light intensity and the particle size distribution measurements indicate that the mean particle size is decreasing also between 1,000 °C and 2,200 °C, it appears unlikely that the recovery of the ion signals is only based on this change. At this point, it remains difficult to estimate the exact processes involved and their impact on the aerosol characteristics when entering the ICPMS.
Brass Cu and Zn
For the analyzed brass sample a similar result was obtained (Fig. 4). At temperatures between 700 and 1,600 °C an increase of the light scattering intensity was observed, which however was less pronounced than for the silicate glass. In accordance to the observations made using NIST SRM 610, this temperature range leads to element-non-specific suppression of the ion signal intensities. The onset of the suppression of the ion signals however is slightly shifted toward lower temperatures than the increase of the scattering light intensity. Nevertheless, the apparent corre-lation between the onset of the non-specific signal suppression and the increase of the scattering light intensity is similar to the silicate glass
At temperatures between 1,300 and 1,700 °C the scattered light intensity remains basically unchanged while Cu and—to a lesser extent Zn—show an intermediate increase in signal intensities.
At temperatures above 1,700 °C the scattered light intensity strongly decreases indicating that aerosol particles vaporize in the graphite furnace. This is accompanied by a decrease of the Cu ion signal, which is thought to be caused by vaporization and condensation on a cooler surface of aerosol particles.
For the pure metals investigated, the scattered light intensity increases at a temperature, which is lower than the bulk material melting point (Figs. 5 and 6). Considering coalescence of molten nanoparticles as the underlying mechanism, this would be in agreement with the fact that nanoparticles typically melt at lower temperatures than the bulk material [33]. In addition, there are remarkable deviations in the profiles of Cu and Zn when compared to brass.
For Cu the profile of scattered light intensity is similar to brass but the onset of the scattering light increase is occurring at ~300 °C lower temperature. A concurrent decrease is observed in the ion signal profiles and the scattered light intensities, which is located in a temperature regime between 800 °C and 1,400 °C and was not observed for silicate glass and brass. At temperatures higher than 1,500 °C the decrease of scattered light intensity is consistent with the signal decrease of Cu.
For Zn, the extent of the increase of scattered light intensity between 900 and 1,300 °C does not exactly match the element-non-specific signal drop of Zn. At the point where the scattered light is at the highest level (1,300 °C) the Zn signal is already partially recovered. However, in a temperature range between ambient and 800 °C as well as at temperatures higher than 1,500 °C the scattered light intensity decreases together with the signal intensity of Zn.
Conclusions
Heating of laser-generated aerosols inside an electrothermal vaporizer to temperatures of several 100 °C causes element-specific and element-non-element-specific ion signal suppression of the ion signals measured by ICPMS. In a temperature regime between ~900 and ~1,300 °C, ion signals of all elements measured in NIST SRM 610, MBH B26, Cu, and Zn show a substantial suppression, which is currently considered to be a result of coalescence of nanoparticles within the aerosol, forming large particles that are not completely vaporized inside the ICP. Aside these non-specific effects, heating the laser-generated aerosols at furnace temperatures of up to 2,600 °C yields an element-specific and matrix-dependent signal suppression. For the silicate glass, NIST SRM 610 this suppression appears to be correlated to the melting temperatures of the elemental oxides. It is attributed to the vaporization of the elements from aerosol particles and a subsequent condensation on cooler surfaces downstream the heated furnace walls. Deviations from the melting points and the respective inflection temperatures of the elemental oxides were found for various elements (e.g. Th, Ta, Rb), which suggests that also chemical reactions, most likely including carbon from
the graphite furnace, have an effect on the ion signal dependencies. Signal suppression due to matrix effects inside the ICP is unlikely as ions that are indicative of matrix effects like Ar2+did not show a detectable variation
in their signal intensity upon variations of the aerosol structure.
Characterization of the aerosol with and without heating by means of laser light scattering optical particle counting and SEM studies of filtered aerosol particles revealed that heating inside the graphite furnace is changing the particle size distribution and particle morphology of laser-generated aerosols. An increase in the mean particle sizes is observed when heating the aerosol of a silicate glass at furnace temperatures between 900 and 2,000 °C. This is in general agreement to the proposed model of melting and coalescence of primary aerosol particles and aggregates. For brass, pure Cu and Zn however the change in particle sizes as indicated by the increase in scattered light intensities was less pronounced, which is likely due to a higher number of large particles in the initial aerosol compared to NIST SRM 610. For brass, Cu, and Zn the element-specific ion signal suppression occurred at temperatures showing a similar trend like the respective boiling points of the compounds.
Additionally, gas-phase reactions with carbon released from the graphite furnace may have a significant impact on the fate of the elements when entering graphite furnace. The observations made here are currently not entirely under-stood and require further investigations in the element-specific and non-element-specific processes involved in the changes in particle sizes as well as the change of the ion signal intensities measured by the ICPMS. Especially the fact that large particles, which are assumed to form through coalescence of molten nanoparticles and their aggregates are still present when the element-non-specific suppression in NIST SRM 610 is not observed anymore requires further attention.
Coupling the ETV furnace online with LA-ICPMS nonetheless appears to be a valuable approach with significant potential for an online separation of elements from interferences in spatially resolved analysis.
In the absence of element-non-specific signal suppres-sion, the onset of element-specific suppression can be adjusted by the furnace temperature, allowing the separa-tion of elements when their respective onset temperatures are sufficiently different. As an example, an attenuation of the 87Rb signal by two orders of magnitude can be achieved, which substantially reduces the interference on
87
Sr for example in Rb-rich samples and will allow to measure Sr isotopes in the presence of Rb at a ratio of 1.
Acknowledgments We thank Frank Krumeich and EMEZ for the help with the SEM and ETH Zurich for financial support (ETH grant 24 08-3).
References
1. Durrant SF (1999) J Anal At Spectrom 14:1385–1403
2. Russo RE, Mao XL, Liu HC, Gonzalez J, Mao SS (2002) Talanta 57:425–451
3. Günther D, Hattendorf B (2005) TrAC Trends Anal Chem 24:255–265
4. Vanhaecke F, De Wannemacker G, Moens L, Van den Haute P (2001) Fresenius J Anal Chem 371:915–920
5. Garcia-Ruiz S, Moldovan M, Fortunato G, Wunderli S, Alonso JIG (2007) Anal Chim Acta 590:55–66
6. Garcia-Ruiz S, Moldovan M, Alonso JIG (2008) J Anal At Spectrom 23:84–93
7. Swoboda S, Brunner M, Boulyga SF, Galler P, Horacek M, Prohaska T (2008) Anal Bioanal Chem 390:487–494
8. Betti M (1997) J Chromatogr A 789:369–379
9. Kerl W, Becker JS, Dannecker W, Dietze HJ (1998) Fresenius J Anal Chem 362:433–439
10. Günther-Leopold I, Waldis JK, Wernli B, Kopajtic Z (2005) Int J Mass Spectrom 242:197–202
11. Carey JM, Evans EH, Caruso JA, Shen WL (1991) Spectrochim Acta B 46:1711–1721
12. Resano M, Verstraete M, Vanhaecke F, Moens L, Claessens J (2001) J Anal At Spectrom 16:793–800
13. Turner J, Hill SJ, Evans EH, Fairman B, Briche CSJW (2000) J Anal At Spectrom 15:743–746
14. Vanhaecke F, Resano M, Pruneda-Lopez M, Moens L (2002) Anal Chem 74:6040–6048
15. Yu LL, Kelly WR, Fassett JD, Vocke RD (2001) J Anal At Spectrom 16:140–145
16. Gregoire DC (1990) Anal Chem 62:141–146
17. Ertas G, Holcombe JA (2005) J Anal At Spectrom 20:687–695 18. Rowlan A, Housh TB, Holcombe JA (2008) J Anal At Spectrom
23:167–172
19. Grinberg P, Willie S, Sturgeon RE (2007) J Anal At Spectrom 22:1409–1414
20. Vaculovic T, Guillong M, Binkert J, Kanicky V, Günther D (2004) Can J Anal Sci Spectros 49:353–361
21. Koch J, Schlamp S, Rosgen T, Fliegel D, Günther D (2007) Spectrochim Acta B 62:20–29
22. Rasband WS, Image J, 2010. http://rsb.info.nih.gov/ij/, U. S. National Institutes of Health, Bethesda, Maryland, USA 23. Kuhn HR, Koch J, Hergenröder R, Niemax K, Kalberer M,
Günther D (2005) J Anal At Spectrom 20:894–900
24. Guillong M, Heinrich CA (2007) J Anal At Spectrom 22:1488– 1494
25. Kosler J, Wiedenbeck M, Wirth R, Hovorka J, Sylvester P, Mikova J (2005) J Anal At Spectrom 20:402–409
26. Kuhn HR, Günther D (2004) J Anal At Spectrom 19:1158–1164 27. Kuhn HR, Günther D (2003) Anal Chem 75:747–753
28. Ramos FC, Wolff JA, Tollstrup DL (2004) Chem Geol 211:135– 158
29. Jackson MG, Hart SR (2006) Earth Planet Sci Lett 245:260–277 30. Koch J, Wälle M, Dietiker R, Günther D (2008) Anal Chem
80:915–921
31. Kuhn HR, Guillong M, Günther D (2004) Anal Bioanal Chem 378:1069–1074
32. Arrowsmith P, Hughes SK (1988) Appl Spectrosc 42:1231–1239 33. Buffat Ph, Borel J-P (1976) Phys review A 13:2287–2298 34. Lide DR (2010) CRC handbook of chemistry and physics 88


![[DOC] Cours environnement réseau et active directory](data:image/gif;base64,R0lGODlhAQABAIAAAP///wAAACH5BAEAAAAALAAAAAABAAEAAAICRAEAOw==)