Page 1 of 7
Electronic Supplementary Material
Acknowledgements for local activities
We are thankful to the following people, organisations and institutions for arranging, managing and letting us use our study sites: Maira Bonini and her team of LHA Milano Città Metropolitana, Francesco Vidotto, Silvia Fogliatto, the University of Torino in Italy, the Italian municipalities of Corbetta and Magnago, Rolf Dänzer, Adrian Zangger, Armasuisse Immobilien, Waffenplatz Thun in Switzerland, Regula Schwarz, Fréderic Bieri, Christian Bohren, Nicolas Delabays, family Sabino and personnel of the Park Hotel Rovio, Marta Rossinelli, Françoise Serre, Lycée Terre d'Horizon, the French municipality of Creusot Montceau, the Austrian Army Administration, Kisalföldi Hulladékgazdálkodási Nonprofit Kft, József and Emese Gula, and Dániel Zagyvai.
We greatly appreciated the help of the following people in data collection and technical support: Eva van Cleef, Simon Vandenbrande, Elisa Cardarelli, Silvia Stefanelli, Stéphanie von Bergen, Daniel
Slodowicz, Bastien Boschung, Anne Haeberle, Alain Werro, Anne-Catherine Cossy-Pasche, Ágnes Csiszár, Zsuzsa Keresztes , Shahid Farooq, Nihat Akyol, Uğur Çaldiran, Tolga Sari, Iva Braje, Tin Smrekar, Jasna Markić, Katinka Blazsek, Barbara Tóth, Péter Rehova, Nina Waldhäuser, Alida Ndoci, Samuel Priemayr, Hannes Karrer, Martin Karrer, Bernhard Plachy, Bernhard Urban, Veronika Gregušová, Lenka Botyanszká, Monika Tóthová, Zenon Guzik, Katarzyna Bzdęga, Jadwiga Derwisz, Grażyna Klecz, Anna Gawron, Georgi Fayvush, Hripsime Hovannisyan, Ivana Milovic, Eugenia Nagoda, Titus Anastasiu, Dániel Zagyvai, Dénes Bartha, Linda Kamola, Zsigmond Nagy, Daniyar Memedemin, Marius Skolka, the technical staff of Agroecologie Unit INRA Dijon, Zenon Guzik, Katarzyna Bzdega, and Emese Joó.
We acknowledge financial support for local activities from the Statutory funds of the Department of Botany and Nature Protection, University of Silesia in Katowice, Poland (to BTG), from the
Gaziosmanpasa University, Turkey (grant BAP-2012/106 to HO), the Rectors' Conference of the Swiss Universities (SCIEX-NMSch Project 12.108 ‘BLISRo’ to CP), the Plant Health Laboratory of the French Agency for Food, Environmental and Occupational Health & Safety (to GF), the ÚNKP-16-3 New National Excellence Program of the Ministry of Human Capacities of Hungary (to KN), the Scientific Grant Agency of the Ministry of Education, Science, Research and Sport of the Slovak Republic and Slovak Academy of Sciences (VEGA 1/0827/14 to PT), the European Union and the State of Hungary co-financed by the European Social Fund in the framework of the TÁMOP-4.2.4.A/2-11/1-2012-0001 Hungarian 'National Excellence Program' (to GKaz), the Hungarian Research Centre of Excellence (1476-4/2016/FEKUT to MZ and ZD), and the University of Natural Resources and Life Sciences Vienna, Austria (to GKar).
Page 2 of 7
Table S1. Number of study sites for each of the European bioclimatic regions where A. artemisiifolia occurs. The Anatolian, Atlantic and Boreal region have some records of A. artemisiifolia but it is unknown if these include any established populations.
bioclimatic region sites continental 18 pannonian 11 alpine 5 mediterranean 5 blackSea 4 steppic 2 anatolian 0 atlantic 0 boreal 0
Table S2. Structure and fit of the linear mixed effect models of the relation between A. artemisiifolia reproduction and size, corresponding to Fig. 2.
response variable fixed effects random effects N plants N sites R2 marginal R2 conditional Fig.
log(racemes) log(biomass) log(biomass)|site 811 39 0.831 0.908 1a
log(racemes) log(volume) log(volume)|site 811 39 0.743 0.869 1d
log(female structures) log(biomass) + structure.type
log(biomass)|site 804 39 0.754 0.903 1b-c
log(female structures) log(volume) + structure.type
Page 3 of 7
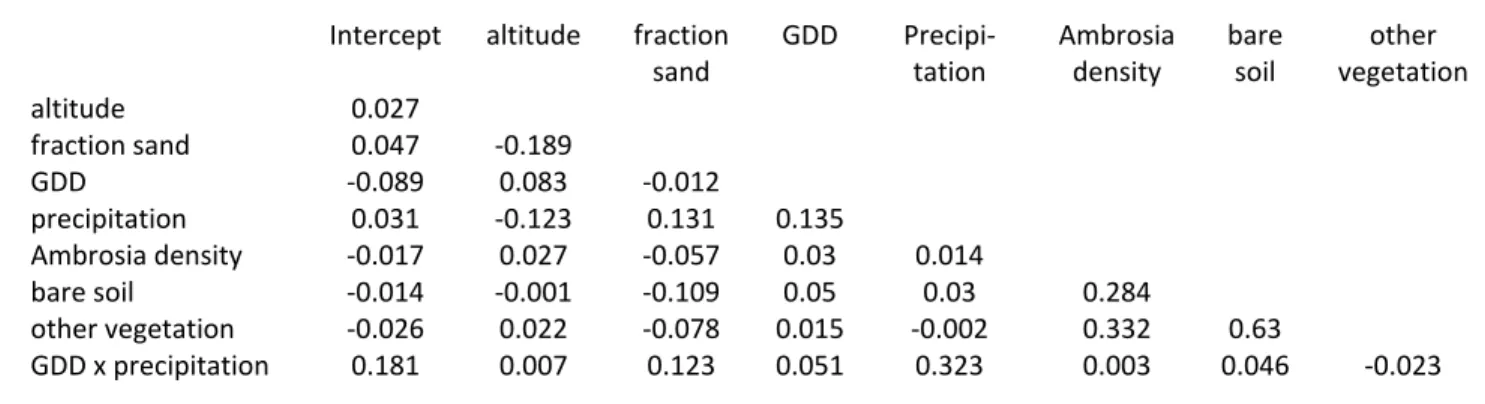
Table S3. Correlation coefficients of the model "TotalReduced" (see main document, Table 3)
Intercept altitude fraction
sand GDD Precipi-tation Ambrosia density bare soil other vegetation altitude 0.027 fraction sand 0.047 -0.189 GDD -0.089 0.083 -0.012 precipitation 0.031 -0.123 0.131 0.135 Ambrosia density -0.017 0.027 -0.057 0.03 0.014 bare soil -0.014 -0.001 -0.109 0.05 0.03 0.284 other vegetation -0.026 0.022 -0.078 0.015 -0.002 0.332 0.63 GDD x precipitation 0.181 0.007 0.123 0.051 0.323 0.003 0.046 -0.023
Table S4. The environmental factors of the model “SiteReduced” on individual plant volume, a
generalised linear mixed-effects model of environmental variables remaining after stepwise AIC-based selection of factors from the full model, and then fit by REML. Estimates represent coefficients of log(plant volume in cm3) with their Standard Error; the t-value is the ratio between the Estimate and its
Standard Error, and the p-value the probability that this t-statistic is drawn from a standard t-distribution with "df" degrees of freedom.
Environmental factor Estimate Std.Error df t-value p-value Intercept (habitat type: arable) 9.533 0.626 2326 15.223 0.000 habitat type: grassland -2.469 0.873 23 -2.829 0.010 habitat type: infrastructure -0.835 1.711 23 -0.488 0.630 habitat type: ruderal -1.297 0.769 23 -1.688 0.105
growing degree days 0.705 0.365 23 1.933 0.066
precipitation 0.442 0.432 23 1.024 0.317
growing degree days x precipitation 1.117 0.288 23 3.874 0.001
Ophraella -2.372 1.152 23 -2.058 0.051
sand -0.378 0.302 23 -1.253 0.223
Table S5. The correlation coefficients of the model “SiteReduced” in Table S4. Intercept (habitat type: arable) habitat type: grassland habitat type: infrastruct ure habitat type: ruderal fraction sand Ophraella GDD precipitati on
habitat type: grassland
-0.561 habitat type:
infrastructure -0.638 0.316 habitat type: ruderal
-0.857 0.431 0.569 fraction sand 0.165 0.045 -0.276 -0.174 Ophraella -0.363 0.023 0.238 0.223 -0.011 GDD 0.006 -0.007 -0.147 0.079 0.015 -0.346 precipitation -0.006 -0.248 0.058 0.213 -0.027 -0.369 0.305 GDD x precipitation -0.01 -0.056 0.139 0.17 0.032 -0.207 0.141 0.449
Page 4 of 7
Table S6. The environmental factors of the model “PlotReduced” on individual plant size. See legend of Table S4.
Environmental factor Estimate Std.Error df t-value p-value (Intercept) 7.605 0.285 2609 26.661 0.000 Ambrosia density -0.280 0.071 379 -3.968 0.000
bare soil -0.572 0.135 379 -4.229 0.000
other vegetation -0.357 0.120 379 -2.973 0.003
Table S7. The correlation coefficients of the model “PlotReduced” in Table S6. (Intr) Ambrosia density bare soil Ambrosia density -0.011 bare soil -0.011 0.29 other vegetation -0.015 0.34 0.637
Table S8. The environmental factors of the model “RegionalReduced” on individual plant size. See legend of Table S4.
Environmental factor Estimate Std.Error df t-value p-value (Intercept) 7.555 0.303 2609 24.924 0.000
altitude -0.749 0.295 34 -2.540 0.016
Table S9. The correlation coefficient of the model “RegionalReduced” in Table S8. (Intr)
Page 5 of 7
Fig. S1. Estimated numbers of A. artemisiifolia seeds (left) and pollen (right) produced per m2 per site
(numbers presented on a log scale, ordered according to median amounts of pollen, and ID of the sites corresponding to Table 1). Boxplots represent the variation across plots within sites, with the thick line as the median, the boxes representing the quartiles, and the whiskers 1.5 times the interquartile range, and dots data points outside the whiskers.
Page 6 of 7
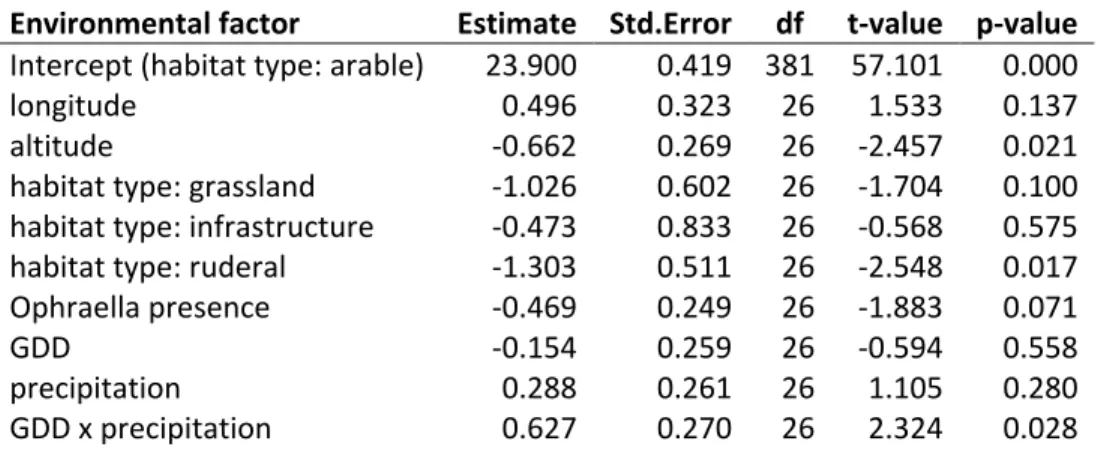
Table S10. The environmental factors of the model of the density of pollen production (expressed as log-transformed pollen numbers). See legend of Table S4.
Environmental factor Estimate Std.Error df t-value p-value Intercept (habitat type: arable) 23.900 0.419 381 57.101 0.000
longitude 0.496 0.323 26 1.533 0.137
altitude -0.662 0.269 26 -2.457 0.021
habitat type: grassland -1.026 0.602 26 -1.704 0.100 habitat type: infrastructure -0.473 0.833 26 -0.568 0.575 habitat type: ruderal -1.303 0.511 26 -2.548 0.017 Ophraella presence -0.469 0.249 26 -1.883 0.071
GDD -0.154 0.259 26 -0.594 0.558
precipitation 0.288 0.261 26 1.105 0.280
GDD x precipitation 0.627 0.270 26 2.324 0.028
Table S11. Pairwise differences in the density of pollen production between habitat types (AR=arable, GR =grassland, IN=infrastructure, RU=ruderal), according to a post-hoc Tukey test of the model in Table 10. An asterisk indicates significance at the p=0.05 level.
Estimate Std. Error z value Pr(>|z|) GR - AR == 0 -1.0258 0.5947 -1.725 0.2991 IN - AR == 0 -0.4726 0.8226 -0.575 0.9367 RU - AR == 0 -1.3031 0.5052 -2.579 0.0459 * IN - GR == 0 0.5532 0.8519 0.649 0.9117 RU - GR == 0 -0.2773 0.5781 -0.480 0.9617 RU - IN == 0 -0.8305 0.6984 -1.189 0.6217 (Adjusted p values reported -- single-step method)
Page 7 of 7
Table S12. The environmental factors of the model of the density of seed production (expressed as log-transformed seed numbers). See legend of Table S4.
Environmental factor Estimate Std.Error df t-value p-value Intercept (habitat type: arable) 9.684 0.357 381 27.114 0.000
latitude -0.807 0.271 26 -2.976 0.006
altitude -1.058 0.271 26 -3.901 0.001
habitat type: grassland -0.396 0.522 26 -0.759 0.455 habitat type: infrastructure 0.565 0.715 26 0.790 0.437 habitat type: ruderal -1.103 0.444 26 -2.485 0.020 Ophraella presence -0.432 0.189 26 -2.287 0.031
GDD -0.485 0.241 26 -2.016 0.054
precipitation 0.134 0.224 26 0.597 0.556
GDD x precipitation 0.666 0.235 26 2.837 0.009
Table S13. Pairwise differences in the density of seed production between habitat types (AR=arable, GR= grassland, IN=infrastructure, RU=ruderal), according to a post-hoc Tukey test of the model in Table 10. An asterisk indicates significance at the p=0.05 level.
GR - AR == 0 -0.3964 0.5159 -0.768 0.8640 IN - AR == 0 0.5651 0.7064 0.800 0.8493 RU - AR == 0 -1.1033 0.4386 -2.516 0.0548 IN - GR == 0 0.9615 0.7377 1.303 0.5505 RU - GR == 0 -0.7069 0.5236 -1.350 0.5206 RU - IN == 0 -1.6684 0.6300 -2.648 0.0382 * (Adjusted p values reported -- single-step method)
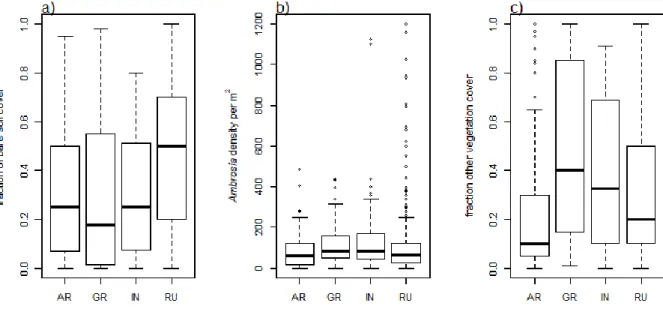
Fig. S2. Variation in a) bare soil cover, b) Ambrosia density, and c) cover by vegetation other than Ambrosia across habitat types (AR=arable, GR=grassland, IN=infrastructure, RU=ruderal). Boxplots represent variation across all plots of all sites per habitat type.