HAL Id: hal-03170774
https://hal.archives-ouvertes.fr/hal-03170774
Submitted on 16 Mar 2021
HAL is a multi-disciplinary open access
archive for the deposit and dissemination of
sci-entific research documents, whether they are
pub-lished or not. The documents may come from
teaching and research institutions in France or
abroad, or from public or private research centers.
L’archive ouverte pluridisciplinaire HAL, est
destinée au dépôt et à la diffusion de documents
scientifiques de niveau recherche, publiés ou non,
émanant des établissements d’enseignement et de
recherche français ou étrangers, des laboratoires
publics ou privés.
Distributed under a Creative Commons Attribution| 4.0 International License
Nhung Thi Phuong Phung, Chung Duc Mai, Giang Thi Hoang, Hue Thi Minh
Truong, Jérémy Lavarenne, Mathieu Gonin, Khanh Le Nguyen, Thuy Thi Ha,
Vinh Nang Do, Pascal Gantet, et al.
To cite this version:
Nhung Thi Phuong Phung, Chung Duc Mai, Giang Thi Hoang, Hue Thi Minh Truong, Jérémy
Lavarenne, et al.. Genome-wide association mapping for roottraits in a panel of rice accessions
fromVietnam. BMC Plant Biology, BioMed Central, 2016, 16, pp.64. �10.1186/s12870-016-0747-y�.
�hal-03170774�
R E S E A R C H A R T I C L E
Open Access
Genome-wide association mapping for root
traits in a panel of rice accessions from
Vietnam
Nhung Thi Phuong Phung
1, Chung Duc Mai
1,2, Giang Thi Hoang
1,2, Hue Thi Minh Truong
1,2, Jeremy Lavarenne
3,2,
Mathieu Gonin
3, Khanh Le Nguyen
2,3, Thuy Thi Ha
1, Vinh Nang Do
1, Pascal Gantet
2,3,4*and Brigitte Courtois
5Abstract
Background: Despite recent sequencing efforts, local genetic resources remain underexploited, even though they carry alleles that can bring agronomic benefits. Taking advantage of the recent genotyping with 22,000 single-nucleotide polymorphism markers of a core collection of 180 Vietnamese rice varieties originating from provinces from North to South Vietnam and from different agrosystems characterized by contrasted water regimes, we have performed a genome-wide association study for different root parameters. Roots contribute to water stress avoidance and are a still underexploited target for breeding purpose due to the difficulty to observe them.
Results: The panel of 180 rice varieties was phenotyped under greenhouse conditions for several root traits in an experimental design with 3 replicates. The phenotyping system consisted of long plastic bags that were filled with sand and supplemented with fertilizer. Root length, root mass in different layers, root thickness, and the number of crown roots, as well as several derived root parameters and shoot traits, were recorded. The results were submitted to association mapping using a mixed model involving structure and kinship to enable the identification of significant associations. The analyses were conducted successively on the whole panel and on its indica (115 accessions) and japonica (64 accessions) subcomponents. The two associations with the highest significance were for root thickness on chromosome 2 and for crown root number on chromosome 11. No common associations were detected between the indica and japonica subpanels, probably because of the polymorphism repartition between the subspecies. Based on orthology with Arabidopsis, the possible candidate genes underlying the quantitative trait loci are reviewed.
Conclusions: Some of the major quantitative trait loci we detected through this genome-wide association study contain promising candidate genes encoding regulatory elements of known key regulators of root formation and development. Keywords: Rice, Genotyping by sequencing, Root development, Association mapping, Structure
Background
Vietnam is a tropical country in Southeast Asia with a rice-based agricultural economy. Rice is grown on 82 % of the agricultural area, which corresponds to 7.75 M ha for a production of 43.6 million tons in 2012 [1]. Vietnam is the world’s second rice exporter (6.4 million tons in 2012). Rice is mainly grown under irrigated con-ditions in the river deltas, notably the Mekong delta in South Vietnam (52 % of Vietnam rice production) and
the Red River delta in North Vietnam (18 % of Vietnam rice production); however, because three-quarters of Vietnam’s territory is made up of mountainous and hilly regions, other ecosystems are also represented (upland, rainfed lowland and mangrove).
Vietnam is among countries most threatened by cli-mate change [2]. In particular, between spring and sum-mer, all of the central areas of Vietnam are subject to periods of recurrent and severe drought that affect rice plantlets just after planting or plants during grain filling and can result in important yield losses. To improve rice drought resistance, an ideotype with a large number of deep and thick roots and a high root-to-shoot ratio was
* Correspondence:pascal.gantet@univ-montp2.fr
4
Université de Montpellier, UMR DIADE, 34095 Montpellier, France Full list of author information is available at the end of the article
© 2016 Phung et al. Open Access This article is distributed under the terms of the Creative Commons Attribution 4.0 International License (http://creativecommons.org/licenses/by/4.0/), which permits unrestricted use, distribution, and reproduction in any medium, provided you give appropriate credit to the original author(s) and the source, provide a link to the Creative Commons license, and indicate if changes were made. The Creative Commons Public Domain Dedication waiver (http://creativecommons.org/publicdomain/zero/1.0/) applies to the data made available in this article, unless otherwise stated.
advocated, assuming that there was water at depth in the soil profile [3]. However, because roots develop underground and are not easily observed, this ideotype is difficult to select for. One way to achieve this goal would be to use indirect selection based on markers that are tightly linked to genes that control these root traits [4]. Knowledge of the genetic control of root develop-ment in rice is rapidly improving. Numerous root quan-titative trait loci (QTLs) have been detected in various mapping populations ([5] for a review). Three QTLs that are involved in water and nutrient uptake by roots have recently been cloned [6–8]. Furthermore, other QTLs have been finely mapped, and the underlying genes are close to being identified [9, 10]. The rice orthologs of several genes that were initially identified in Arabidopsis have also been shown to have an effect on root develop-ment in rice (reviewed in [11–14]). However, this useful information is still far from giving a clear overall pattern of the network of genes that are involved. Genome-wide association studies (GWAS) are a way to directly identify new candidate genes or, more reasonably, to narrow down the chromosomal segments that carry functional factors to much smaller intervals [15]. Because of the lower linkage disequilibrium (LD) that is encountered in natural populations, the resolution of QTL detection in such populations is higher than that obtained by clas-sical mapping populations of the same size. However, the corollary of this low LD is that the average distance between the markers that are used to genotype the population needs to be shorter than the LD decay dis-tance to properly cover the whole genome. Such high marker density has only become accessible, in most species, with the development of new sequencing tech-nologies, notably genotyping by sequencing (GBS). Genotyped panels representing a broad geographic di-versity have been developed [16, 17] and used in GWAS for root traits [17, 18]. However, although their size is on the order of 150 to 400 accessions, these panels still explore only a small fraction of the large rice diversity. Accessions from Vietnam are not widely represented in world-wide panels although local genetic resources, not-ably from geographically diverse countries, have been shown to bear unexploited but interesting variations for useful traits [19, 20]. Even among the 3000 rice genomes that were recently sequenced, only 55 Vietnamese acces-sions were included [21]. To take advantage of the allelic richness that can be encountered locally, we have devel-oped a panel that is exclusively composed of accessions from Vietnam (Additional file 1: Table S1). This panel of 182 accessions has been genotyped with approximately 22,000 single nucleotide polymorphisms (SNPs) using GBS, and its structure and the decay of LD have been analyzed in depth [22]. The panel is composed of two-thirds indica, one-third japonica and a few admixed
accessions. Several subpopulations (6 in the indica sub-panel and 4 in the japonica one) were detected within each subpanel. The average distances between poly-morphic markers are 18 kb, 28 kb and 44 kb, for the whole panel, the indica and the japonica subpanels, re-spectively. On average, the pairwise LD, measured by r2, reaches 0.52 and 0.71 at 25 kb in the indica and japonica subpanels, respectively, and decays faster to background levels in the indica subpanel (r2 < 0.2 at 100 kb) than in the japonica subpanel (r2 < 0.2 at 425 kb). Because the distance between markers is shorter than the LD decay, the marker coverage is sufficient to undertake GWAS in all panels. Because the accessions came from different ecosystems, ranging from upland to mangrove, that were subject to specific but severe stresses (e.g., drought for upland or rainfed lowland rice or salinity for irrigated or mangrove rice), this panel constitutes an excellent re-source for studying the genetic control of root system architecture and abiotic stress resistance.
In this paper, we performed an association study on root traits using our panel of Vietnamese varieties. Using a soil column system, different root parameters (max-imum root depth, root biomass in different soil layers, crown root number, and crown root thickness) were investigated. Several QTLs were detected in the indica and japonica subpanels or in the whole panel. Among these QTLs, one associated with crown root thickness on chromosome 2 and one associated with crown root number on chromosome 11 had the highest levels of significance. Results
Phenotyping
The results of the analysis of variance (ANOVA) are pre-sented in Table 1. The variety effect was highly signifi-cant for all of the traits. The broad-sense heritability of the traits, ranging from 0.65 to 0.90, was moderate to high, with the exception of two related traits (deepest point reached by roots (DEPTH) and maximum root length (MRL)) for which values of 0.35 and 0.46, respect-ively, were registered. The replication effect was often significant, and the block effect was almost always highly significant, indicating some internal heterogeneity within replicates that the design helped to control. This envir-onmental heterogeneity may be due to slight differences in light intensity due to the shade from neighbor trees and to the disposition of the blocks in the screenhouse, some peripheral, some central. The accession means were therefore adjusted from block effects. The mean, standard deviation, range and coefficient of variation (CV) of the whole panel are presented in Additional file 2: Table S2. A graphical representation of the plant architecture of each accession is shown in Additional file 3: Figure S1. A moderate to large variation was observed for most of the traits, as seen through the CVs of the
panel varying from 20 % to 63 %, with the exception of longest leaf length (LLGHT), DEPTH, MRL, root thick-ness (THK) and shallow root proportion (SRP) whose CVs were less than 20 %. The same elements for the indica and japonica subpanels are presented in Table 2. For most of the shoot and root biomass traits, including deep root traits (shoot dry weight (SDW), MRL, root mass in the 00–20 cm segment (DW0020), root mass in the 20–40 cm segment (DW2040), root mass in the 40– 60 cm segment (DW4060), root mass below 60 cm (DWB60), root dry weight (RDW), deep root mass (<40 cm) weight (DRW) and plant dry weight (PDW)), the mean values of the indica accessions were higher than those of the japonica accessions. The indica acces-sions had on average a much larger biomass, shorter leaves, more tillers and many more crown roots but had thinner roots and fewer resources allocated to roots, notably to deep roots (lower root to shoot ratio (R_S) and slightly lower deep root proportion (<40 cm) (DRP)). However, the trait distributions (Fig. 1) showed that the range of variation of the indica and japonica accessions was largely overlapping. To confirm these re-sults and assess to what extent the observed phenotypic
variability was determined by the genetic structure, a mean comparison was conducted between groups within the whole panel and between subpopulations within each subpanel for the genotyped accessions (Additional file 4: Table S3). For the majority of the traits except for DEPTH, MRL, DWB60, SRP, DRP and R_S, the pheno-typic differences between the indica and japonica sub-panels within the whole panel were highly significant. There were also difference between subpopulations within each subpanel for most of the traits except for DEPTH for the indica subpanel, number of tillers (TIL), SDW, number of crown root per tiller (NR_T) and PDW for the japonica subpanel and DW0020 for both subpanels. The percentage of phenotypic variance that was explained by the panel structure, which provides an alternate estimate of the relationships between genetic structure and phenotype for a given trait, gave similar results, with high percentages generally associated with the highest within-subpanel phenotypic differentiation (Additional file 4: Table S3). The mean comparisons showed that subpopulations I3 and, to a lesser extent, I6 in the indica subpanel and subpopulations J1 and J3 in the japonica subpanel had the deepest and thickest roots while subpopulations I1 and I5 as well as J2 and J4 regis-tered the poorest performances in this respect.
The correlation coefficients among traits were highly significant and similar in direction within the whole panel and the two subpanels (Additional file 5: Table S4). The magnitude of the differences between the indica and japonica subpanels varied from trait to trait but was generally small, except for combinations involving num-ber of crown roots (NRC). The high positive correlations between root dry masses in different layers (greater than 0.8; data not shown) were derived from their pyramidal relationships. NCR was highly correlated with TIL (0.72 in the whole panel), as expected because the root and tiller emissions are synchronized in rice. To determine whether it was possible to disentangle these two traits, the NR/T ratio was calculated. TIL, NCR and NR/T were not correlated with the root depth (whether MRL or LENGTH).
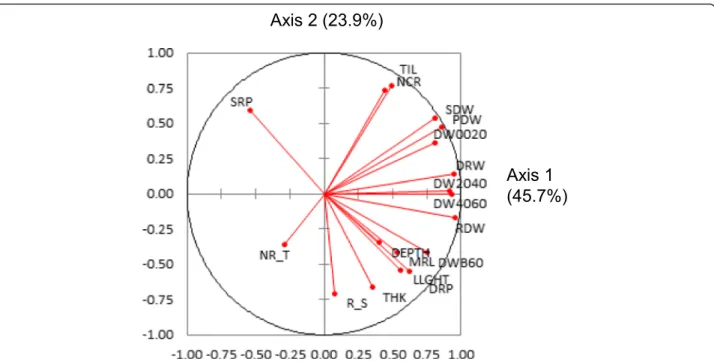
A principal components analysis (PCA) was run on the adjusted means of all of the accessions. Together, the two first axes of the PCA explained 69.6 % of the vari-ation. As shown by the circle of correlations (Fig. 2), almost all traits, with the exception of SRP and NR_T, which are ratios, were positively correlated with axis 1. Axis 1 can be viewed as an axis of increasing vigor opposing small and large plants when examining the ac-cession positions on the first plane (Fig. 3). R_S was the only trait not correlated to axis 1. The second axis was characterized by an opposition between TIL, NCR, PDW, SDW, SRP and DW0020, corresponding to superficial bio-mass, and DEPTH, MRL, DRP and DWB60, corresponding
Table 1 Result of the analysis of variance and trait broad sense heritability
Trait Rep Block(Rep) Variety h2
LLGHT <0.001 < 0.001 < 0.001 0.90 TIL < 0.001 0.0009 < 0.001 0.80 SDW 0.0043 < 0.0001 < 0.0001 0.73 DEPTH 0.0254 0.0003 0.0002 0.35 MRL 0.1428 0.0277 0.0001 0.46 NCR 0.2270 < 0.0001 < 0.0001 0.84 NR_T <0.001 0.3450 < 0.0001 0.72 THK 0.0071 0.0017 < 0.0001 0.84 DW0020 0.0546 < 0.0001 < 0.0001 0.74 DW2040 0.1605 < 0.0001 < 0.0001 0.68 DW4060 0.4307 < 0.001 < 0.0001 0.69 DWB60 0.0260 0.0047 < 0.0001 0.70 DRW 0.0863 0.0004 < 0.0001 0.75 RDW 0.0650 < 0.0001 < 0.0001 0.75 PDW 0.0364 < 0.0001 < 0.0001 0.73 SRP 0.0207 0.0002 < 0.0001 0.72 DRP 0.0179 0.0045 < 0.0001 0.65 R_S < 0.0001 < 0.0001 < 0.0001 0.75
Rep replication, LLGTH longest leaf length, TIL number of tillers, SDW shoot dry weight, DEPTH deepest point reached by roots, MRL maximum root length, NCR number of crown roots, NR_T number of crown root per tiller, THK root thickness, DW0020 root mass in the 00–20 cm segment, DW2040 root mass in the 20–40 cm segment, DW4060 root mass in the 40–60 cm segment, DWB60 root mass below 60 cm, DRW deep root mass (<40 cm) weight, RDW root dry weight, PDW plant dry weight, SRP shallow root proportion (0–20 cm), DRP deep root proportion (<40 cm), R_S root to shoot ratio
to root biomass in the deepest layer. Root biomass in the intermediate layers (DW2040 and DW4060) was not corre-lated to axis 2. R_S, THK and LLGTH were also strongly correlated to axis 2, indicating that deep rooted varieties had also thick roots, long leaves and a high root to shoot ratio, all features that are characteristics of the tropical japonica group. The distribution of the accessions on the first plane (Fig. 3) confirmed these interpretations. The two top and the bottom-right quadrants were mostly occupied by indica accessions (in red), while japonica accessions (in blue) were mostly found in the lower-left quadrant, show-ing a much clearer separation than when considershow-ing each trait separately. However, the indica and japonica clouds overlapped to some extent, and some indica accessions were found in the middle of the japonica accessions and vice versa. When repeated for the indica and japonica panels separately, the patterns were highly similar to that of the whole panel (data not shown).
Association mapping
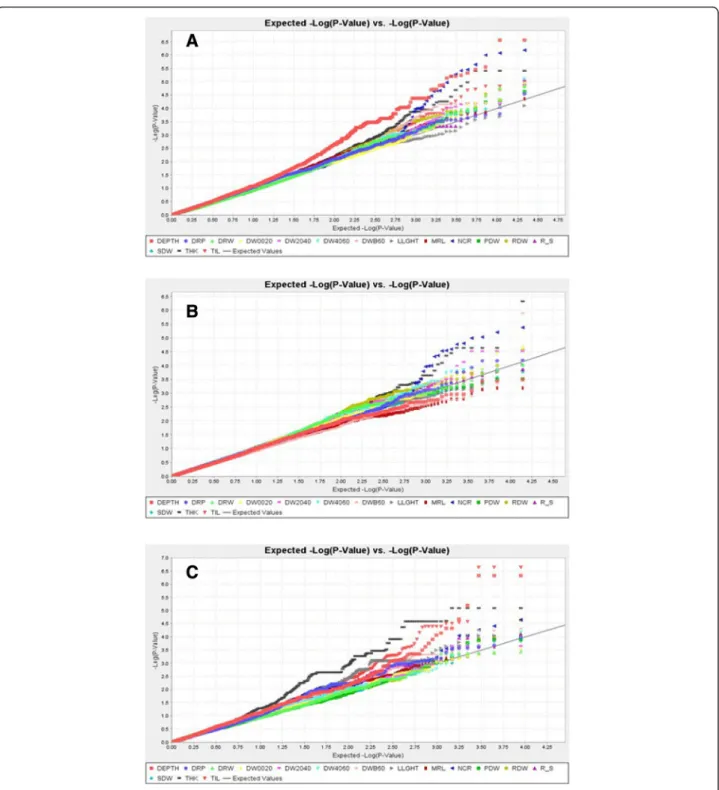
We performed successive association mappings for the whole panel and then separately for the indica and japonica subpanels. The mixed model that included both the structure and kinship matrices exerted good control over false positive rates for most traits as shown by the
quantile-quantile plots for the whole set of accessions, the indica set and the japonica set, respectively (Fig. 4a to c). On these graphs, for most traits, the cumulative distribution of observed P-values fitted well with the ex-pected uniform distribution that was represented by the diagonal, at least for the smallest log (P-values). There were two exceptions, DEPTH for the whole panel and THK for the japonica subpanel, for which the curves moved away from the diagonal. The inflation factor lambda was computed to quantitatively assess the extent of these deviations. Lambda was in the range of 0.95 to 1.07 for all traits except these two (1.25 for DEPTH in the whole panel and 1.50 for THK in the japonica sub-panel, respectively). For these two trait x panel combina-tions, a larger number of false positives is expected compared with other combinations.
In the whole panel, and the indica and japonica sub-panels, 66, 20 and 26 markers, respectively, were signifi-cant at P≤ 1e-04 (Table 3). The higher number of QTLs that were detected in the whole panel is most likely the result of its larger size. The most significant associa-tions were recorded for DEPTH on chromosome 1 (q17; P = 2.67e-07) and NCR on chromosome 11 (q45; P= 6.59e-07) for the whole panel, THK on chromosome 2 (q57; P = 4.77e-07) for the indica subpanel, and TIL
Table 2 Adjusted mean, standard deviation (sd), range, and coefficient of variation (CV) of the indica (ind) and japonica (jap) sub-panels for all traits
Traits N N Mean sd Min Max CV Mean sd Min Max CV
ind jap ind ind ind ind ind jap jap jap jap jap
LLGHT (cm) 121 66 93.3 12.8 63.9 116.4 13.7 97.7 11.9 67.3 125.0 12.2 TIL 121 66 9.18 3.62 1.61 20.75 39.5 4.27 1.51 1.69 10.83 35.6 SDW (g) 121 66 6.540 2.058 2.230 13.67 31.5 4.074 1.138 1.283 7.785 27.9 DEPTH (cm) 121 66 69.0 3.9 58.8 76.8 5.6 69.4 4.4 53.4 76.10 6.4 MRL (cm) 121 66 86.2 5.8 69.6 99.4 6.7 85.3 6.2 70.3 97.18 7.2 NCR 121 66 105.6 25.1 42.8 176.8 23.7 64.9 18.4 32.5 119.1 28.3 NR_T 121 66 13.6 4.2 5.5 26.9 30.9 16.1 4.3 7.8 34.9 26.8 THK (mm) 121 66 0.747 0.096 0.488 0.986 12.9 0.815 0.107 0.568 0.999 13.1 DW0020 (g) 121 66 0.991 0.267 0.410 1.785 26.9 0.682 0.177 0.313 1.290 26.0 DW2040 (g) 121 66 0.500 0.177 0.129 1.025 35.4 0.371 0.122 0.128 0.686 32.9 DW4060 (g) 121 66 0.237 0.104 0.034 0.549 43.9 0.156 0.069 0.035 0.349 44.2 DWB60 (g) 121 66 0.102 0.065 0.009 0.364 64.1 0.087 0.051 −0.005 0.197 58.2 DRW (g) 121 66 0.339 0.154 0.059 0.780 45.3 0.243 0.108 0.031 0.464 44.6 RDW (g) 121 66 1.830 0.549 0.714 3.164 30.0 1.295 0.369 0.472 2.284 28.4 PDW (g) 121 66 8.360 2.493 3.033 16.81 29.8 5.370 1.440 1.936 10.06 26.8 SRP (%) 121 66 55.5 6.6 42.7 83.1 11.9 53.4 6.5 37.7 67.4 12.2 DRP (%) 121 66 17.8 4.4 4.5 29.3 24.6 18.2 4.9 9.1 28.4 26.7 R_S 121 66 0.294 0.061 0.170 0.497 20.7 0.329 0.061 0.212 0.459 18.5
LLGTH longest leaf length, TIL number of tillers, SDW shoot dry weight, DEPTH deepest point reached by roots, MRL maximum root length, NCR number of crown roots, NR_T number of crown root per tiller, THK root thickness, DW0020 root mass in the 00–20 cm segment, DW2040 root mass in the 20–40 cm segment, DW4060 root mass in the 40–60 cm segment, DWB60 root mass below 60 cm, DRW deep root mass (<40 cm) weight, RDW root dry weight, PDW plant dry weight, SRP shallow root proportion (0–20 cm), DRP deep root proportion (<40 cm), R_S root to shoot ratio
Fig. 1 Frequency of distribution per subpanel for selected traits. In blue japonica subpanel; in red indica subpanel. TIL = number of tillers; SDW = shoot dry weight; MRL = maximum root length; NCR = number of crown roots; THK = root thickness; RDW = root dry weight; DRP = deep root proportion; R_S = root to shoot ratio
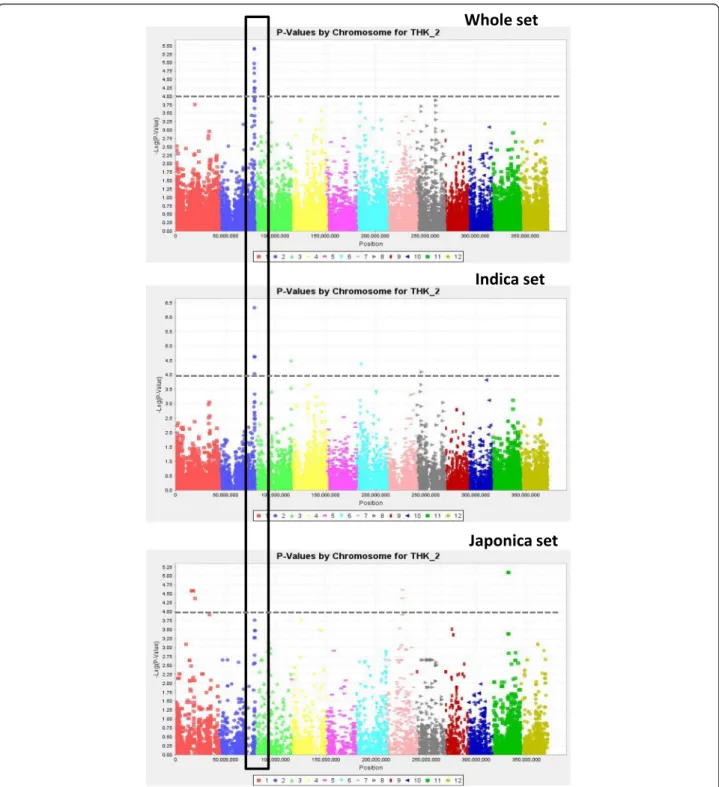
on chromosome 1 (q4; P = 2.28e-07) and DEPTH on chromosome 6 (q22; P = 4.75e-07) for the japonica sub-panel. These P-values all corresponded to q-values less than 0.05. The Manhattan plots of THK and NCR, chosen as examples, are represented by the three panels superimposed in Figs. 5 and 6, respectively. In a few cases, several physically close but not always adjacent markers showed the exact same level of significance. After verification, these markers appeared to be in full
LD. In such cases, the extreme markers are given as an interval (Site1-Site2) in Table 3. Most of these intervals were small (on the order of 1 to 200 kb), but in at least one case (q76) on chromosome 6, the interval covered 2.5 Mb. In another case, for NR_T with the japonica panel, significant markers belonging to different chro-mosomes were in full LD. This situation involved 89 markers distributed across chromosomes 2, 3, 6, 7, 8 and 12. The corresponding QTL was not kept in the
Fig. 2 Circle of correlations for a PCA conducted on the whole panel and 18 traits. LLGTH = longest leaf length; TIL = number of tillers; SDW = shoot dry weight; DEPTH = deepest point reached by roots; MRL = maximum root length; NCR = number of crown roots; NR_T = number of crown root per tiller; THK = root thickness; DW0020 = root mass in the 00-20 cm segment; DW2040 = root mass in the 20-40 cm segment; DW4060 = root mass in the 40-60 cm segment; DWB60 = root mass below 60 cm; DRW = deep root mass (<40 cm) weight; RDW = root dry weight; PDW = plant dry weight, SRP = shallow root proportion (0–20 cm); DRP = deep root proportion (<40 cm); R_S = root to shoot ratio
Fig. 3 Scatterplot of the accessions of the whole panel based on a PCA on the phenotypic data (18 traits). Indica in red; japonica in blue; check in pink; intermediates in black. Axis 1 and axis 2 explains 45.7 % and 23.9 % of the variation respectively
results table because it was not possible to unambigu-ously attribute it to a chromosome. Some of the QTLs were common between the whole panel and the two sub-panels, more so for the indica subpanel (7 occurrences),
which represents 2/3 of the whole panel accessions, than for the japonica subpanel (2 occurrences) at P < 1e-04. These numbers increased to 34 and 13, respectively, when decreasing the threshold to P <1e-03 for the significant
Fig. 4 Quantile-quantile plots for the whole panel (a), the indica (b) and the japonica (c) subpopulations. The different traits are represented by different colors. The black diagonal represents the uniform law. LLGTH = longest leaf length; TIL = number of tillers; SDW = shoot dry weight; DEPTH = deepest point reached by roots; MRL = maximum root length; NCR = number of crown roots; NR_T = number of crown root per tiller; THK = root thickness; DW0020 = root mass in the 00–20 cm segment; DW2040 = root mass in the 20–40 cm segment; DW4060 = root mass in the 40–60 cm segment; DWB60 = root mass below 60 cm; DRW = deep root mass (<40 cm) weight; RDW = root dry weight; PDW = plant dry weight, SRP = shallow root proportion (0–20 cm); DRP = deep root proportion (<40 cm); R_S = root to shoot ratio
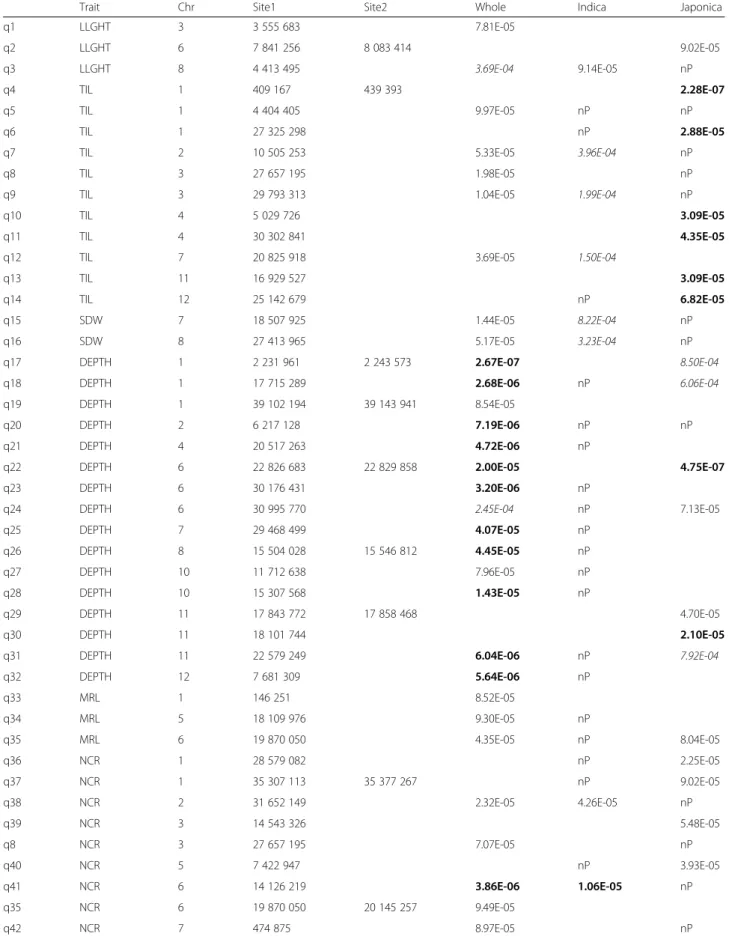
Table 3 P-values of the QTLs detected as significant at P < 1e-04 for the whole panel, the indica and japonica subpanels
Trait Chr Site1 Site2 Whole Indica Japonica
q1 LLGHT 3 3 555 683 7.81E-05 q2 LLGHT 6 7 841 256 8 083 414 9.02E-05 q3 LLGHT 8 4 413 495 3.69E-04 9.14E-05 nP q4 TIL 1 409 167 439 393 2.28E-07 q5 TIL 1 4 404 405 9.97E-05 nP nP q6 TIL 1 27 325 298 nP 2.88E-05
q7 TIL 2 10 505 253 5.33E-05 3.96E-04 nP
q8 TIL 3 27 657 195 1.98E-05 nP
q9 TIL 3 29 793 313 1.04E-05 1.99E-04 nP
q10 TIL 4 5 029 726 3.09E-05
q11 TIL 4 30 302 841 4.35E-05
q12 TIL 7 20 825 918 3.69E-05 1.50E-04
q13 TIL 11 16 929 527 3.09E-05
q14 TIL 12 25 142 679 nP 6.82E-05
q15 SDW 7 18 507 925 1.44E-05 8.22E-04 nP
q16 SDW 8 27 413 965 5.17E-05 3.23E-04 nP
q17 DEPTH 1 2 231 961 2 243 573 2.67E-07 8.50E-04
q18 DEPTH 1 17 715 289 2.68E-06 nP 6.06E-04
q19 DEPTH 1 39 102 194 39 143 941 8.54E-05
q20 DEPTH 2 6 217 128 7.19E-06 nP nP
q21 DEPTH 4 20 517 263 4.72E-06 nP
q22 DEPTH 6 22 826 683 22 829 858 2.00E-05 4.75E-07
q23 DEPTH 6 30 176 431 3.20E-06 nP
q24 DEPTH 6 30 995 770 2.45E-04 nP 7.13E-05
q25 DEPTH 7 29 468 499 4.07E-05 nP q26 DEPTH 8 15 504 028 15 546 812 4.45E-05 nP q27 DEPTH 10 11 712 638 7.96E-05 nP q28 DEPTH 10 15 307 568 1.43E-05 nP q29 DEPTH 11 17 843 772 17 858 468 4.70E-05 q30 DEPTH 11 18 101 744 2.10E-05
q31 DEPTH 11 22 579 249 6.04E-06 nP 7.92E-04
q32 DEPTH 12 7 681 309 5.64E-06 nP q33 MRL 1 146 251 8.52E-05 q34 MRL 5 18 109 976 9.30E-05 nP q35 MRL 6 19 870 050 4.35E-05 nP 8.04E-05 q36 NCR 1 28 579 082 nP 2.25E-05 q37 NCR 1 35 307 113 35 377 267 nP 9.02E-05 q38 NCR 2 31 652 149 2.32E-05 4.26E-05 nP q39 NCR 3 14 543 326 5.48E-05 q8 NCR 3 27 657 195 7.07E-05 nP q40 NCR 5 7 422 947 nP 3.93E-05 q41 NCR 6 14 126 219 3.86E-06 1.06E-05 nP q35 NCR 6 19 870 050 20 145 257 9.49E-05 q42 NCR 7 474 875 8.97E-05 nP
Table 3 P-values of the QTLs detected as significant at P < 1e-04 for the whole panel, the indica and japonica subpanels (Continued) q43 NCR 11 5 272 788 3.38E-05 1.12E-04 nP q44 NCR 11 7 927 995 2.17E-05 1.66E-04 nP q45 NCR 11 8 972 097 6.59E-07 4.40E-06 nP q46 NCR 11 16 559 637 6.19E-06 nP nP q47 NCR 12 1 323 261 5.07E-05 8.00E-04 nP q48 NR_T 1 2 710 978 2 880 907 4.84E-05 q49 NR_T 1 10 299 033 2.11E-05 nP q50 NR_T 1 42 706 214 1.83E-05 q51 NR_T 5 16 205 923 16 458 100 2.71E-05 4.37E-04 q52 NR_T 7 17 207 987 4.25E-05 nP q53 NR_T 7 22 174 085 22 175 036 5.91E-05 nP q54 NR_T 12 27 338 111 5.54E-05 nP nP q55 THK 1 15 990 976 17 419 950 2.62E-05 q56 THK 1 19 286 868 1.75E-04 4.28E-05 q57 THK 2 35 453 974 4.77E-07 q58 THK 2 35 509 414 35 510 032 3.96E-06 5.41E-04 q59 THK 3 36 156 421 3.27E-05 nP q60 THK 6 4 649 357 1.73E-04 4.41E-05 nP q61 THK 7 15 424 576 2.46E-05 q62 THK 8 4 544 057 8.10E-05 nP q63 THK 11 17 111 220 17 318 688 nP 8.14E-06 q64 DW0020 2 25 990 556 1.10E-05 2.20E-05 nP q65 DW0020 4 30 438 406 9.37E-04 3.56E-05 q41 DW0020 6 14 126 219 4.88E-05 1.46E-04 nP q45 DW0020 11 8 972 097 9 004 279 6.39E-05 2.16E-04 nP q66 DW2040 2 5 015 093 6.98E-05 2.88E-04 nP q67 DW2040 6 4 021 017 1.25E-05 1.01E-04 nP q68 DW2040 6 17 005 559 17 036 530 6.29E-05 2.85E-05 nP q45 DW2040 11 8 972 097 9 004 279 6.74E-05 4.51E-04 nP q69 DW4060 6 4 127 010 8.00E-06 1.03E-04 q70 DW4060 10 11 589 746 nP 6.75E-05 q71 DW4060 12 1 185 335 8.73E-05 3.23E-04 nP q33 DWB60 1 146 251 1.94E-05 q72 DWB60 1 2 678 840 4.85E-05 q73 DWB60 1 5 851 606 1.87E-04 1.33E-06 q74 DWB60 2 23 550 168 1.38E-05 nP q75 DWB60 2 30 762 847 9.74E-05 4.83E-04 nP q76 DWB60 6 14 008 461 16 515 631 6.55E-05 q77 DWB60 6 16 798 522 3.49E-05 q73 DRW 1 5 851 606 2.56E-04 2.82E-05 q78 DRW 2 14 366 103 9.79E-05 q69 DRW 6 4 127 010 2.92E-05 9.76E-05 q79 DRW 6 16 912 708 1.44E-05 q70 DRW 10 11 589 746 8.85E-04 nP 2.31E-05 q69 RDW 6 4 127 010 3.25E-05 4.37E-04
markers (in italics in Table 3). Surprisingly, no association shared by the indica and japonica panels was detected, but half of the markers that were significant in one subpanel were monomorphic (Minor Allele Frequency (MAF) below 5 %) in the other and, were therefore, not tested (noted as nP in Table 3). In all three panels, the number of significant markers varied from trait to trait, but the range of variation was higher for the whole panel (from 1 to 14). The number of associations was greater than 5 for DEPTH (14 associations) and NCR (10 associations) in the whole panel, and for TIL (6 associations) in the japon-ica panel. For the remaining traits, this number was equal to or less than 5. Some of the significant markers were as-sociated with several traits as shown in Table 4. Taking the markers that were common between panels or be-tween traits as a single QTL, a total of 88 different sites or segments were significant at P < 1e-04 in this study.
Function of genes that were linked to significant markers
Among the 88 different sites identified, 33 were in genes with predicted functions. Given the level of LD in the panel, the genes that were within an interval of +/-25 kb on both sides of the significant markers were also sur-veyed using the query tools of OrygenesDB [23] to retrieve 889 additional genes, of which 407 had pre-dicted functions (Additional file 6: Table S5). This list of QTL-associated genes was first compared to the list of approximately 200 genes that were recorded in EURoot database [24] that are known, mostly via mutant ana-lysis, to play roles in rice root architecture, root development or water and nutrient transport. No
correspondence was found except for PLASMA
MEMBRANE INTRINSIC PROTEIN 2;1 (OsPIP2;1)
gene located 16 kb from q61 on chromosome 7, which was significant for THK in the japonica panel (Table 5). The list of QTL-associated genes was simi-larly compared with a list of genes that are
specific-ally expressed during crown root formation or
development [25, 26]. Eleven of the QTL-associated genes corresponded to genes that are specifically expressed in different zones of the crown root such as the root cap, the lateral root differentiation zone and the mature zone (Table 5). Most of these genes had a predicted biochemical function, but no precise information could be found regarding their biological functions. Selecting only those genes associated with root trait QTLs, the literature was then scanned to determine whether information about their biological function or that of their predicted Arabidopsis ortho-log(s) was available. This approach revealed 13 add-itional interesting candidate genes, which are also listed in Table 5.
Discussion and conclusions
We have phenotyped the root traits of a panel of 182 Vietnamese varieties in a soil-based phenotyping system to analyze the genetic control of root architecture.
The phenotypic variation of the panel was analyzed at the light of its genetic structure for GWAS purpose. The japonica subpanel showed on average poor performance, with lower mean values than the indica subpanel for deep root traits and biomasses. However, the analysis
Table 3 P-values of the QTLs detected as significant at P < 1e-04 for the whole panel, the indica and japonica subpanels (Continued)
q44 RDW 6 14 126 219 9.79E-05 3.36E-04 nP q45 RDW 11 8 972 097 9 004 279 1.48E-05 9.22E-05 nP q15 PDW 7 18 507 925 2.39E-05 9.05E-04 nP q45 PDW 11 8 972 097 9 004 279 4.97E-05 3.07E-04 nP q80 SRP 4 13 232 104 4.12E-05 nP nP q81 SRP 6 1 901 540 1 930 717 3.11E-05 q82 SRP 6 21 716 314 21 716 317 6.59E-05 q83 DRP 1 2 173 691 2.64E-05 2.95E-04 q84 DRP 1 6 404 307 8.46E-04 5.93E-05 q85 DRP 4 4 170 196 6.71E-05 q82 DRP 6 21 716 314 6.28E-05 q86 R_S 6 4 601 154 8.15E-06 6.90E-04 q87 R_S 6 9 185 455 8.91E-05 3.32E-04 q88 R_S 6 24 668 182 2.20E-04 nP 8.14E-05
The P-value of the test in the three panels up to P = 1e-03 is given in italics. In bold, QTLs with q-values < 0.05
Chr chromosome, nP not polymorphic in the sub-panel (monomorphic or MAF < 5 %), LLGTH longest leaf length, TIL number of tillers, SDW shoot dry weight, DEPTH deepest point reached by roots, MRL maximum root length, NCR number of crown roots, NR_T number of crown root per tiller, THK root thickness, DW0020 root mass in the 00–20 cm segment, DW2040 root mass in the 20–40 cm segment; DW4060 root mass in the 40–60 cm segment, DWB60 root mass below 60 cm, DRW deep root mass (<40 cm) weight, RDW root dry weight, PDW plant dry weight, SRP shallow root proportion (0–20 cm), DRP deep root proportion (<40 cm), R_S root to shoot ratio
per sub-population shows that the overall subpanel per-formance masked important differences between sub-populations. These differences seem to be mostly related to ecosystem adaptation and risks of drought, as also shown by Lafitte et al. [26] with a sample of varieties originating from across Asia. This is true for the japonica subpanel, for which subpopulations J1 and J3, with the deepest and thickest roots, include
mostly upland rice varieties, while subpopulations J2 and J4, with thin and shallow roots, correspond to ir-rigated and mangrove rice varieties, respectively [22]. More surprisingly, the same is also true for the indica subpanel: the two best subpopulations (I3 and I6) are almost exclusively composed of upland accessions (I3) and from a mixture of upland and rainfed lowland acces-sions (I6), whereas the two subpopulations (I1 and I4)
with the poorest performance originated from irrigated ecosystems [22]. The indica types from group I3 consti-tute interesting donors of deep and thick roots that may be easier to use as parents in crosses with other indica vaccessions than the upland japonica accessions, by redu-cing the risks of F1 inter subspecies sterility. The global
organization of root variability in this panel highlights the need to control population structure and, because the
panel phenotypic differences partly overlapped with the genetic structure for some of the traits, to perform indi-vidual analyses of each subpanel rather than only perform-ing an analysis of the whole panel.
In this study, we detected QTLs for all the examined traits. Their number is generally limited, but some QTLs show both good P-values (P < 1e-06) and q-values (q < 0.05) and seem to merit further research, particularly the
q33 1 146 251 3 * * (*) q83 1 2 173 691 2 (*) * q66 2 5 015 093 2 * (*) q8 3 27 657 195 2 * * q67 6 4 021 017 4 * (*) (*) (*) q24 6 4 127 010 5 (*) (*) ** * * q76 6 14 008 461 6 ** * * (*) * (*) q79 6 16 912 708 3 (*) * (*) q15 7 18 507 925 3 (*) * * q16 8 27 413 965 2 * (*) q43 11 5 272 788 2 * (*) q45 11 8 972 097 9 (*) *** * * (*) * (*) * * q31 11 22 579 249 2 ** (*) q32 12 7 681 309 2 ** (*) B. Indica subpanel q73 1 5 851 606 3 (*) ** * q84 1 6 404 307 2 * (*) * q65 4 30 438 406 2 * (*) q69 6 4 127 010 3 (*) * (*) q41 6 14 126 219 3 * (*) (*) q68 6 17 005 559 3 * (*) (*) q82 6 21 716 314 2 * * q3 8 4 413 495 2 * (*) q45 11 8 972 097 6 ** (*) (*) (*) * (*) C. Japonicasubpanel q72 1 2 678 840 2 * (*) q48 1 2 710 978 2 * q40 5 7 422 947 2 (*) * q70 10 11 589 746 3 * * (*)
A whole panel; B indica subpanel; C japonica subpanel
Chr chromosome, Nb ass. number of associations, LLGTH longest leaf length, TIL number of tillers, SDW shoot dry weight, DEPTH deepest point reached by roots, MRL maximum root length, NCR number of crown roots, NR_T number of crown root per tiller, THK root thickness, DW0020 root mass in the 00–20 cm segment, DW2040 root mass in the 20–40 cm segment, DW4060 root mass in the 40–60 cm segment, DWB60 root mass below 60 cm, DRW deep root mass (<40 cm) weight, RDW root dry weight, PDW plant dry weight, SRP shallow root proportion (0–20 cm), DRP deep root proportion (<40 cm), R_S root to shoot ratio (*): P < 1e-03; *: P < 1e-04; **: P < 1e-05; ***: P < 1e-06
BMC Plant Biology (2016) 16:64 Page 13 of 19
QTL for THK on chromosome 2 and for NCR on chromosome 11.
We found some significant markers located on differ-ent chromosomes but in full LD. In such situation, it is impossible to know where the functional mutation is located. This situation of full LD between markers far apart or on different chromosomes is probably much more frequent than was observed in our study but is difficult to detect for non-significant markers and gener-ally goes unnoticed. The risk of such situations is likely higher when the panel size is low, as is the case here for the japonica subpanel.
Generally, the markers that were significant for a given trait in the whole panel were also significant for the same trait in the indica or the japonica panel, al-beit with lower levels of significance. However, we found ten markers significant in the whole panel but
not significant in any of the two subpanels. We did not find any markers associated with the same traits in both the indica and japonica subpanels. These dif-ferences in associations detected between panels may be partly due to the limited size of the subpanels, notably of the japonica subpanel, which limits our detection power. A panel size below 100 accessions is considered as sub-optimal for association detection, notably for low MAF markers [15]. However, as shown in the example of Zhao et al. [27] with subpanel sizes (57 to 97 accessions) similar to that of our japonica subpanel, significant associations can still be detected when the marker effects are large. The differences in associations detected between panels may also partly result from the large variation in allelic frequencies in the different panels observed for many markers. These variations themselves result from the strong bipolar organization of the genetic diversity in rice
Table 5 List of candidate genes close to the significant markers determined based on function or expression pattern
QTL ID
Chr Position of QTL Trait(s) Gene in rice Gene in Arabidopsis
Function References
q48 1 2710978-2880907 NR_T Os01g05820 no Specifically expressed in lateral root initiation zone [25] q48 1 2710978-2880907 NR_T Os01g06010 no Specifically expressed in lateral root initiation zone [25]
q48 1 2710978-2880907 NR_T Os01g06060 no Specifically expressed in root cap [25]
q73 1 5851606 DWB60,
DRW
Os01g10900 At04g18640 Arabidopsis MRH1, root hair development [44]
q73 1 5851606 DWB60,
DRW
Os01g11010 no Specifically expressed in lateral root initiation zone [25]
q84 1 6404307 DRP Os01g11860 no Specifically expressed in root cap [25]
q49 1 10299033 NR_T Os01g18360 no OsIAA4, crown roots formation in response to auxin [34] q36 1 28579082 NCR Os01g49690 At01g50370 Arabidopsis FYPP1, post transductional, PIN protein
regulation
[32]
q50 1 42706214 NR_T Os01g73700 no Specifically expressed in root cap [25]
q50 1 42706214 NR_T Os01g73720 no Specifically expressed in root cap [25]
q66 2 5015093 DW2040 Os02g09760 no Specifically expressed in root cap [25]
q64 2 25990556 DW0020 Os02g43
120
no Specifically expressed in root cap [25]
q74 2 30762847 DWB60 Os02g50372 no Candidate gene for a root mass at depth QTL [45] q38 2 31652149 NCR Os02g51710 At04g39730 Arabidopsis PLAT1, regulation of lateral root
development
[41]
q59 3 35166421 THK Os03g63970 At05g51810 OsGA20ox1, underlies a QTLs for early vigor [47] q51 5
16205923-16458100
NR_T Os05g27920 At05g58440 Arabidopsis SNX2, endocellular transport of PIN2 [33]
q60 6 4 649 357 THK Os06g09280 At01g26370 Arabidopsis RID1, root development [46]
q76 6 15 865 171 DWB60 Os06g27980 At03g05390 Specifically expressed in root cap [25]
q42 7 474 875 NCR Os07g01820 no OsMADS15, crown roots development [39,40]
q61 7 15 424 576 THK Os07g26740 no OsRR7, cytokinin signaling [49,57]
q61 7 15 424 576 THK Os07g26740 no Specifically expressed in lateral root initiation zone [25] q53 7
22174085-22175036
NR_T Os07g37010 At04g03270 Arabidopsis CYCLIN D6;1 lateral root initiation [38]
q71 12 1 185 335 DW4060 Os12g03110 no Arabidopsis MIF1, root development [43]
due to the independent domestications of indica and japonica subspecies followed by limited introgressions from one subspecies to the other, mainly in areas of low divergence [28, 29]. This second possibility is supported by the reduction of the set of polymorphic markers (MAF greater than 5 %) from 21,623 in the whole panel to 13,814 in the indica subpanel and 8821 in the japonica subpanel. Many of the markers that were polymorphic in one subpanel were considered monomorphic (MAF below 5 %) in the other. Only 20.1 % of the 21,623 initial markers were polymorphic in both subpanels, while 15.4 % were monomorphic in both but with different alleles (markers discriminating indica from japonica accessions).
When comparing the significant associations identified in this study with those identified by [17] for similar root traits in a japonica panel with no common accessions except the checks, we found one case of co-localization (d <50 bp). A marker that was significantly associated with NR_T in our study (q50 at position 42.706 Mb on chr 1) was associated with R_S in their study. These authors did not measure NR_T. However, we cannot ex-clude that this co-localization occurred by chance be-cause the same marker is very far from the threshold of significance for R_S in any panel in our study.
We assessed the function of the genes in which or near which significant markers were located. OsPIP2;1 (Os07g26690), at 16 kb of q61, is more specifically expressed in the root exodermis and up-regulated specif-ically in roots of upland varieties after osmotic stress treatment [30, 31]. However, the three markers that were found between the QTL and the gene showed a decreas-ing level of significance when approachdecreas-ing the gene, and it is difficult to establish a link between the function of this protein and the phenotype (THK) that is associated with the related QTL.
The literature searches for the biological functions of the QTL-associated genes and their predicted Ara-bidopsis ortholog(s) led to interesting candidates. For example, crown root initiation and development in rice are known to involve local auxin flux regulation by the relocation of PIN-FORMED (PIN) auxin efflux proteins, resulting in the activation by auxin of the gene encoding the LATERAL ORGAN BOUNDARY DOMAIN (LBD) transcription factor CROWN ROOT LESS 1 (CRL1) [11, 13, 14, 32]. Some genes that are in-volved in this regulatory pathway were included in the con-fidence interval of QTLs that were related to NCR or NR_T. Os01g49690 (NCR, q36) is an ortholog of Arabidop-sis PHYTOCHROME-ASSOCIATED SERINE/THREONINE
PROTEINPHOSPHATASE1 (FYPP1). The Fypp1; Fypp2
double mutant is characterized by an elevation of a phos-phorylated PIN protein that results in a basal-to-apical sub-cellular PIN accumulation, an increase in root basipetal auxin transport, and a phenotype showing shorter roots
and less lateral root formation [33]. SORTING NEXIN2 (SNX2a), the Arabidopsis ortholog of Os05g27920 (NR T_T, q51), shares partial functional redundancy with SNX1, which is involved in the endocellular transport of PIN2 via the formation of SNX1-containing endo-somes [34]. AUXIN/INDOLE-3-ACETIC ACID (IAA) are negative regulators of the auxin response and are involved in CRL1gene expression regulation by auxin [32]. The over-expression of OsIAA4 (Os01g18360, NR_T, q49) results in a reduction of the number of crown roots that form after auxin treatment, suggesting that this gene may be involved in the auxin signaling pathway that controls the formation of crown roots [35]. CRL1 regulates genes involved in meristem for-mation and patterning, such as SCARECROW (SCR), which acts together with SHORTROOT (SHR) to con-trol the division of the cortex-endodermis initial cell in Arabidopsis or with QUIESCENT CENTER HOME OBOX(QHB), which is an ortholog of the WUSCHEL-related WOX5 gene, to contribute to the quiescent center and root stem cell specification and mainten-ance [36–38]. Finally, Os07g37010 (NR_T, q53) is the ortholog of Arabidopsis CYCLIN D6;1 that was identi-fied as a direct target of SHR and SCR and is involved in the cell division events leading to root meristem formation and function [39]. All of these genes may be involved upstream or downstream of CRL1 in the regulation of crown root formation. OsMADS15 (Os0 7g01820, NCR, q42) over-expressing plants display alterations in development, including the over devel-opment of crown roots associated with enhanced expres-sion of the transcription factor WOX11, another gene that controls the formation and development of crown roots through a CRL1-independent pathway [40, 41]. Os02 g51710 is an ortholog of Arabidopsis POLYCYSTIN-1, LIPOXYGENASE, ALPHA-TOXIN AND TRIACYLGLYC-EROL LIPASE 1 (PLAT1). PLAT1 is induced by abiotic stress and positively regulates lateral root development [42]. Some genes whose function is related to root develop-ment and that are close to QTLs for deep-root biomass have been also identified. Os12g03150 (DW4060, q71) is an ortholog of Arabidopsis AtMYB60, which controls stomatal closure and stimulates root development in response to drought [43]. Os12g03110 (DW4060, q71) is the ortholog of MINI ZINC FINGER 1 (MIF1), which is a negative regulator of plant development, including root development [44]. Os01g10900 (DWB60, RDW, q73) is the ortholog of Arabidopsis MORPHOGENESIS OF ROOT HAIR 1 (MRH1), which regulates root-hair development [45]. Finally, Os02g50372 (DWB60, q74), is an expressed protein of unknown function but was previously reported as a candidate gene underlying a QTL that is related to root mass at depth, based on ex-pression studies [46].
Concerning root thickness, Os06g09280 (THK, q60) is an ortholog of ROOT INITIATION DEFECTIVE 1 (RID1). RID1 is involved in different developmental processes, such as meristem maintenance, and leaf and root morphogenesis. In roots, RID1 contributes to the proper expression of SCR and WOX5, two key genes involved in meristem shaping and root- tissue patterning [47]. Os03g63970 (THK, q59) corresponds to GIBBERELIC ACID 20 OXIDASE 1 (OsGA20ox1), which is a gene underlying a previously identified QTL for vigor at early developmental stages [48]. In Arabidopsis, GA, together with SCR and SHR, plays a key role in regulating the differentiation of super-numerary cortex cell layers in roots [49]; thus, the function of OsGA20ox1 should be further investigated. Similarly, cytokinins play a key role with auxin in root vascular patterning [50]. Os07g26740 (THK, q61), which encodes the RESPONSE REGULATOR 7 (OsR R7), may be involved in this process.
Several genes were identified whose reported bio-logical function is consistent with the associated pheno-type, the rice gene or its predicted Arabidopsis ortholog (Table 5). Knock-down or gain-of-function mutants of these genes should be generated to further investigate their function in the related phenotypes. Nevertheless, the fact that two genes are predicted to be orthologs in rice and Arabidopsis based on sequence homology does not guarantee that their function is conserved between the two species. In addition, several genes supporting QTLs initially had unknown functions [51, 52]. There-fore, to further validate these QTLs, it will be interesting to conduct an exhaustive differential expression study between contrasting varieties for the related phenotype for all genes included in the confidence interval of a given QTL. This approach has often been used as a cri-terion to restrict the number of candidate genes under-lying a QTL independently of their putative function [46, 48, 53]. Another way to validate these QTLs, which were detected on a statistical basis, is to develop map-ping populations segregating for the QTL. Although time consuming, this approach is a necessary step to-wards the positional cloning of the QTL. Marker haplo-types were established in the regions of the QTLs for NCR on chromosome 11 and THK on chromosome 2, which are the two most significant QTLs. Accessions of the panel with contrasting haplotypes will be used in a future study to make crosses and develop mapping pop-ulations in an indica background for NCR and in a japonica background for THK.
Methods
Materials
The material that was used in the experiment was com-posed of a panel of 197 accessions from Vietnam and 3
controls (Nipponbare, IR64 and Azucena). The seeds from the Vietnamese accessions came from the Plant Resource Center, Hanoi, Vietnam. These accessions were mostly traditional lines originating from various regions of Vietnam. The accession name, ID number, province of origin, ecosystem of origin, varietal group (indica (I), japonica (J) or intermediate (m)) and subpopulation within the varietal group (I1 to I6 for the indica acces-sions and J1 to J4 for the japonica accesacces-sions), when known, are listed in Additional file 1: Table S1. Other characteristics of the accessions can be found in Phung et al. [22]. The accessions were seed increased for one generation under field conditions, and one plant repre-sentative of the plot was selected for DNA extraction and further phenotyping.
Methods
Phenotyping experiment
The experiment was conducted at Van Giang Agricul-tural Station (latitude 20°39′ N, longitude 106°3′ W) near Hanoi, Vietnam, in August-September 2012. The experimental design was an alpha-lattice with 3 repli-cates. A block factor (10) was introduced to control for possible environmental variations within replicates. A block included 20 accessions. The experimental unit was composed of one plant.
Conditions of the experiment
The plants were grown under screenhouse conditions in well-drained black plastic bags, 80 cm long and 16 cm wide, that were filled with fine river sand and supple-mented with fertilizer (5/10/3 NPK at the rate of 20 kg/ m3 of sand). The seeds were sown on watered filter paper, incubated at 28 °C for 3 days at obscurity and transplanted into bags (one seed per bag). Three acces-sions did not germinate. The plants were watered four times a day (6 am, 10 am, 2 pm, and 6 pm) except during rain. Fertilizer (2.5 g 15/15/15 N/P/K per plant,) was added three weeks after transplanting following solubilization in water. The root system was collected 45 days after sowing.
For each plant, the length of the longest leaf was measured (LLGTH). The number of tillers per plant (TIL) was counted. The shoot part was dried for 3 days at 72 °C in an oven and weighed (SDW). The deepest point that was reached by the roots in the bag was mea-sured (DEPTH). Then, the roots were carefully washed. The maximum root length (MRL) was measured. The number of crown roots (NCR) below the tillering plat-eau was counted, and the number of crown roots per tiller (NR_T) was computed as NCR/TIL. The root thickness (THK) was measured using a micrometer on 5 roots per plant, 2 cm below the tillering plateau, and averaged. The root system was divided into 4 segments
from the top to the bottom (0 to 20 cm (DW0020), 20 to 40 cm (DW2040), 40 to 60 cm (DW4060) and below 60 cm (DWB60)) and the segments were oven-dried for 3 days at 72 °C. The root dry weight (RDW) and deep root weight (DRW) were computed as the sum of the four segments and the sum of the two deeper segments (DW4060 + DWB60), respectively. The shallow root weight proportion (SRP) was computed as DW0020* 100/RDW. The deep root weight proportion (DRP) was computed as DRW*100/RDW. The root-to-shoot ratio (R_S) was computed as SDW*100/RDW.
To represent the measured phenotypic traits on a synthetic figure, a tracing software named “RASTA” (for Root And Shoot TrAcing) was developed using the PHP hypertext preprocessor (PHP, The PHP Group, http:// www.php.net) coding language and a drawing set of instruc-tions from the Graphics Draw Graphics Library (http:// www.libgd.org). The software is available from the corre-sponding author. The shoot and root parts of each accession were drawn as two polygons whose dimensions were proportional to the considered traits (see Additional file 3: Figure S1 for detailed explanations).
Genotyping by Sequencing (GBS)
GBS data were available for 182 Vietnamese accessions of the 197 that germinated, and for the three controls. The GBS method and the selection of the resulting SNP markers are described in detail in [22]. Briefly, the gen-ome complexity reduction was done using PstI/TaqI restriction digest, a combination of enzymes enabling a good sequencing depth, and was followed by Illumina short read sequencing. Markers that had no position on the Nipponbare sequence or that had more than 20 % missing data were discarded. Because of the sensitivity of GWAS to the presence of unbalanced genotypic classes markers that had a minor allele frequency (MAF) of less than 5 % were also discarded. The remaining missing data (5.2 % in the whole date set) were imputed using Beagle v3.3.2 [54]. The final data set was composed of 21,623 markers without missing data. Indica (115 acces-sions) and japonica (64 accesacces-sions) subpanels were also individualized and contained 13,814 and 8821 markers, respectively, that were polymorphic and with an MAF of less than 5 % in their specific subpanel.
Statistical analyses
An analysis of variance (ANOVA) was performed con-sidering the variety, replicate and block effects as fixed. The fixed effects were tested using SAS 9.2. (SAS Insti-tute, Cary NC, USA) and least square variety means were computed to adjust for imbalance of the block ef-fects. The phenotypic correlations between traits were computed using these adjusted means. To analyze the organization of the phenotypic variability, a Principal
Component Analysis (PCA) was undertaken on the ad-justed means of all of the traits. To further analyze the relationships between phenotypic variability and genetic structure, which can deeply affect the results of GWAS, three independent ANOVAs were performed on the ad-justed means of each trait considering a group effect as the main factor within the whole panel, and considering a subpopulation effect as the main factor within each of the two subpanels, and using a Newman and Keuls test to detect differences between group means or between subpopulation means. For each trait-by-panel combin-ation, the percentage of phenotypic variance that was ex-plained by the structure was computed by a regression of the phenotype on the percentages of admixtures that were obtained by Phung et al. [22] for all accessions. These analyses were performed using SAS v9.2, except for the PCA, for which XLStat [55] was used.
Association mapping
We performed successive association analyses on the whole panel (182 accessions * 21,623 markers), and on the indica (115 accessions * 13,814 markers) and japonica (64 accessions * 8821 markers) subpanels using Tassel v3 [56]. Three accessions of the whole panel classified as admixed (% of admixture below 75 % in any subpanel [22]) were excluded from the subpanels. For all of the traits, we used a mixed model with a structure matrix that was consid-ered as a fixed effect and a kinship matrix considconsid-ered as a random effect as covariates to control the false-positive rate. We chose the options of no compression and re-evaluation of variance components for each marker. The structure matrices of the three panels were determined by running a PCA on their respective marker data sets. For the three panels, the first six PCA axes were retained, and the scores of the accessions on these six axes were used as the structure matrix. The kinship matrices were estab-lished using the pairwise Identity by State (IBS) method proposed by Tassel. Quantile-quantile plots (QQ plots) were drawn using Tassel. QQ plots enable to graphically evaluate the number of false positives observed with the chosen model, based on deviations from the uniform law. The inflation factor lambda was computed to quantita-tively assess the extent of these deviations using the “estlambda” function from the R GenABEL package. The expected value of lambda is 1 for no inflation situations. We used a threshold of 1e-04 to declare an association significant. To determine this threshold, the effective number of independent tests (Meff ) was first computed using the R SimpleM package and was used as the denom-inator in the Bonferroni correction formula as proposed by Gao [57]. The method is said to give close approxima-tion to a permutaapproxima-tion threshold. Meff were 8545, 5649, and 2310 for the whole panel, the indica and the japonica subpanels, respectively, corresponding to P values of
approximately 5e-06, 1e-05, and 5e-05. Since we wanted to be able to make comparisons across populations and across traits, we chose the less stringent common P value of 1e-04. Then, we computed the q-value corresponding to each P-value for all of the traits in all three panels using the R Q-value package v1.0 [58] as a measure of the false-discovery rate. The associations that were significant at a q-value < 0.05 were represented in bold in Table 3. The Manhattan plots that graphically represent the signifi-cance of all markers were drawn using Tassel.
Availability of supporting data and material The GBS dataset (hapmap format) supporting the results of this article has been deposited as a downloadable Excel file in TropGeneDB: http://tropgenedb.cirad.fr/tropgene/JSP/ interface.jsp?module=RICE tab“studies”, study type “geno-type”, study “Vietnamese panel - GBS data”.
The seeds of the accessions are available from the Plant Resource Center, Hanoi, Vietnam.
Additional files
Additional file 1: Table S1. List of the 200 accessions used in the phenotyping experiments. (DOCX 56 kb)
Additional file 2: Table S2. Mean, standard deviation, range, and CV of the whole panel for all traits measured. (DOCX 31 kb)
Additional file 3: Figure S1. Graphical representation of the panel. (PPTX 418 kb)
Additional file 4: Table S3. Mean comparisons between groups in the whole panel and subpopulations in each subpanel and percentage of variance explained by the structure (% var). (DOCX 48 kb)
Additional file 5: Table S4. Pearson correlation coefficients between traits in the whole panel (below the diagonal). Probabilities above the diagonal (in bold, significant at P < 0.05). W = whole panel; I = indica panel; J = japonica panel. (DOCX 43 kb)
Additional file 6: Table S5. List of genes with function located nearby the QTLs. (PDF 146 kb)
Abbreviations
ANOVA:analysis of variance; CRL1: crown root less 1; DEPTH: deepest point reached by roots; DRP: deep root proportion (<40 cm); DRW: deep root mass (<40 cm) weight; DW0020: root mass in the 00–20 cm segment;
DW2040: root mass in the 20–40 cm segment; DW4060: root mass in the 40–60 cm segment; DWB60: root mass below 60 cm; FYPP: phytochrome-associated serine/threonine proteinphosphatase; GA20ox: gibberelic acid 20 oxidase; GBS: genotyping by sequencing; GWAS: genome-wide association studies; IAA: auxin/indole-3-acetic acid; LBD: lateral organ boundary domain; LD: linkage disequilibrium; LLGTH: longest leaf length; MAF: minor allele frequency; MRH: morphogenesis of root hair; MRL: maximum root length; NCR: number of crown roots; NR_T: number of crown root per tiller; PCA: principal components analysis; PDW: plant dry weight; PHP: hypertext preprocessor; PIN: pin-formed; PIP: plasma membrane intrinsic protein; PLAT: polycystin-1, lipoxygenase, alpha-toxin and triacylglycerol lipase; QHB: quiescent center homeobox; QQ: quantile-quantile; QTLs: quantitative trait loci; MIF: mini zinc finger; RDW: root dry weight; RID: root initiation defective; RR: response regulator; R_S: root to shoot ratio; SCR: scarecrow; SDW: shoot dry weight; SHR: shortroot; SNP: single nucleotide
polymorphism; SNX: sorting nexin; SRP: shallow root proportion (0–20 cm); THK: root thickness; TIL: number of tillers; WOX: WUSCHEL-related.
Competing interests
The authors declare that they have no competing interests.
Authors’ contributions
NTPP, VND, PG and BC conceived the experiment. NTPP, PG, CDM, GTH, MHTT, JL, MG, KLN, and TPH performed the root phenotyping. JL developed the RASTA software and drew the corresponding figures. NTPP and BC performed the statistical and GWAS analyses. PG determined the Arabidopsis orthologs and analyzed the literature on gene function. BC, PG, and NTPP wrote the manuscript. All of the authors read and approved the manuscript.
Acknowledgments
NhungThi Phuong Phung was supported by a Global Rice Research Partnership [GRiSP] PhD fellowship. This work was supported by the Ministry of Agriculture and Rural Development of Vietnam (project "Characterization of new genes and alleles involved in root development and drought tolerance in rice"). The authors thank American Journal Experts for the English editing of the manuscript.
Author details
1Agricultural Genetics Institute, National Key Laboratory for Plant Cell
Biotechnology, LMI RICE, 00000 Hanoi, Vietnam.2University of Science and Technology of Hanoi, LMI RICE, 00000 Hanoi, Vietnam.3IRD, LMI RICE, 00000
Hanoi, Vietnam.4Université de Montpellier, UMR DIADE, 34095 Montpellier,
France.5Cirad, UMR-AGAP, 34398 Montpellier, France.
Received: 9 October 2015 Accepted: 26 February 2016
References
1. FAOSTAT. http://faostat3.fao.org/home/E. Accessed 31/12/2014. 2. Wassmann R. Copping with climate change. Rice Today. 2007;6(3):10–5. 3. Fukai S, Cooper M. Development of drought resistant cultivars using
physio-morphological traits in rice. Field Crops Res. 1995;40:67–87.
4. Courtois B, Lafitte RH. Rice improvement for the drought-prone upland environments of Asia. In: O’Toole J, Ito O, Hardy B, editors. Genetic improvement of rice for water-limited environments. Los Baños: IRRI; 1999. p. 35–56.
5. Courtois B, Ahmadi N, Khowaja FS, Price AH, Rami J-F, Frouin J, et al. Rice root genetic architecture: meta-analysis from a drought QTL database. Rice. 2009;2(2–3):115–28.
6. Gamuyao R, Chin JH, Pariasca-Tanaka J, Pesaresi P, Catausan S, Dalid C, et al. The protein kinase Pstol1 from traditional rice confers tolerance of phosphorus deficiency. Nature. 2012;488:535–9.
7. Uga Y, Sugimoto K, Ogawa S, Rane J, Ishitani M, Hara N, et al. Control of root system architecture by DEEPER ROOTING 1 increases rice yield under drought conditions. Nat Genet. 2013;45:1097–102.
8. Hansawa E, Sasaki K, Nagai S, Obara M, Fukuta Y, Uga Y, et al. Isolation of a novel mutant gene for soil-surface rooting in rice. Rice. 2013;6:30–41. 9. Kumar A, Dixit S, Henry A. Marker-assisted introgression of major QTLs
for grain yield under drought in rice. In: Varshney R, Tuberosa R, editors. Genomics Applications in Plant Breeding. USA: Wiley-Blackwell Publishers; 2013.
10. Swamy BPM, Ahmed HU, Henry A, Mauleon R, Dixit S, Vikram P, et al. Genetic, physiological, and gene expression analyses reveal that multiple QTLs enhance yield of rice mega-variety IR64 under drought. PLoS One. 2013;8:e62795.
11. Coudert Y, Périn C, Courtois B, Khong NG, Gantet P. Genetic control of root development in rice, the model cereal. Trends Plant Sci. 2010;15(4):219–26. 12. Wu W, Cheng S. Root genetic research, an opportunity and challenge to
rice improvement. Field Crop Res. 2014;165:111–24.
13. Orman B, Parizot B, Gantet P, Beeckman T, Bennett M, Draye X. Post-embryonic root organogenesis in cereals: branching out from model plants. Trends Plant Sci. 2013;18:459–67.
14. Duc CM, Phung NTP, To HMT, Gonin M, Hoang GT, Nguyen KL, et al. Genes controlling root development in rice. Rice. 2015;7:30.
15. Zu C, Gore M, Buckler ES, Yu J. Status and prospects of association mapping in plants. Plant Genome. 2008;1:5–20.
16. Tung CW, Zhao K, Wright MH, Ali ML, Jung J, Kimball J, et al. Development of a research platform for dissecting phenotype-genotype associations in rice. Rice. 2010;3:205–17.
17. Courtois B, Audebert A, Dardou A, Roques S, Ghneim Herrera T, Droc G, et al. Genome-wide association mapping of root traits in a japonica rice panel. PLoS One. 2013;8(11):e78037.
18. Famoso AN, Zhao K, Clark RT, Tung CW, Wright MH, Bustamante C, et al. Genetic architecture of aluminum tolerance in rice (Oryza sativa L.) determined through genome-wide association analysis and QTL mapping. PLoS Genet. 2011;7(8):e1002221.
19. Radanielina T, Ramanantsoanirina A, Raboin LM, Frouin J, Perrier X, Brabant P, et al. The original features of rice genetic diversity and the importance of within variety diversity in the highlands of Madagascar build a strong case for in situ conservation. Genet Resour Crop Evol. 2013;60:311–23. 20. Myint KK, Courtois B, Risterucci AM, Frouin J, Soe K, MaungThet K, et al.
Specific patterns of genetic diversity among aromatic rice varieties in Myanmar. Rice. 2012;5:20–33.
21. 3K RG. The 3,000 rice genomes project. GigaScience. 2014;3:7. 22. Phung NTP, Mai CD, Mournet P, Frouin J, Droc G, Ta NT, et al.
Characterization of a panel of Vietnamese rice varieties using DArT and SNP markers in view of association mapping. BMC Plant Biol. 2014;14:371. 23. OrygenesDB. http://orygenesdb.cirad.fr/tools.html. Accessed 01/12/2014. 24. EURoot database. http://gohelle.cirad.fr:8080/euroot/JSP/. Accessed 01/12/2014. 25. Takehisa H, Sato Y, Igarashi M, Abiko T, Antonio BA, Kamatsuki K, et al.
Genome‐wide transcriptome dissection of the rice root system: implications for developmental and physiological functions. Plant J. 2012;69(1):126–40. 26. Lafitte H, Champoux M, McLaren G, O’Toole J. Rice root morphological traits
are related to isozyme group and adaptation. Field Crop Res. 2001;71:57–70. 27. Zhao K, Tung C-W, Eizenga GC, Wright MH, Ali ML, Price AH, et al.
Genome-wide association mapping reveals a rich genetic architecture of complex traits in Oryza sativa. Nat Comm. 2011;2:467.
28. Kovach MJ, Sweeney MT, McCouch SR. Insights into the history of rice domestication. Trends Genet. 2007;23(11):578–87.
29. Sang T, Ge S. Understanding rice domestication and implications for cultivar improvement. Curr Opin Plant Biol. 2013;16:1–8.
30. Lian HL, Yu X, Lane D, Sun WN, Tang ZC, Su WA. Upland rice and lowland rice exhibited different PIP expression under water deficit and ABA treatment. Cell Res. 2006;16(7):651–60.
31. Sakurai J, Ahamed A, Murai M, Maeshima M, Uemura M. Tissue and cell-specific localization of rice aquaporins and their water transport activities. Plant Cell Physiol. 2008;49(1):30–9.
32. Inukai Y, Skamoto T, Ueguchi-Tanaka M, Shibata Y, Gomi K, Umemura I, et al. Crown rootless1, which is essential for crown root formation in rice, is a target of an auxin response factor in auxin signaling. Plant Cell. 2005;17:1387–96. 33. Dai M, Zhang, Kania U, Chen F, Xue Q, Mccray T, et al. A PP6-type
phosphatase holoenzyme directly regulates PIN phosphorylation and auxin efflux in Arabidopsis. Plant Cell. 2012;24(6):2497–514.
34. Jaillais Y, Fobis-Loisy I, Miege C, Rollin C, Gaude T. AtSNX1 defines an endosome for auxin-carrier trafficking in Arabidopsis. Nature. 2006;443(7107):106–9. 35. Song Y, Xu ZF. Ectopic overexpression of an auxin/indole-3-acetic acid
(Aux/IAA) Gene OsIAA4 in rice induces morphological changes and reduces responsiveness to auxin. Intern J Mol Sci. 2013;14(7):13645–56.
36. Liu H, Wang S, Yu X, Yu J, He X, Zhang S, et al. ARL1, a LOB‐domain protein required for adventitious root formation in rice. Plant J. 2005;43(1):47–56. 37. Kamiya N, Nagasaki H, Morikami A, Sato Y, Matsuoka M. Isolation and
characterization of a rice WUSCHEL-type homeobox gene that is specifically expressed in the central cells of a quiescent center in the root apical meristem. Plant J. 2003;35:429–41.
38. Cui H, Levesque MP, Vernoux T, Jung JW, Paquette AJ, Gallagher KL, et al. An evolutionarily conserved mechanism delimiting SHR movement defines a single layer of endodermis in plants. Science. 2007;316:421–5.
39. Sozzani R, Cui H, Moreno-Risueno MA, Busch W, Van Norman JM, Vernoux T, et al. Spatiotemporal regulation of cell-cycle genes by SHORTROOT links patterning and growth. Nature. 2010;466(7302):128–32.
40. Lu SJ, Wei H, Wang Y, Wang HM, Yang RF, Zhang XB, et al. Overexpression of a transcription factor OsMADS15 modifies plant architecture and flowering time in rice (Oryza sativa L.). Plant Mol Biol Rep. 2012;30(6):1461–9. 41. Zhao Y, Hu Y, Dai M, Huang L, Zhou DX. The WUSCHEL-related homeobox
gene WOX11 is required to activate shoot-borne crown root development in rice. Plant Cell. 2009;21(3):736–48.
42. Hyun TK, Van Der Graaff E, Albacete A, Eom SH, Großkinsky DK, Böhm H, et al. The Arabidopsis PLAT domain protein1 is critically involved in abiotic stress tolerance. PLoS One. 2014;9(11):e112946.
43. Oh JE, Kwon Y, Kim JH, Noh H, Hong SW, Lee H. A dual role for MYB60 in stomatal regulation and root growth of Arabidopsis thaliana under drought stress. Plant Mol Biol. 2011;77(1-2):91–103.
44. Hu W, Ma H. Characterization of a novel putative zinc finger gene MIF1: involvement in multiple hormonal regulation of Arabidopsis development. Plant J. 2006;45(3):399–422.
45. Jones MA, Raymond MJ, Smirnoff N. Analysis of the root‐hair morphogenesis transcriptome reveals the molecular identity of six genes with roles in root‐hair development in Arabidopsis. Plant J. 2006;45(1):83–100.
46. Norton GJ, Aitkenhead MJ, Khowaja FS, Whalley WR, Price AH. A bioinformatic and transcriptomic approach to identifying positional candidate genes without fine mapping: an example using rice root-growth QTLs. Genomics. 2008;92(5):344–52.
47. Ohtani M, Demura T, Sugiyama M. Arabidopsis root initiation defective1, a DEAH-box RNA helicase involved in pre-mRNA splicing, is essential for plant development. Plant Cell. 2013;25(6):2056–69.
48. Abe A, Takagi H, Fujibe T, Aya K, Kojima M, Sakakibara H, et al. OsGA20ox1, a candidate gene for a major QTL controlling seedling vigor in rice. Theor Appl Genet. 2012;125(4):647–57.
49. Paquette AJ, Benfey PN. Maturation of the ground tissue of the root is regulated by gibberellin and scarecrow and requires short-root. Plant Physiol. 2005;138(2):636–40.
50. Bishopp A, Lehesranta S, Vatén A, Help H, El-Showk S, Scheres B, et al. Phloem-transported cytokinin regulates polar auxin transport and maintains vascular pattern in the root meristem. Curr Biol. 2011;21(11):927–32. 51. Wissuwa M, Wegner J, Ae N, Yano M. Substitution mapping of Pup1: a
major QTL increasing phosphorus uptake if rice from a phosphorus-deficient soil. Theor Appl Genet. 2002;105:890–7.
52. Uga Y, Okuno K, Yano M. Dro1, a major QTL involved in deep rooting of rice under upland field conditions. J Exp Bot. 2011;62:2485–94. 53. Meijon M, Satbhai SB, Tsuchimatsu T, Busch W. Genome-wide association
study using cellular traits identifies a new regulator of root development in Arabidopsis. Nat Genet. 2014;46(1):77–81.
54. Browning SR, Browning BL. Rapid and accurate haploytpe phasing and missing data inference for whole genome association studies by use of localized haplotype clustering. Am J Human Genet. 2007;81:1084–97. 55. Addinsoft. XLSTAT version 2011.4.02. Paris: Addinsoft; 2011.
56. Bradbury PJ, Zhang Z, Kroon DE, Casstevens TM, Ramdoss Y, Buckler ES. TASSEL: software for association mapping of complex traits in diverse samples. Bioinformatics. 2007;23:2633–5.
57. Storey JD, Tibshirani R. Statistical significance for genomewide studies. Proc Natl Acad Sci U S A. 2003;100:9440–5.
58. Gao X. Multiple testing corrections for imputed SNPs. Genet Epidemiol. 2011;35(3):154–8.
• We accept pre-submission inquiries
• Our selector tool helps you to find the most relevant journal • We provide round the clock customer support
• Convenient online submission • Thorough peer review
• Inclusion in PubMed and all major indexing services • Maximum visibility for your research
Submit your manuscript at www.biomedcentral.com/submit