HAL Id: hal-01661214
https://hal.archives-ouvertes.fr/hal-01661214
Submitted on 27 May 2020
HAL is a multi-disciplinary open access archive for the deposit and dissemination of sci-entific research documents, whether they are pub-lished or not. The documents may come from teaching and research institutions in France or abroad, or from public or private research centers.
L’archive ouverte pluridisciplinaire HAL, est destinée au dépôt et à la diffusion de documents scientifiques de niveau recherche, publiés ou non, émanant des établissements d’enseignement et de recherche français ou étrangers, des laboratoires publics ou privés.
Trophic niches of sympatric tropical tuna in the Western
Indian Ocean inferred by stable isotopes and neutral
fatty acids
Fany Sardenne, Nathalie Bodin, Emmanuel Chassot, Aurélien Amiel, Edwin
Fouché, Maxime Degroote, Stephanie Hollanda, Heidi Pethybridge, Benoit
Lebreton, Gaël Guillou, et al.
To cite this version:
Fany Sardenne, Nathalie Bodin, Emmanuel Chassot, Aurélien Amiel, Edwin Fouché, et al.. Trophic niches of sympatric tropical tuna in the Western Indian Ocean inferred by stable isotopes and neutral fatty acids. Progress in Oceanography, Elsevier, 2016, 146, pp.75 - 88. �10.1016/j.pocean.2016.06.001�. �hal-01661214�
Version postprint
Accepted Manuscript
Trophic niches of sympatric tropical tuna in the Western Indian Ocean inferred by stable isotopes and neutral fatty acids
Fany Sardenne, Nathalie Bodin, Emmanuel Chassot, Aurélien Amiel, Edwin Fouché, Maxime Degroote, Stéphanie Hollanda, Heidi Pethybridge, Benoit Lebreton, Gaël Guillou, Frédéric Ménard
PII: S0079-6611(15)30064-1
DOI: http://dx.doi.org/10.1016/j.pocean.2016.06.001
Reference: PROOCE 1707
To appear in: Progress in Oceanography Received Date: 21 December 2015
Revised Date: 3 June 2016
Accepted Date: 6 June 2016
Please cite this article as: Sardenne, F., Bodin, N., Chassot, E., Amiel, A., Fouché, E., Degroote, M., Hollanda, S., Pethybridge, H., Lebreton, B., Guillou, G., Ménard, F., Trophic niches of sympatric tropical tuna in the Western Indian Ocean inferred by stable isotopes and neutral fatty acids, Progress in Oceanography (2016), doi: http:// dx.doi.org/10.1016/j.pocean.2016.06.001
This is a PDF file of an unedited manuscript that has been accepted for publication. As a service to our customers we are providing this early version of the manuscript. The manuscript will undergo copyediting, typesetting, and review of the resulting proof before it is published in its final form. Please note that during the production process errors may be discovered which could affect the content, and all legal disclaimers that apply to the journal pertain.
Version postprint
Trophic niches of sympatric tropical tuna in the Western Indian Ocean inferred by
1
stable isotopes and neutral fatty acids
2 3
Fany Sardenne1*, Nathalie Bodin1, Emmanuel Chassot1, Aurélien Amiel1,2, Edwin Fouché1,2,
4
Maxime Degroote1, Stéphanie Hollanda3, Heidi Pethybridge4, Benoit Lebreton5, Gaël
5
Guillou5 & Frédéric Ménard6
6 7
1
IRD, UMR 248 MARine Biodiversity Exploitation and Conservation (IRD, Ifremer, UM,
8
CNRS), BP 570, Victoria, SEYCHELLES.
9
2
INRA, UMR 1331 TOXALIM (INRA), Research Centre in Food Toxicology, Toulouse, FRANCE.
3
Seychelles Fishing Authority (SFA), BP 449, Victoria, SEYCHELLES.
10
4
CSIRO Oceans and Atmosphere Flagship, Hobart, AUSTRALIA.
11
5
CNRS-Université de la Rochelle, UMR 7266 Littoral Environnement et Sociétés (LIENSs),
12
La Rochelle, FRANCE.
13
6
IRD, Mediterranean Institute of Oceanography (Aix-Marseille Université, CNRS/INSU, 14
Université de Toulon, IRD), Marseille, FRANCE.
15 16 17
Highlights
18
• Sympatric tropical tuna (bigeye, yellowfin and skipjack tuna) were sampled in the Indian
19
Ocean;
20
• Trophic niche partitioning was quantitatively assessed using time-integrated tracers;
21
• Intra- and inter-species resource overlap in three tropical tuna species was detected;
22
• Diet shifts at ~ 100 cm fork length were detected in the larger tuna species (bigeye and
23
yellowfin);
24
• New insights into the mechanisms involved in tropical tuna coexistence are provided.
25 26 27
*
Corresponding author: Fany.Sardenne@hotmail.fr
28 29 30 31 32
Version postprint
ABSTRACT
33
This study examined the trophic ecology of three sympatric tropical tuna species (bigeye
34
BET, skipjack SKJ, and yellowfin YFT) sampled in the Western Indian Ocean throughout
35
2013. Specifically we explored inter-specific resource partitioning and ontogenetic variability
36
using neutral fatty acids and stable isotope analysis of liver and muscle from small (≤100 cm
37
fork length, FL) and large (>100 cm FL) tuna collected in mixed schools at the surface by
38
purse-seine. Both biochemical tracers were used to calculate trophic niche indices that
39
collectively revealed high potential for resource overlap, especially among small tuna.
40
Resource overlap appeared strongest between BET and YFT, with SKJ tissues having high
41
carbon isotope (δ13C) values (-17±0.3‰), lower nitrogen isotope (δ15N) values (11.4±0.6‰),
42
and higher relative proportion of poly-unsaturated fatty acids (PUFA) than the two other
43
species, indicating a different diet. Size was found to be a strong predictor for most
44
biochemical tracers in the three species with δ13C, δ15N and total lipid content in the liver. In
45
the larger species (YFT and BET), proportions of mono-unsaturated fatty acids typically
46
increased with size, while quantities of PUFA decreased. In addition to ontogenetic
47
variability, trophic markers were shown to vary between sampling area and season: higher
48
lipid reserves and δ15N values, and lower δ13C values occurred during monsoon periods
49
around Seychelles than in the Mozambique Channel (parted from about 1500 km). Our
multi-50
tracer approach reveals the magnitude of potential competitive interactions in mixed tropical
51
tuna schools at both small and large sizes and demonstrates that ontogenetic niche
52
differentiation acts as a major factor of coexistence in tropical tuna.
53 54
Keywords: niche area; resource overlap; mixed-school; ontogenetic changes; trophic tracers.
55 56 57 58 59 60 61 62 63 64 65
Version postprint
1. INTRODUCTION
66
Three principal market tropical tuna species, bigeye (Thunnus obesus; BET), skipjack
67
(Katsuwonus pelamis; SKJ) and yellowfin (T. albacares; YFT), occur in the pelagic
68
environment in schools, often mixed, that are largely targeted by industrial tuna fisheries
69
including purse seine. In all oceans, tropical tuna schools display specific compositions with
70
SKJ, whose size does not exceed one meter, generally recovered with juvenile BET and YFT,
71
while adults of these two species (>100 cm) can be found together (Fonteneau et al., 2000;
72
Hare et al., 2015). Indeed, diving abilities increase with size in BET and YFT and result in
73
deeper vertical distribution with age, whereas SKJ is more vertically confined to the surface
74
layers due to the lack of swim-bladder and higher oxygen requirement (Graham and Dickson,
75
2004). In the purse seine fishery of the Western Indian Ocean, small tuna (fork length;
76
FL≤100 cm) mainly aggregate under floating objects in mixed schools and large tuna
77
(FL>100 cm) mainly form free-swimming schools, although some large fishes are also
78
associated with floating objects (Chassot et al., 2015). Sympatry of tropical tuna in mixed
79
schools suggests possible competition for trophic resources, particularly where resources are
80
limited.
81
The trophic ecology of tropical tuna has mainly been investigated through stomach content
82
analysis which suggests that all species collectively display opportunistic predatory
83
behaviour, feeding during the day on a large diversity of prey composed of small fish,
84
crustaceans and cephalopods (Potier et al., 2004; Olson et al., 2014). Globally, diet
85
composition has been shown to be influenced by local prey availability, fishing gear that
86
corresponds to specific environmental characteristics (e.g. depth, time of the catch), and
87
environmental conditions (e.g. season, geographical area) (Young et al., 2010b; Olson et al.,
88
2014). In the Indian Ocean, crustaceans, mainly the swimming crab Charybdis smithii and the
89
stomatopod Natosquilla investigatoris, were found to be the main prey of the three species,
90
especially during the day time in September-October (Romanov et al. 2009), followed by
91
small fish like Cubiceps pauciradiatus and small scombridae (Potier et al., 2001, 2004;
92
Grande, 2013; Zudaire et al., 2015). Cephalopods, especially the ommastrephids Sthenoteuthis
93
oualaniensis and Ornithoteuthis volatilis, occurred mainly in BET and YFT diet (Potier et al.,
94
2001; Ménard et al., 2013). In addition, feeding habits of tuna have been shown to vary
95
between large individuals that are shallow and deep-dwelling (Potier et al., 2004). While large
96
BET and YFT continue to feed on small prey, at equal size, BET hunt on larger prey than
97
YFT (Ménard et al., 2006), and the average prey size increases with predator size in the
98
tropical tuna (Jaquemet et al., 2011). Limited information is available on diet shift in tropical
Version postprint
tuna, globally, with the exception of a study by Graham et al. (2006) who detected an
100
ontogenetic shift in coastal YFT from Hawaii at around 50 cm FL.
101
Since stomach content analysis only provides a snapshot of the animal’s diet (Cortés, 1997),
102
alternative techniques capable of examining trophic relationships over longer time periods
103
have been progressively introduced. Stable isotopes (SI) and fatty acids (FA) are two of the
104
main trophic tracers currently used in trophic ecology as they have the advantage of reflecting
105
nutrients assimilated over period of weeks to multi-years, depending on the rate at which they
106
are incorporated from diet into consumer tissues and the turn-over of the tissues (Dalsgaard et
107
al., 2003; Buchheister and Latour, 2010). SI of carbon (expressed as δ13C, ‰) details the
108
origins of primary producers’ with different values allowing primary feeding habitats to be
109
differentiated (i.e., continental vs. near shore marine vs. offshore marine; Clementz and Koch,
110
2001). Within an ecosystem, SI of nitrogen (expressed as δ15N, ‰) provides a proxy of an
111
animal's trophic position due to a predictable stepwise enrichment from the heavy to the light
112
isotope between trophic levels. Profiles of FA can be used to examine the dynamics of
113
predator-prey relationships, food web structure and energy fluxes (Iverson et al., 2004).
114
Increasingly the importance for dietary studies to focus on FA stemming from storage lipids
115
(i.e. neutral fatty acids, NFA) has been emphasized (Lee et al., 2006; Pethybridge et al., 2014)
116
as they provide fuel for energetic demands and are transferred with limited modifications
117
from prey to predator in comparison to structural lipids or other nutrients (Robin et al., 2003).
118
Trophic niche metrics (including nestedness, total niche area, niche widths, and niche
119
overlap) derived from functional ecology have been recently adapted to stable isotope ecology
120
(Layman et al., 2007; Cucherousset and Villéger, 2015) and have also been explored using FA
121
(Pethybridge et al., 2014). Several species-specific studies have used SI or FA to investigate
122
either tuna’s trophic ecology (SI: Graham et al., 2006; Ménard et al., 2007; Zudaire et al.,
123
2015 ; FA: Saito et al., 1996; Parrish et al., 2013) or the effect of environmental changes
124
(Lorrain et al., 2015; Pethybridge et al., 2015b, 2015a). To our knowledge, no study has
125
undertaken inter-specific comparisons of the three tropical tuna’ diet at the same time (their
126
niche partitioning) despite the ecological and economic significance of them co-occurring in
127
mixed schools. This study aimed to examine the extent of resource partitioning among
128
sympatric tropical tuna and with ontogeny for a given species in the Western Indian Ocean.
129
By using a multi-tracer (SI and NFA) and multi-tissue (muscle and liver) approach, our
130
comparative study provides valuable insights into how these co-occurring marine
top-131
predators compete or partition space and prey resources.
132 133
Version postprint
2. MATERIAL AND METHODS
134
2.1. Tuna and tissue collection
135
Tuna sampling was conducted throughout 2013 in the Western Indian Ocean during the
136
unloading of the purse seiners at Victoria port, Seychelles. Fish selection was based on two
137
criteria: (i) the capture area from January to December to cover possible geographic and
138
seasonal trophic changes (sampling realized according to the information provided by the
139
purse-seine logbook; the mean coordinates were used when several activities, always
140
comprised within a maximum of 5° square, were grouped in purse-seine wells); and (ii) tuna
141
size, to examine ontogenetic dietary shifts. A total of 81 BET, 94 SKJ and 93 YFT were
142
collected and processed at the laboratory where FL (in cm, taken from the tip of the snout to
143
the fork of the tail), and sex (Indeterminate, I; Female, F; Male, M) were recorded for each
144
individual. Maturity stage was based on macroscopic examination of the gonads and was used
145
to group fish into two phases: developing (Dev, i.e., immature to developing fish), and
146
spawning (Spa, i.e., spawning capable to resting fish; Brown-Peterson et al., 2011). Table S1
147
gives details of the number of samples analyzed for each fish descriptor, i.e. size class, sex,
148
season, capture area and maturity stage. Two sub-samples of frozen fish of around 2 g (wet
149
weight, ww) were taken from the dorsal white muscle (sampled under the dorsal spine on the
150
left side) and the liver of each fish, and frozen within 20 min. All samples were stored at
-151
80°C until further analyses.
152 153
2.2. Trophic tracer analyses
154
The detailed procedures are presented in the Supplementary material.
155
A total of 518 samples (250 livers and 268 muscles) were analyzed for total lipid content
156
(TLC), δ13C and δ15N according to the methods of Bodin et al. (2009) and Sardenne et al.
157
(2015b). Briefly, TLC of each sample, expressed in % of dry weight (dw), was estimated by
158
Accelerated Solvent Extraction with dichloromethane. δ13C and δ15N were analyzed together
159
on dried lipid-free samples using a Delta V Advantage isotope ratio mass spectrometer
160
interfaced to a Flash EA 1112 elemental analyzer (Thermo Scientific). Analytical precision
161
for both δ13C and δ15N was <0.15‰ based on replicate measurements of internal laboratory
162
standard (acetanilide and peptone, Thermo Scientific).
163
A total of 367 samples (180 livers and 187 muscles) were selected for the analysis of NFA, to
164
cover a range of sizes. Compounds were separated on a TRACE 1310 gas chromatograph
165
equipped with a FAMEWAXTM column (30 m, 0.32 mm internal diameter, Restek) and a
Version postprint
flame-ionization detector (Thermo Scientific). NFA results were expressed in % as a relative
167
abundance of total identified compounds.
168 169
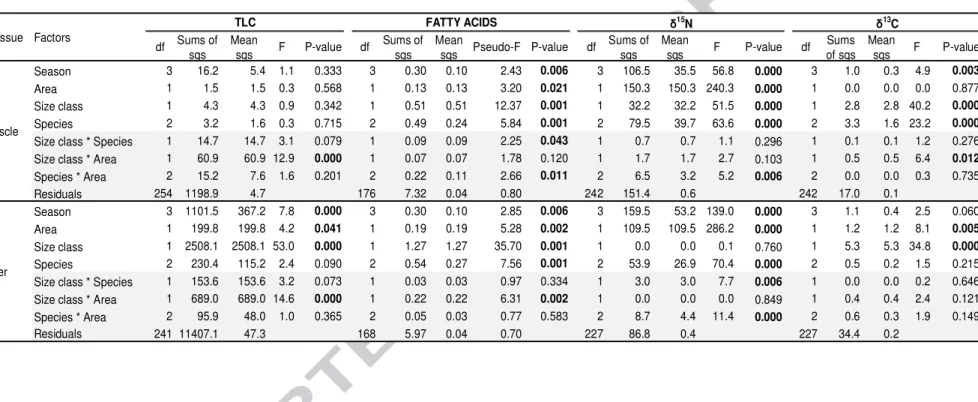
2.3. Data analyses
170
Variations in TLC, δ13C and δ15N values, and NFA among tuna species were investigated to
171
test the effects of fish size, habitat (i.e., fishing area) and season. Two distinct size classes
172
based on the aggregative behavior were considered (FL ≤100 cm and >100 cm; Chassot et al.,
173
2015), with the second class only including BET and YFT. As previous studies highlighted
174
the peculiarity of the Mozambique Channel (MOZ) in term of productivity (Potier et al.,
175
2014), this sampling area was analyzed separately from the Western-Central Indian Ocean
176
(WCIO; Fig. 1). Finally, the monsoon circulation results in a strong seasonal variability in
177
oceanographic features and biological productivity in the Indian Ocean (Schott and
178
McCreary, 2001), with subsequent effects on tuna prey such as mesopelagic fishes (Vipin et
179
al., 2012). Hence, four distinct seasons were considered in subsequent analyses:
North-180
Eastern Monsoon (NEM) from mid-November to mid-March, South-Western Monsoon
181
(SWM) from mid-May to mid-September, Spring Inter-Monsoon (SIM) from mid-March to
182
mid-May, and Autumn Inter-Monsoon (AIM) from mid-September to mid-November.
183
However, season was excluded from area/season interaction tests because the sampling was
184
unbalanced between these two variables (Table S1) in relation to tropical tuna seasonal
185
migration (Kaplan et al., 2014).
186
A total of 27 NFA accounting each for >0.8% in all samples cumulated (i.e., the most
187
representative) were kept for statistical analyses and arc-sinus root squared transformed to
188
improve normality and homoscedasticity (Underwood, 1997). Permutational multivariate
189
analyses of variance (PERMANOVA) based on Euclidean distance matrix were first
190
performed on NFA profiles of muscle and liver separately to test the effects of species, size
191
class, area and season. Non-metric multidimensional scaling (NMDS), also based on the
192
Euclidean distance matrix, was then used to compare the samples through the relative
193
dissimilarity in NFA profiles among tested groups. NMDS is a rank-based approach that aims
194
to summarize the information provided by a large set of dimensions. Here, a set of three
195
dimensions was considered and an optimal configuration of the individuals was based on a
196
maximum limit value of 0.1 for the stress (i.e., goodness-of-fit index). The samples
197
coordinates in the three dimensions of the NMDS were subsequently used to investigate the
198
ontogenetic changes in NFA composition in each tuna species. Differences in individual NFA
199
compounds were assessed using Wilcoxon’s tests, pairwise tests being used when more than
Version postprint
two means were compared. Analysis of variance (ANOVA) was finally performed onδ13C,
201
δ15N and TLC, and followed by Tukey’s honestly significant difference (HSD) post hoc tests.
202
Ontogenetic changes in trophic tracers in each tissue were investigated for each species using
203
Generalized Additive Models (GAMs; Hastie and Tibshirani, 1990). FL was used as a proxy
204
of age because of the difficulties associated with age estimation in tropical tuna (Sardenne et
205
al., 2015a). Sex of the fish (S) and maturity stage (D) were included in the model in addition
206
to sampling area (A) and season (M) following:
207
(
i)
i i i i ii a s FL A M S D
T = + + + + + +
ε
,208
with T is the trophic tracer (δ13C, δ15N, TLC or NMDS scores of NFA profiles), a the
209
intercept, s the spline function smoother (with no preset value concerning the amount of
210
smoothing), i indicates individual fish of a given species, and ε is the random noise term
211
assumed to be normally distributed with mean zero and constant variance. The best model
212
was selected using Akaïke Information Criterion (AIC), and ANOVAs were used to detect
213
significant effects of covariates. When a significant size effect was detected on NFA profiles
214
in a given tissue, the initial model was also applied on the three main NFA families
(mono-215
unsaturated FA, MUFA; poly-unsaturated FA, PUFA; and saturated FA, SFA) and essential
216
NFA (i.e. 22:6ω3 (DHA); 20:5ω3 (EPA); 20:4ω6 (AA); 18:2ω6; 18:3ω3; Arts et al., 2001) to
217
investigate how they vary with size.
218
Species-specific indices of nestedness based on SI or NFA (i.e. convex hull areas or volumes)
219
were calculated to compare tuna’ trophic niches as described in Cucherousset and Villéger
220
(2015). Convex hull allows integration of organisms positioned at the edge of SI or NFA
221
niches. The indice of nestedness is the ratio between the niche volume shared and the minimal
222
volume filled by a group. It ranges between 0 and 1 with 0 indicating no overlap between the
223
trophic niches and 1 indicating a perfect overlap or a full inclusion of the lowest volume in the
224
larger one. It was computed on an isotopic two-dimensional standardized space, where each
225
axis was scaled to have the same range (e.g. 0–1) for each stable isotope (INes; Cucherousset
226
and Villéger, 2015), and on a NFA three-dimensional space (FANes), based on NMDS
227
coordinates. These two indices were calculated to compare species trophic niches, according
228
to size class and sampling area, using bootstrapping to overcome differences in the number of
229
individuals per species.
230
All statistical analyses were performed using R 3.0.2 software. The vegan library (Oksanen et
231
al., 2015) was used for PERMANOVA and NMDS and the mgcv library (Wood and Wood,
Version postprint
2015) was used for fitting GAMs. Indices of nestedness were calculated using the published R
233
code of Cucherousset and Villéger (2015).
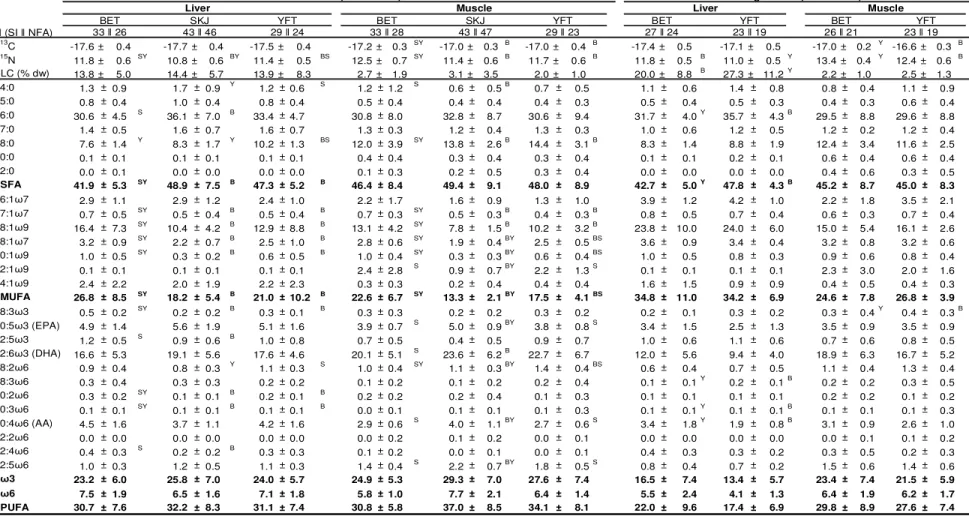
234 235 3. RESULTS 236 3.1. Inter-specific differences 237
3.1.1. Total lipid content comparisons
238
TLC was significantly higher in liver (15±8%) than muscle (3±2%, Tukey HSD, P<0.0001;
239
Table 1). Muscle TLC did not vary with season, area, size class or species (Table 2). Liver
240
TLC significantly varied with size class and season, but similarly to muscle, no inter-specific
241
differences were highlighted in liver samples either (Table 1). According to post-hoc Tukey
242
HSD comparisons, large tuna presented higher lipid-rich livers than small tuna (TLC =
243
22±11% and 14±6%, respectively, P<0.0001). Tuna liver was also characterized by
244
significant lower TLC during SIM than during the monsoon periods with tuna sampled during
245
this period being 4±7% leaner than during NEM (P<0.05) and 5±2% leaner than during SWM
246
(P<0.001). While ANOVA showed that there was a significant influence of area on TLC in
247
both tissues in each size class (Table 2), post-hoc tests detected no TLC differences between
248
area in each size class in liver (small and large size classes, P=0.80 and P=0.29 respectively)
249
and muscle (P=0.12 and P=0.05 respectively).
250 251
3.1.2. Neutral fatty acids profiles
252
NFA profiles for all tuna were consistently dominated by saturated compounds (means
253
ranging from 42 to 49%, Table 1), that remained constant across size classes. However,
254
varying importance of PUFA (17–37%) and MUFA (13–35%, Table 1) was observed. Among
255
the species, the most common NFA in both tissues, in decreasing order of importance, were
256
typically: 16:0 (32±7%), 22:6ω3 (DHA; 19±7%), 18:1ω9 (13±7%) and 18:0 (11±3%). There
257
were significant differences in NFA profiles between tissues, with muscle having higher
258
proportions of PUFA and especially of DHA than liver (PUFA: 33±9% vs. 29±9%, W=13379,
259
P<0.001; DHA: 21±7% vs. 17±6, W=10364, P<0.0001).
260
For both tissues, differences in NFA profiles were observed among size classes, species, areas
261
and seasons, in decreasing order of importance. Interactions among size classes and species
262
and among species and area were also detected in muscle (both P<0.05), when a significant
263
interaction between size classes and area was detected in liver (P<0.01; Table 2).
264
In both tissues, small tuna (≤100 cm FL) generally had higher proportions of PUFA (32±8%
265
in liver and 35±9% in muscle, the three species combined) than larger tuna (PUFA: 22±10%
Version postprint
in liver and 29±8% in muscle, YFT and BET combined; both p<0.0001), and especially of
267
essential PUFA (e.g. in liver: DHA: 18±5% vs. 12±6%; EPA: 5±2% vs. 3±2% and AA: 4±1%
268
vs. 3±2%). In contrast, MUFA were higher in large tuna, within both liver (32±10% vs.
269
21±8%, W=5315, p<0.0001) and muscle (25±6% vs. 18±6%, W=5442, P<0.0001). Levels of
270
SFA remained similar between size class: 46±7% in liver (W=2954, P=0.28) and 47±9% in
271
muscle (W=2886, P=0.16), with limited differences in individual SFA (mean difference <2%
272
for 15:0 and 17:0 in liver and 14:0, 18:0 and 20:0 in muscle).
273
Among the species, higher PUFA proportions were found in SKJ liver and muscle (32±8%
274
and 37±9%, respectively) than in the two other species (on average 27±9% and 31±8% for
275
liver and muscle respectively for YFT and BET, small and large specimens combined, all
276
P<0.0001). DHA mainly contributed to these inter-specific discriminations, with higher
277
proportions in SKJ (19±6% and 24±6% in liver and muscle, respectively), while BET and
278
YFT had similar proportions (on average 15±6% and 20±6% in liver and muscle,
279
respectively). In contrast, regardless of size class, in both tissues MUFA proportions were
280
highest in BET followed by YFT then SKJ (e.g. in liver, 30±10% in BET, 25±11% in YFT
281
and 18±5% SKJ, small and large specimens combined for BET and YFT, all P<0.05). Those
282
differences were mainly attributed to 18:1ω9, 18:1ω7 and 20:1ω9 (Table 1). Overall, SFA
283
were in comparable proportions among species, despite some specific differences in liver (e.g.
284
16:0 was higher, 36±7% in SKJ compared to 34±5% in YFT and 31±5% in BET small and
285
large specimens combined for BET and YFT).
286
The influence of sampling area on tuna’s NFA was highlighted by post-hoc Wilcoxon’s tests,
287
but different results were obtained for each tissue. Slightly higher proportions of SFA were
288
found in muscle of tuna from WCIO (47±9%) than those from MOZ (44±9%; W=4043,
289
P<0.05), while proportions of PUFA and MUFA were similar (P=0.15 and P=0.10). In tuna’
290
liver, proportions of PUFA were higher in MOZ (34±7%) than in WCIO (28±10%; W=1927,
291
P<0.005), mainly driven by changes in DHA (W=3714, P<0.01) but not EPA (P=0.09), the
292
second most relevant PUFA. In contrast, MUFA were higher in WCIO (25±11%) than in
293
MOZ (20±8%; W=3765, P<0.005) while proportions of SFA were the same (P=0.718).
294
Seasonal effects were observed in tuna’ liver due to variations in ω6 proportions between SIM
295
(7±2%) and SWM (6±2%; P<0.01) and in EPA proportions between AIM (6±2%) and NEM
296
(5±2%; P<0.05). Seasonal effects were also observed in tuna’ muscle largely due to
297
differences in MUFA proportions between SIM (22±6%) and NEM (18±7%; P<0.01).
298
Several interactions among factors influenced tissue NFA profiles. In liver, only an
299
interaction between size class and area was detected (Table 2). Thus, large YFT in the WCIO
Version postprint
had significantly different liver NFA profiles than similar sized YFT in the MOZ
301
(PERMANOVA, Pseudo-F=16.9, P<0.001), with on average 14% more MUFA than YFT
302
from MOZ (W=20, P<0.005), mainly attributed to 18:1ω9 (12% more; W=18, P<0.005), but
303
on average 15% less PUFA (W=137, P<0.001). In contrast, in the liver of small tuna almost
304
no differences between areas were detected: only ω6-PUFA family was found higher of 1% in
305
MOZ (MOZ: 8±1%, WCIO: 7±1%; W=2096, P<0.001).
306
In muscle, inter-specific size-relevant differences from both areas were detected. In small tuna
307
from WCIO, higher proportions of MUFA were reported in BET compared to YFT (mean
308
difference of 5%, P<0.05) and SKJ (mean difference of 9%, P<0.001). Such differences were
309
mainly attributed to 18:1ω9 (P<0.001). No significant inter-specific differences were detected
310
among small tuna for PUFA, ω3- and ω6-PUFA families, however there were significantly
311
higher contributions of EPA, DHA, AA, and 22:5ω6 observed in SKJ compared to both YFT
312
and BET (P<0.05) which showed similar profiles. Only one SFA, 18:0, was found to differ
313
among muscle of small tuna, with lowest proportions found in BET (12% of total NFA) than
314
in SKJ (14%, P<0.05) and YFT (14%, P<0.05). For large tuna in the WCIO, no differences in
315
NFA profiles were noted among species (PERMANOVA, Pseudo-F=1.0, P=0.36): only
316
18:3ω3 was found to differ inter-specifically in the muscle. Similar inter-specific
size-317
comparable differences were also detected among tuna sampled in the MOZ, with lower
318
proportions of PUFA recorded in BET muscle compared to SKJ (mean difference of 14%,
319
P<0.001) and YFT (mean difference of 8%, P<0.005), the highest proportions being measured
320
in SKJ muscle (e.g. DHA on average 8% and 5% lower in BET than SKJ and YFT
321
respectively). The highest MUFA proportions were observed in BET and the lowest in SKJ,
322
mainly attributed to the 18:1ω9, on average 5% higher in BET than in SKJ for muscle
323
(P<0.05).
324 325
3.1.3. Stable isotope values
326
δ13C values varied with area and size class in liver and by size class, species and season in
327
muscle. δ15N values significantly varied with area, season, species and according to a
species-328
area interaction in both tissues, but varied with size class in muscle only and with a size
class-329
species interaction in liver (Table 2).
330
Muscle δ13C values were slightly lower during NEM (-17.1±0.2‰) than AIM (-16.8±0.2‰)
331
and SWM (-16.9±0.4‰) (P<0.05) but no difference was observed in liver. δ15N values in tuna
332
muscle were significantly higher in WCIO (12.2±0.9‰) than in MOZ (10.2±1.3‰, P<0.001),
333
with a similar trend displayed in the liver (WCIO: 11.4±0.7‰; MOZ: 9.3±1.2‰, P<0.001).
Version postprint
δ15N values in both tissues were lower during SIM than during the other seasons (i.e. in liver:
335
mean value in SIM was 1.9‰ lower than AIM, 1.8‰ lower than NEM and 1.6 ‰ lower than
336
SWM, P<0.001; and in muscle: mean value in SIM was 1.3‰ lower than AIM, 1.0‰ lower
337
than NEM and 1.5% lower than SWM, P<0.001).
338
Size-class differences were reported for both δ13C and δ15N values in muscle with higher
339
values reported in large tuna in comparison to small tuna (mean difference of 0.2‰ and 0.8‰
340
respectively, P<0.001). In liver, δ13C values were significantly higher in large tuna than in
341
small tuna (mean difference of 0.3‰, P<0.001), but no difference in δ15N values was
342
observed (P=0.784).
343
Inter-specific size-comparable differences from the WCIO were found using post-hoc Tukey
344
HSD comparisons. In small tuna, δ13C values were slightly lower in BET compared to YFT
345
and SKJ in muscle (mean difference of 0.2‰, P<0.01), while no inter-specific differences
346
were detected in liver (both P>0.1). In contrast, δ15N values were significantly higher in BET,
347
closely followed by YFT, and finally SKJ in both tissues (Table 1), with mean differences
348
among species ranging from 0.3 to 1.1‰ (P<0.05, except between BET and YFT in muscle:
349
P=0.12). In large tuna, significantly lower δ13C values were found in BET muscle than in
350
YFT muscle (on average 0.5‰, P<0.001), while the low differences (of 0.2‰) in liver were
351
not significant (P=0.09). BET presented significantly higher δ15N values than YFT for both
352
tissues (on average 1‰ and 0.8‰ higher, respectively, P<0.001). In MOZ, δ13C values were
353
slightly lower in small BET compared to small YFT and SKJ, as in WCIO (mean difference
354
of 0.2‰, P<0.05). On the contrary, small BET had higher muscle δ15N values ( 1.7‰ higher)
355
than YFT (P<0.005) and SKJ (P<0.001), while small YFT and SKJ exhibited similar muscle
356
δ15N values (P=0.986). In liver, the highest δ15N values were recorded for small BET
357
followed by small YFT and finally SKJ, with mean differences ranging from 0.7 to 1.9‰
358
(P<0.05). Post-hoc Tukey HSD comparisons revealed significantly lower δ15N values in large
359
YFT from MOZ than in large YFT from WCIO in muscle and liver (mean difference of
360
2.3‰, P<0.001 and 1.9‰; P<0.001, respectively). δ13C values in muscle of large YFT were
361
also lower in MOZ than in WCIO (mean difference of 0.3‰, P<0.001), while no difference
362
was detected in liver (P=0.386).
363 364
3.1.4. Biochemical trophic niche metrics
365
Trophic niche overlap based on SI (INes) and FA (FANes) was explored among the three tuna
366
species differentiating patterns between tissues, size classes and sampling areas. In WCIO,
367
index values showed less variation in liver (ranging from 0.30 to 0.81) than in muscle (0.09 to
Version postprint
0.81, Table 3), while they were similar in MOZ (from 0.08 to 0.73 in liver and from 0.06 to
369
0.63 in muscle). Although some differences were evident between INes and FANes, the
370
degree of overlap among species agreed, with the lowest trophic space shared by BET and
371
SKJ.
372
According to these indices in both tissues of small tuna, and in particular muscle, SKJ and
373
BET shared limited trophic space, whereas the highest niche overlap was between BET and
374
YFT. Indeed, in muscle of small tuna sampled in the WCIO, the NFA niche volume defined
375
for YFT overlapped with that of BET, while the niche area of SKJ differed mainly due to
376
PUFA (Fig. 2a). A similar pattern was observed for INes in liver, with large overlap between
377
YFT and BET (0.81) due to higher δ15N values compared to SKJ (Fig. 3a). However, in
378
muscle, the highest INes was observed between small YFT and SKJ (0.81). In large tuna,
379
FANes in both tissues showed quite large trophic overlaps between BET and YFT (Table 3,
380
Fig. 2b). On the contrary, differences in INes were apparent with no overlap of trophic space
381
between large BET and YFT in muscle (INes=0.0) and a limited overlap in liver (INes=0.34)
382
(Fig. 3b).
383
In MOZ, SKJ and small YFT shared most of their trophic space, while small BET and small
384
YFT shared almost a third of their trophic space (with FANes and INes in both tissues ranging
385
from 0.40 to 0.73 and 0.29 to 0.44, respectively, Table 3). In comparison, small BET and SKJ
386
exhibited reduced overlaps according to both FANes and INes in both tissues.
387 388
3.2. Intra-specific variability focusing on ontogenetic and sexual shifts
389
3.2.1. Bigeye tuna
390
GAM predicted TLC in BET remained constant in muscle (3±2 % dw) while it generally
391
increased in liver with size from around 10 to 20% dw between 29.5 and 160.8 cm FL, with
392
no influence of other tested variables, as sex (Table S2). The dominance of the predicted
393
proportions of MUFA and PUFA (predominantly represented by 18:1ω9 and DHA
394
respectively) were reversed in liver at 91 cm FL with MUFA higher in larger individuals (Fig.
395
4a). Proportions of MUFA increased linearly with size, while PUFA proportions decreased
396
(23.6% of deviance explained with size alone), mainly due to a decrease of DHA proportion
397
in comparison to other essential NFA (Fig. 4b). No change was observed for SFA in liver,
398
which remained the main NFA class throughout the BET size range. Finally, deviance
399
explained for the main NFA families in BET muscle was poor (ranging from 5.3% for PUFA
400
to 23.4% for MUFA), but there was also a slight increase of MUFA proportion with size. No
401
influence of maturity or sex was observed in NFA in either tissues (Table S3a and S3b).
Version postprint
Predicted values of both isotopes were mainly affected by size and area in both BET tissues
403
(Table S2). Season also influenced δ13C values in both tissues, but no influence of sex or
404
maturity on isotopic data was observed. No clear pattern with size was obtained for liver δ13C
405
values, with a mean increase from around -18.2±0.2‰ to -17.4±0.2‰ between 30 and 76 cm
406
FL before oscillating around -17.4±0.5‰ until 160 cm FL (Fig. 5a). δ13C values in muscle
407
displayed an increase from 30 to 77 cm FL (from around -17.5±0.1‰ to -17.0±0.1‰) and
408
then remained constant at -17±0.1‰ until 160 cm FL (Fig. 5b). Liver δ15N values slowly
409
increased with BET size between 30 and 69 cm FL (i.e. mean increase of 0.7‰ in 39 cm,
410
from around 11.3±0.2‰ to 12±0.1‰), then remained stable until 160 cm FL (Fig. 5a). In
411
muscle, the main variation of δ15N was observed from 30 to 54 cm FL (i.e. mean increase of
412
1.7‰ in 24 cm, from around 11.0±0.2 to 12.7±0.2‰), followed by relatively constant values
413
until 140 cm and a slight increase between 140 and 160 cm (i.e. from around 13.4±0.2‰ to
414 13.7±0.3‰; Fig. 5b). 415 416 3.2.2. Yellowfin tuna 417
TLC in YFT muscle and liver was affected by size (Table S2) but with unpredictable trends,
418
and the fitted GAM performed poorly for muscle with only 11.6% of deviance explained. In
419
liver, TLC oscillated with size, and males had a slightly higher TLC than females and
420
indeterminate individuals combined (23±11% vs. 15±8%, P<0.05). NFA profiles were mainly
421
affected by size (Table S3a). In liver, the mean proportions of MUFA and PUFA were
422
reversed at 109 cm FL (Fig. 4a): MUFA increased by about 20% from 109 to 160 cm FL
423
(from around 50% to 70%), when PUFA subsequently decreased (from around 55% to 35%).
424
Size explained 38% of MUFA and 51.5% of PUFA variability in liver, but showed minor
425
influence on SFA (Table S3b). Among PUFA, three essential NFA contributed strongly to the
426
observed PUFA decrease with size in liver: DHA, EPA and AA (Fig. 4b). Although minor
427
contributors, 18:3ω3 and 18:2ω6 also significantly decreased with size (P<0.0001). In muscle,
428
PUFA and SFA generally remained constant with size (38±3% and 44±5%, respectively). In
429
contrast, size explained 58.4% of MUFA variability in muscle with proportions showing a
430
progressive increase from 14±2% at 32 cm FL to 29±2% at 157 cm FL. Despite a maturity
431
influence in NFA profiles of liver and muscle, no influence was detected when considering
432
the main NFA families individually (Table S3b). Isotopic compositions in both tissues were
433
influenced by all tested variables, with the exception of sex. In liver, GAM predicted δ13C
434
values increased ca. -17.7±0.1‰ to -16.6±0.2‰, and δ15N values from ca. 12.1±0.2‰ to
435
12.5±0.3‰ ‰ between 29 and 157 cm FL (Fig. 5a). In muscle, minor variations of δ13C
Version postprint
values were observed over the range size (<0.6‰), while δ15N values strongly increased
437
between 29 and 53 cm (from 10.7±0.3‰ to 12.9±0.3‰), then progressively increased until
438
157 cm to reach 13.9±0.4‰, with a stronger increase between 140 and 157 cm (Fig. 5b).
439
Muscle δ13C values were also highest in YFT spawning (-16.5±0.2‰) compared to those
440 developing (-17±0.3‰, P<0.001). 441 442 3.2.3. Skipjack tuna 443
GAM predicted TLC was not affected by any of the tested variables in muscle of SKJ (Table
444
S2) but varied with size in liver (min–max=2–30% dw), despite no obvious trend observed. In
445
SKJ tissues, differences in NFA profiles were mainly attributed to sex and area, whereas size
446
had no significant influence in muscle and a limited influence in liver (Table S3a). There was
447
also no influence of maturity in both tissues (Table S3a). Wilcoxon tests revealed that the
448
liver of females contained more SFA (53±7% vs. 46±7%; W=218, P<0.05), mainly 16:0
449
(W=238, P<0.005), and more MUFA than males (21±5% vs. 15±5%; W=240, P<0.005)
450
mainly 16:1ω7 (W=250, P<0.001) and 18:1ω9 (W=234, P<0.01) (Table S4). In contrast, liver
451
of males had higher relative amounts of essential NFA including EPA, DHA and AA (all
452
P<0.01; Table S4) than females: mean differences between males and females ranged from
453
1% for 22:5ω6 to 8% for DHA (Table S4). PUFA proportion in liver was higher in males and
454
indeterminate individuals (W=201, P<0.05) than in females (W=173, P<0.001, Table S4).
455
In contrast, no differences in isotopic compositions were observed between sexes in either
456
tissue (Table S4). No clear trend was observed for δ13C values which remains overall constant
457
(around -17.5‰ in liver and -17‰ in muscle), whereas δ15N values increased by 2.0‰ in
458
muscle from 11‰, and by 1.1‰ in liver from 11.1‰ between 30 and 78 cm FL (Fig. 5). For
459
both isotopic values in both tissues, no influence of maturity was noted (Table S2).
460 461
4. DISCUSSION
462
Using complementary trophic tracers, this study provides greater understanding of trophic
463
relationships and food partitioning among tropical tuna from the Western Indian Ocean. Due
464
to their biological proximity and habitat sharing, overlaps in their trophic niches were
465
detected, especially in NFA compositions of large individuals (Fig. 2b). However, significant
466
inter- and intra-specific differences were also noticed: higher PUFA proportions in SKJ than
467
in small BET and YFT (Fig. 2a); separated isotopic niches occupied by large YFT and BET
468
(Fig. 3b); increased MUFA proportions with size in the liver of BET and YFT (Fig. 4), while
469
a difference between sexes was observed only in SKJ (higher PUFA proportions in males).
Version postprint
471
4.1.FA and SI compositions of tuna prey
472
The origins of these inter-specific differences are likely explained through the FA and SI
473
compositions of their main prey and this section gives an overview of these compositions,
474
used in the following sections. Only a few studies report NFA profiles for tuna prey in the
475
Western Indian Ocean, but some information exists for other oceans. High MUFA proportions
476
are characteristic of myctophid fishes (Saito and Murata, 1998), including in tropical waters
477
(Sebastine et al., 2011; Baby et al., 2014), due to their high consumption of copepods rich in
478
20:1 MUFA (Saito and Kotani, 2000). Myctophids are small pelagic fishes, inhabiting deep
479
layers (over 400 m) during the day and that migrate to surface layers (around 5-100 m) each
480
night to feed (Vipin et al., 2012). They are important prey of squids. Indeed, middle-sized
481
squid Sthenoteuthis oualaniensis, a common tuna prey in the region under study (Ménard et
482
al., 2013), ascends between the surface and 100 meters depth only at night to feed on
483
myctophids (Shulman et al., 2002). Despite S. oualaniensis feed on myctophids rich in
484
MUFA, its mantle contains high proportions of DHA (Shulman et al., 2002) and PUFA (52%
485
of total FA; Young et al., 2010a). Cigarfish C. pauciradiatus is another small fish prey rich in
486
MUFA (Young et al., 2010a), on which YFT mainly forage during the NEM period in WCIO
487
(Zudaire et al., 2015). Globally, less information is available concerning the FA profile of
488
crustaceans, including the swimming crab Charybdis smithii and the stomatopod Natosquilla
489
investigatoris, that are also known prey of tropical tuna (Potier et al., 2004). In the Pacific
490
Ocean a related crab species, Charybdis hawaiiensis, is reported to be mainly composed of
491
PUFA (42% of total FA) (Piché et al., 2010). In addition, C. smithii come up in surface layers
492
mainly at night in the Indian Ocean (Romanov et al., 2009), while N. investigatoris was
493
occasionally found in surface layers at daytime (Losse and Merrett, 1971).
494
In contrast to NFA profiles, isotopic data of the main tuna prey groups were available for the
495
Western Indian Ocean, but more so for the Mozambique Channel. Squids and small fishes
496
have been shown to occupy similar trophic levels with mean δ15N values around 9.4±0.8‰
497
and 9.5±1.6‰, respectively, while crustaceans occupy a slightly lower trophic level with
498
mean δ15N values around 8.7±1.3‰ (Ménard et al., 2014). However, a great variability was
499
observed among the small fishes: cigarfish had lower mean δ15N values (9.0±2.2‰) than most
500
myctophids such as Diaphus metopoclampus with higher δ15N values (12.2±0.4‰) but lower
501
δ13C values (-19.3±0.2‰; Ménard et al., 2014). δ15N values of main tuna prey have also been
502
shown to increase with size (in myctophids, the cigarfish and squid S. oualaniensis; Parry,
503
2007; Ménard et al., 2014). However, limited variability in δ13C values are displayed among
Version postprint
tuna prey with mean values ranging from -18.6±0.4‰ in small fish to -18.2±0.6‰ in
505
crustaceans. This suggests that any differences in δ13C values in tuna from this area should be
506
interpreted with caution.
507 508
4.2.Trophic partitioning in tuna aggregations
509
Total lipid content data suggests that none of the three tuna species appears to store lipids in
510
muscle, as TLC values remained low and did not vary with the considered factors. The liver
511
showed more variability in TLC, which was mainly explained by season and size class
512
differences, suggesting this organ could be used to store lipids. In the three species, fattest
513
livers were sampled during the two monsoon periods; however, modest seasonal differences
514
were detected in SKJ. This could be related to a specific diet during monsoons, as YFT have
515
been recorded to forage predominantly on fatty small fishes (7-39% dw of lipids; Young et
516
al., 2010a), such as C. pauciradiatus during NEM in the studied region (Zudaire et al., 2015).
517
Partial niche overlaps were observed in the liver of small tuna (Fig. 2a and 3a). As tuna still
518
form multispecific schools, partial trophic sharing does not appear to reduce the advantages of
519
schooling behavior (e.g. reduced predation, faster food detection; Pavlov and Kasumyan,
520
2000). When trophic niches are large (i.e., diet behaviors of individuals are diverse in each
521
species), diet overlap among species does not really increase the competition intensity among
522
them, because only a few individuals in each species are impacted; Bolnick et al. (2011)
523
called this “niche complementarity”. This phenomenon might reduce predator-prey
524
dependency and dampen consumers-resources oscillations (McCann et al., 1998), which may
525
offer a long-term advantage in nutrient poor habitats such as tropical offshore waters. As these
526
small tuna were caught under drifting fish aggregating devices, the use of which has recently
527
intensified (Chassot et al., 2015) and is thought to act as an ecological trap (e.g. Hallier and
528
Gaertner, 2008), the possibility that devices promote competition among small tuna cannot be
529
excluded (Jaquemet et al., 2011)
530
Calculated FANes showed greater trophic overlap between YFT and BET than between YFT
531
and SKJ, mainly based on differences in MUFA and PUFA proportions. The high proportions
532
of PUFA in SKJ suggest a lower consumption of myctophids, squid consuming myctophids,
533
and small fish in general, but a higher consumption of crustaceans (see section 4.1 for details,
534
and Grande (2013) who investigated stomach contents of SKJ in the Western Indian Ocean).
535
By contrast, PUFA proportions in small BET and in YFT suggest a low consumption of
536
crustaceans that seems to decrease with size with higher proportions of MUFA in large
537
individuals (Fig. 4a). In addition, mean δ15N values in both tissues were higher in small BET
Version postprint
than in small YFT and SKJ. This suggests that small BET likely feeding on prey with higher
539
trophic positions and/or of a larger size, as already observed by comparing the size of prey
540
from stomach contents of YFT and BET (Ménard et al., 2006). No studies have specifically
541
focused on tuna prey size distribution in the Indian Ocean, however, Potier et al. (2008)
542
noticed that surface YFT and BET fed more on smaller cigarfish than sub-surface YFT and
543
BET of the same size, and suggested ontogenetic changes in the depth distribution of
544
cigarfish. On the other hand, diving capacities differences among small tuna (further
545
discussed in section 4.3) also suggest the possibility of vertical sharing in mixed schools of
546
small tuna, with small BET occupying the deeper layers of schools.
547
In large tuna, only minor differences in the proportions of individual NFA were observed
548
(Table 1). This suggests that the two species BET and YFT fed on similar proportions of the
549
same prey species, which is in agreement with stomach content analyses of large tuna caught
550
by purse-seine (Potier et al., 2004). However, the stable isotope compositions were different
551
between these two species and suggested a higher trophic level in BET than in YFT (Fig. 3b).
552
As mentioned for small tuna, differences in prey size could explain differences in δ15N values
553
between large tuna. These results align with stomach content data from the same area, which
554
showed that squid and cigarfish individuals were larger in the stomachs of BET than similar
555
sized YFT (Potier et al., 2008; Ménard et al., 2013). The present study also reported large
556
MUFA proportions in the tissues of the larger tropical tuna (BET and YFT) which is likely
557
associated to direct consumption of myctophids or indirect myctophid consumption passing
558
through the digestive gland of various squids (Phillips et al., 2002; Pethybridge et al., 2013).
559
Indeed, large BET in deeper water layers have been found to feed more on squids than similar
560
sized YFT (Potier et al., 2004). As indicated by differences in δ13C values, we suspect that
561
BET fed, directly or indirectly (i.e., through squids), on specific myctophids, such as
562
D.metopoclampus, with lower δ13C values. The particular isotopic position of this myctophid
563
species might increase the isotopic position of large BET, which has higher δ15N values and
564
lower δ13C values than large YFT, in muscle and liver (Fig. 3b). Thus, despite large BET and
565
YFT co-occurring and focusing on similar prey groups in surface waters when caught by
566
purse-seine, in long-term (as integration times of trophic tracers used in the present study
567
approach several months; Budge et al., 2011; Madigan et al., 2012), a specific orientation
568
based on prey size and/or specific myctophids predators could limit their competition. In
569
addition, the same inter-specific differences in isotopic compositions were observed in both
570
tissues with different integration time (Fig. 3a). This suggests that the aggregations of large
Version postprint
individuals in mixed schools are not durable at the scale of isotopic turnover rates (around 6
572
months in muscle and 3 in liver; Madigan et al., 2012).
573
As noticed by Young et al. (2010b) in the Pacific Ocean for large individuals, diet differences
574
reflect diel variations in foraging among tuna, with large BET thought to feed more at night
575
than YFT, when myctophids and squids ascend from deeper layers (see section 4.1). In
576
contrast, SKJ feed mainly during the day, but night foraging has been reported (Romanov et
577
al., 2009; Grande, 2013). Such diel foraging behaviors may be reflected in the biochemical
578
signatures and suggest limited tuna competition. Indeed, considering the main tuna prey,
579
myctophids, squids and the crab C. smithii come up in surface layers mainly at night in the
580
Indian Ocean), whereas the stomatopod, N. investigatoris, could be found in surface layers at
581
daytime (see section 4.1) and in stomach content of surface tuna in Indian Ocean (Potier et al.,
582
2008; Grande, 2013). Thus, a myctophid dominant diet, as suggested in BET with the high
583
MUFA proportions, is probably more related to nocturnal feeding and/or twilight feeding.
584
Environmental variables (i.e., fishing area and season) influenced trophic tracers in both
585
tissues, attesting to their non-negligible impacts on tuna diet. For example, the cigarfish
586
constitutes most of the tuna diet in the Indian Ocean especially during NEM (Fonteneau et al.,
587
2008; Potier et al., 2008) and appears to be an important energy source in the reproduction of
588
YFT in WCIO (Zudaire et al., 2015). Although this could explain the higher MUFA
589
proportion in the liver of tuna from WCIO than from MOZ, the large variability among
590
individuals does not allow to properly characterizing these environmental influences.
591
Lower δ15N values were found in tuna from MOZ than from WCIO, as reported in previous
592
studies (Ménard et al., 2007; Zudaire et al., 2015). This is generally attributed to a lower base
593
line in Mozambique Channel (Ménard et al., 2007), due to diazotrophic organisms that lower
594
the δ15N value of particulate organic matter (Dupuy et al., 2016). An influence on NFA
595
profiles was also possible, as diatoms, with high EPA biosynthesis capacities, have been
596
shown to predominate in mesoscale eddies (e.g. Brown et al. (2008) in subtropical Pacific),
597
which are abundant in MOZ (Potier et al., 2014). In contrast, higher proportions of DHA,
598
characteristic of dinoflagellates, were found in liver of tuna from MOZ, suggesting a more
599
complex response to mixing events of nutrient, and overall a mixing signal through multiple
600
trophic levels from phytoplankton to higher trophic levels (Kainz et al., 2004).
601 602
4.3. Diet changes during tuna ontogeny
603
Patterns of NFA and SI observed in each tuna species were slightly different with size,
604
probably related to diet differences but also to physiological differences. For the three species,
Version postprint
the liver was found to be more informative than the white muscle to detect intra-specific
606
changes, as it is a reactive tissue to rapid diet changes in relation with fast turnover rates
607
(around 6 months in muscle and 3 months in liver for stable isotopes; Madigan et al., 2012).
608
In addition, TLC was relatively lower in white muscle than in liver, attesting to the known
609
role of liver in energy storage. Therefore, NFA profiles in muscle appear to be less
610
informative for ontogenetic studies in leaner fish such as these tropical tuna. By contrast,
611
NFA profiles in liver were found to be of valuable interest when examining dietary changes
612
with size.
613
In both BET and YFT, PUFA proportions decreased in liver with size while MUFA
614
concurrently increased (at around 91 and 109 cm in BET and YFT; Fig. 4a). In contrast, no
615
changes were observed with size in SKJ, but differences between sexes were noticed,
616
especially in liver, with higher PUFA proportion in males (Table S4). Two main hypotheses
617
could support differences among the tuna species: a biological process response (e.g.
618
reproduction) and/or a change of habitat (e.g. from surface to deeper layers). First, concerning
619
reproduction, the size at which 50% of the population matures was estimated at 100 cm FL
620
for BET in the Pacific Ocean (Farley et al., 2006), 75 cm for YFT (Zudaire et al., 2013) and
621
39 cm for SKJ (Grande et al., 2014), both studies from the Western Indian Ocean. Thereby,
622
PUFA of mature fish would be allocated to germinal cell production, especially in females.
623
Indeed, vitellogenin synthesis in ovary has been shown to require higher quantities of PUFA,
624
especially in EPA and DHA (Silversand and Haux, 1995). However, no significant influence
625
of maturity on the proportions of the main NFA classes was detected in this study. The
626
influence of reproduction on NFA profiles is however more likely in SKJ, as it has been
627
shown to be an income-breeder species, i.e. which reinvest the majority of its acquired energy
628
to reproduction, and breeding all year round (Grande et al., 2014). This suggests that in
629
females, PUFA from liver are rapidly allocated to the ovary after acquisition; while males
630
have fewer PUFA requirements and can store them into the liver explaining the higher
631
proportion of PUFA in males than in females SKJ observed in the present study, and,
632
potentially explaining higher TLC in liver of males. In the same way, in liver, PUFA
633
proportion was found to be higher in indeterminate individuals (i.e. the smaller fishes) than in
634
females (Table S4). Indeed, according to this assumption, PUFA would be allocated to the
635
gonads. These differences between sexes could also make females SKJ more sensitive to
636
environmental changes, especially if dietary essential PUFA become less available, as
637
predicted for the south west Pacific Ocean (Pethybridge et al., 2015a).
Version postprint
Concerning habitat usage, the shift in main NFA families in BET and YFT could correspond
639
to a habitat change for deeper environments providing rich-MUFA prey as myctophids or the
640
myctophids-predators squids, which inhabit deeper layers (see section 4.1). Indeed, this shift
641
could correspond to the sufficient development of the swim bladder and regional endothermy
642
(Graham and Dickson, 2004), allowing BET and YFT to reach deeper layers with size, while
643
SKJ is restricted to the surface due to the lack of swim bladder. Magnuson (1973) observed an
644
allometric growth of swim bladder for YFT until 8-10 kg, corresponding approximately to a
645
70-75 cm FL fish. Bertrand and Josse (2000), who observed larger swim bladder in BET than
646
in YFT at similar size, observed also an increase in the swim bladder volume over 120 cm FL
647
in BET. This would suggest that BET could reach deeper layers at smaller size than YFT, as
648
emphasized with the earlier shift in NFA profile observed in BET than in YFT (i.e., 91 vs. 109
649
cm FL).
650
δ15N values should be interpreted in context of specific differences in amino acids
651
composition that are nitrogen compounds (i.e. slow turnover of essential amino acids; Popp et
652
al., 2007), the tissue growth and the turnover rate (Martinez del Rio et al., 2009). Indeed, the
653
fast increase with size of δ15N values in muscle of the three species highlighted the influence
654
of metabolic process and the importance of selected tissue for the trophic level estimation in
655
food webs studies. In juvenile bluefin tuna, T. orientalis, Madigan et al. (2012) showed that
656
the half-lives of 15N in white muscle and liver were 167 and 86 days respectively, and 255 and
657
162 days for 13C, respectively, highlighting influences of turn-over on isotopic composition.
658
In addition, in different marine fish, a growth rate increase promotes a decrease of δ15N values
659
in muscle, and high metabolic levels promote a faster equilibration with diet (Trueman et al.,
660
2005).
661
In the three species, limited variations of δ13C values in muscle indicated no change of carbon
662
sources through life cycle. However, δ13C values in liver were more difficult to interpret due
663
to irregular variations, which could be related to metabolic activities as previously mentioned.
664
In both tissues, an increase in δ15N values with size was observed in the three species with a
665
strongest signal in muscle (Fig. 5). This increase could be linked to slowdown in growth rate
666
and/or to an increase of prey size. Indeed, tropical tuna are opportunistic feeders and the mean
667
size of their prey increased with tuna size (Ménard et al., 2006; Jaquemet et al., 2011),
668
besides, δ15N values of prey also increase with prey size (Ménard et al., 2014). Finally, in
669
BET and YFT, no breakpoints in isotopic values matched specific maturity or growth events,
670
although Zudaire et al. (2015) observed higher δ15N values in liver of spawning YFT.
671 672