HAL Id: hal-02319009
https://hal.archives-ouvertes.fr/hal-02319009
Submitted on 17 Oct 2019HAL is a multi-disciplinary open access archive for the deposit and dissemination of sci-entific research documents, whether they are pub-lished or not. The documents may come from teaching and research institutions in France or abroad, or from public or private research centers.
L’archive ouverte pluridisciplinaire HAL, est destinée au dépôt et à la diffusion de documents scientifiques de niveau recherche, publiés ou non, émanant des établissements d’enseignement et de recherche français ou étrangers, des laboratoires publics ou privés.
Optimization of aggregation-induced phosphorescence
enhancement in mononuclear tricarbonyl rhenium(I)
complexes: the influence of steric hindrance and
isomerism
Jinhui Wang, Alexandre Poirot, Béatrice Delavaux-Nicot, Mariusz Wolff,
Sonia Mallet-Ladeira, Jan Calupitan, Clémence Allain, Eric Benoist, Suzanne
Fery-Forgues
To cite this version:
Jinhui Wang, Alexandre Poirot, Béatrice Delavaux-Nicot, Mariusz Wolff, Sonia Mallet-Ladeira, et al.. Optimization of aggregation-induced phosphorescence enhancement in mononuclear tricarbonyl rhenium(I) complexes: the influence of steric hindrance and isomerism. Dalton Transactions, Royal Society of Chemistry, 2019, 48, pp.15906-15916. �10.1039/c9dt02786f�. �hal-02319009�
Dalton Transactions
PAPER
Cite this: DOI: 10.1039/c9dt02786fReceived 5th July 2019, Accepted 13th August 2019
Optimization of aggregation-induced phosphorescence enhancement in mononuclear
tricarbonyl rhenium(I) complexes: the influence of steric hindrance and isomerism
1Jinhui Wang,a,b,c Alexandre Poirot,a Béatrice Delavaux-Nicot,d,e Mariusz Wolff,f Sonia Mallet-Ladeira,g Jan Patrick Calupitan,h Clémence Allain,h Eric Benoista and Suzanne Fery-Forgues*a
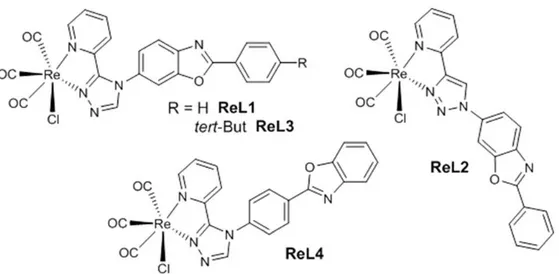
In order to improve the remarkable performance of a mononuclear tricarbonyl rhenium(I) complex (ReL1) that exhibits rare aggregation-induced phosphorescence enhancement (AIPE) behavior, two new complexes (ReL3 and ReL4) were prepared and investigated. They incorporate a 2-pyridyl-1,2,4-triazole (pyta) ligand connected to a 2-phenylbenzoxazole (PBO) moiety. Complex ReL3 differs from ReL1 by the presence of a bulky tert-butyl substituent, and ReL4 is an isomer where the PBO group is linked to the pyta ligand by its phenyl group. Theoretical calculations were in congruence with electrochemical and spectroscopic properties in solutions. Both new compounds exhibited strong AIPE and much better solid-state emission efficiency than ReL1, with photoluminescence quantum yields up to 55% for ReL4. Crystallographic data indicate that this increase in emission efficiency is due to optimum packing that prevents quenching. This work shows that minor structural changes may have major effects upon the solid-state spectroscopic properties and it provides a rational basis for accessing AIPE-active strongly emissive rhenium(I) complexes.
Introduction
Transition metal complexes that take advantage of aggregation to trigger light emission have been the subject of intense research in recent years for their potential applications as chemosensors, bioprobes, stimuli-responsive nanomaterials, and optoelectronic materials.1 Tricarbonyl rhenium(I) complexes have been known for a long time for their photoluminescence properties in solution,2 and their stability in air and water makes them appreciated cell imaging agents.3 In most cases, the predominant emission process is phosphorescence, whose long lifetime may bring benefits in terms of detection. The solid-state emission properties have also been studied, mainly in view of applications in the fields of optoelectronic and photonic devices.4 However, only rare examples of aggregation induced phosphorescence enhancement (AIPE) behavior have been reported, first concerning dinuclear5 and tetranuclear complexes,6 and more recently, mononuclear complexes.7 In a recent work, we showed that a mononuclear tricarbonyl rhenium(I) complex (ReL1, Fig. 1) exhibits clear AIPE behavior. In the solid state, this compound displays yellow to red emission, so it could be particularly valuable for preparing nanoparticles for bio-imaging, although the photoluminescence quantum yield is quite
1Electronic supplementary information (ESI) available: Experimental details, including proton numbering for NMR; crystal
packing, molecular views, and CIF data; additional computational, electrochemical and spectroscopic data. CCDC 1922851 and 1922852. For ESI and crystallographic data in CIF or other electronic format see DOI: 10.1039/c9dt02786f
a SPCMIB, CNRS UMR5068, Université de Toulouse III Paul Sabatier, 118 route de Narbonne, 31062 Toulouse cedex 9,
France. E-mail: sff@chimie.ups-tlse.fr
b Institute of Drug Discovery Technology, Ningbo University, Ningbo 315211, China
c State Key Laboratory of Chemical Oncogenomics, Key Laboratory of Chemical Biology, The Graduate School at Shenzhen,
Tsinghua University, Shenzhen, Guangdong 518055, PR China
d Laboratoire de Chimie de Coordination du CNRS, 205 route de Narbonne, BP 44099 F-31077 Toulouse Cedex 4, France e LCC-CNRS, Université de Toulouse, CNRS, Toulouse, France
f Institute of Chemistry, Department of Crystallography, University of Silesia, 9th Szkolna St., 40-006 Katowice, Poland g Service commun RX, Institut de Chimie de Toulouse, ICT- FR2599, Université de Toulouse III Paul Sabatier, 118 route de
Narbonne, 31062 Toulouse cedex 9, France
modest (0.065).8 The aim of the present work is now to improve the solid-state spectroscopic properties of these complexes through the rational design of the ligands.
To this end, two new compounds closely related to ReL1 were synthesized and studied. As a matter of fact, our previous study has revealed that ReL1, which incorporates the 3-(2-pyridyl )-1,2,4-triazole fragment, has superior emission properties compared to ReL2, built on the very popular 4-(2-pyridyl)-1,2,3-triazole fragment.8 The appended 2-phenylbenzoxazole (PBO) moiety contributes to the conjugated electron system of these complexes, and restrictions on its molecular movements in the solid state are thought to be mainly responsible for the AIPE effect. Moreover, for the vast majority of PBO derivatives, there is little π– π stacking interaction between aromatic groups, and hence an increased photoluminescence.9 In the first new complex (ReL3), the phenyl ring of the PBO moiety was substituted in position 4 with a tert-butyl group. The electronic structure is not expected to change with respect to ReL1, but the increased steric hindrance could influence the crystal packing mode, leading to differences in the solid-state emission properties.10 In the second complex (ReL4), the PBO moiety was connected to the pyta group by its phenyl ring. The substitution pattern of PBO is known to affect the emission properties in solution,11 so it is also expected to influence luminescence in the solid-state. The spectroscopic behavior of these two new compounds shows how simple structural modifications of the starting complex ReL1 may induce remarkable effects upon the solidstate emission properties. A thorough experimental and theoretical study supports these findings.
Figure 1. Chemical structures of the rhenium(I) complexes.
Results and discussion
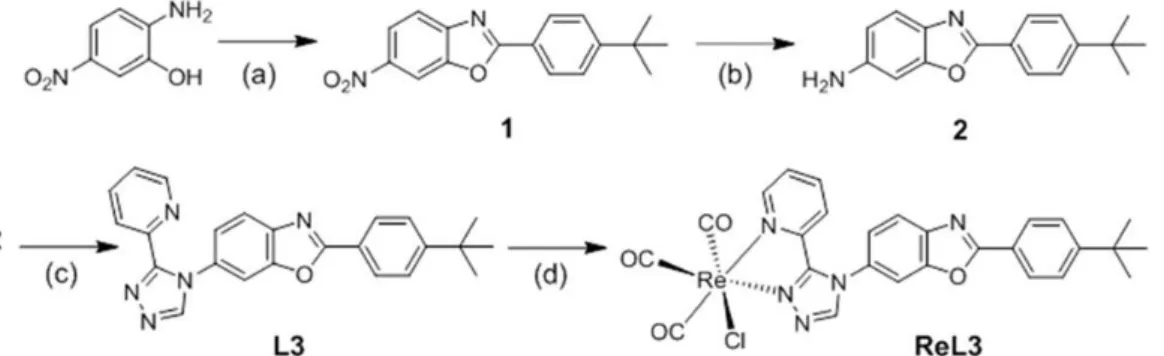
SynthesisComplexes ReL3 and ReL4 were obtained by following the synthesis pathways summarized in Fig. 2 and 3, respectively. Detailed procedures and characterizations are given in the Experimental section. On the one hand, 2-amino-5-nitrophenol was reacted with 4-tert-butylbenzoic acid to give 6-nitro-4′-tert-butyl-PBO (1), which then underwent a reduction process to afford the corresponding amine (2). On the other hand, 4′-amino-PBO (4) was directly obtained from the reaction of 2-aminophenol with 4-aminobenzoic acid in the presence of polyphosphoric acid. These amino derivatives were condensed with a hydrazonamide derivative (3) to give ligands L3 and L4 with an overall yield of 64% and 56%, respectively. These ligands were then reacted with [Re(CO)5Cl] in refluxing methanol to afford the corresponding tricarbonylrhenium(I) complexes ReL3 and ReL4 in good yields (71% and 92%, respectively). Ligands and complexes were unambiguously identified by 1H and 13C NMR spectroscopy, high resolution mass spectrometry and elemental microanalysis. The infrared spectra showed the characteristic ν(CO) stretching bands of the fac-[Re(CO)3]+ unit at 2028, 1920, 1883 cm−1
for ReL3, and 2021, 1934, 1887 cm−1 for ReL4. The average values (1943 and 1947 cm−1, respectively) suggest that, in these complexes, ligand L3 is a slightly better electron donor than L4, according to Sarkar’s theory.12
Figure 2. Synthesis of complex ReL3. Conditions and reagents: (a) 4-tertbutylbenzoic acid, polyphosphoric acid,
120 °C, 16 h (75%); (b) 10% Pd/C, H2, CH3OH/CH2Cl2, 6 bars, 24 h (82%); (c) N,N-dimethyl-N’-
picolinoylformohydrazonamide (3),8 acetic acid, CH
3CN, 90 °C, 24 h (64%); (d) [Re(CO)5Cl], MeOH, 65 °C, 16 h
(71%).
Figure 3. Synthesis of complex ReL4. Conditions and reagents: (a) 4-Aminobenzoic acid, polyphosphoric acid,
220 °C, 4 h (65%); (b) N,N-dimethyl-N’-picolinoylformohydrazonamide (3),8 acetic acid, CH
3CN, 90 °C, 24 h
(56%); (c) [Re(CO)5Cl], MeOH, 65 °C, 16 h (92%).
Crystal structures
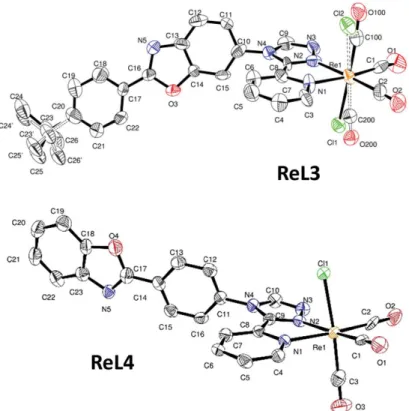
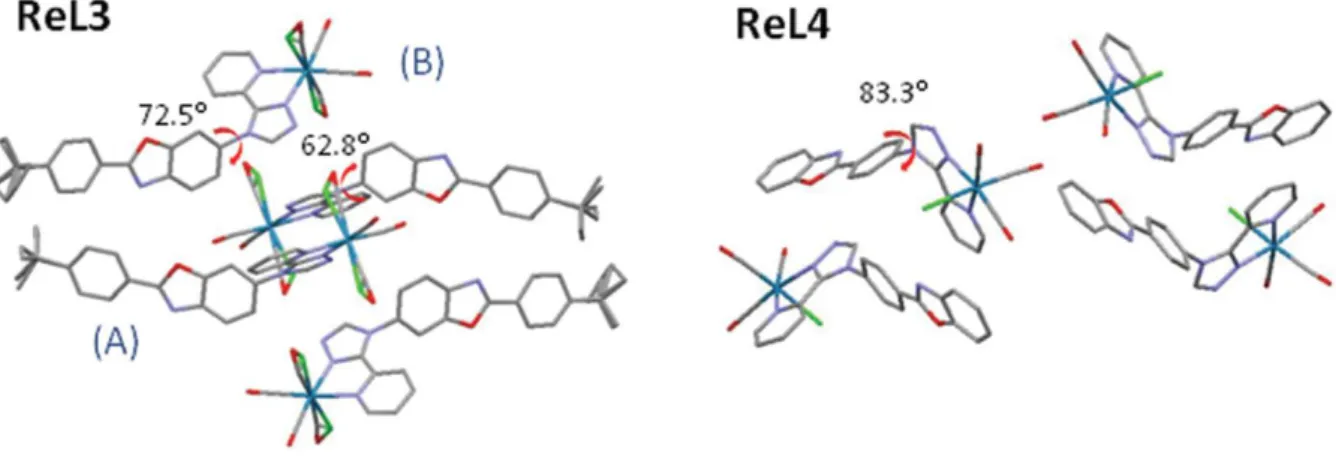
X-Ray quality crystals were obtained by diffusion of diethyl ether in DMF. Selected crystallographic data are given in the Experimental section, while bond lengths and angles are reported in Tables S1 and S2.† In both new complexes, the rhenium ion was coordinated to three carbonyl groups in a fac configuration, one chlorine atom, and two nitrogen atoms of the pyta ligand, with a moderate distortion of the octahedral geometry (Fig. 4). A comparison of the bond lengths and angles revealed that the structural modifications brought to ReL3 and ReL4 have little influence on the geometry of the coordination sphere with respect to ReL1. The benzoxazole and phenyl ring were almost aligned in the same plane. Complexes ReL3 and ReL4 retained the most characteristic feature of ReL1, i.e. the marked bending between the PBO moiety and the 1,2,4-triazole group. The angle value was 62.8(3)°/72.5(4)° for molecules A and B in the asymmetric unit of ReL3, and even reached 83.3(8)° for ReL4 (see Fig. 5). It is noteworthy that the PBO group only had one position with respect to pyta in ReL3 and ReL4, while two very distinct positions were detected in ReL1. The only disorder observed for ReL3 comes from the free rotation of the tert-butyl group, and from the permutation between the chlorine atom and one CO group, which generates two isomers in almost identical proportions. For ReL4, no ligand disorder was observed, except a N/O swap with a 75/25 ratio in the five-membered PBO ring.
Figure 4. Molecular views of complexes ReL3 (one molecule of the asymmetric unit) and ReL4. Disorders are
indicated by dashed lines and hydrogen atoms are not represented for the sake of clarity. Displacement ellipsoids are drawn at 50% probability
Regarding the molecular arrangement, complex ReL3 crystallized in the triclinic Pˉ1 space group with two molecules in the asymmetric unit. Both the inorganic moiety and the tert-butyl group strongly structured the network. In particular, the tert-butyl group was involved in several intermolecular short contacts with the oxygen atoms of the carbonyl groups, as well as with the carbon atoms of the pyridyl and phenyl groups of neighboring molecules. Other short contacts were found between the benzoxazole heteroatoms and the phenyl hydrogen atoms of neighboring molecules. To cope with the steric constraints due to the tert-butyl group and rhenium moiety, and minimize the neighboring interactions, the system adopts a head to head arrangement between two adjacent molecules, so that the rhenium centers and organic ligands constitute distinct layers (Fig. 5 and Fig. S1†). This arrangement is reminiscent of ReL1, with the major difference that in the latter complex the organic fragments are displayed in parallel planes with interactions occurring between triazole rings, while in ReL3 the organic moieties are arranged in different planes, so that no overlap of the aromatic systems was detected.
Complex ReL4 crystallized in the orthorhombic P212121 space group. The molecules formed antiparallel dimers (Fig. S1†). Certainly, switching the connection between the PBO moiety and the pyta group resulted in reduced steric hindrance with respect to ReL1, so that a head-to-tail arrangement is preferred. Dimers were themselves displayed in a herringbone manner. Only a tiny overlap was detected between the benzoxazole group of one molecule and the pyridyl group of the neighboring one (Fig. S2†). Consequently, π– π stacking interactions are significantly minimized with respect to ReL1.
Figure 5. Crystal cells of complexes ReL3 and ReL4. Hydrogen atoms not represented for the sake of clarity.
Electronic structure
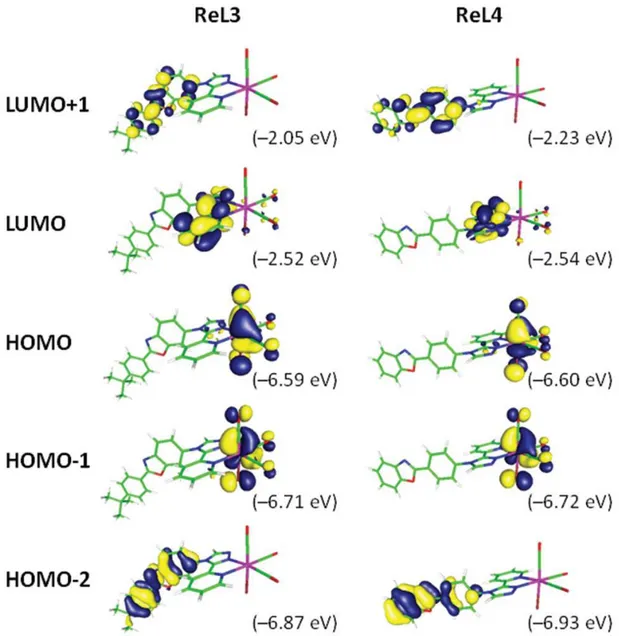
Computational studies based on the time dependent density functional theory (TD-DFT) method were performed considering the two complexes in dichloromethane (DCM). At the S0 ground state level, the energy-minimized structures were in good agreement with the data obtained by X-ray diffraction (Tables S3 and S4†). Differences can be related to packing effects, which are present in the X-ray determined structures and not taken into account by the calculation. The overall results show that both complexes are very similar from an electronic viewpoint (Tables S5 to S13†). The HOMO−2 and LUMO+1 are both centered on the PBO fragment, the HOMO−1 and HOMO are localized on the rhenium atom with contribution of the carbonyl and chlorine ligands, and the LUMO is localized on the pyta group (Table S5, Fig. 6, Fig. S3 and S4†). It is worth noting that the MOs of ReL3 and ReL1 are almost identical, indicating the very small contribution of the tert-butyl group. For ReL4, slight differences compared with ReL1 are found in the shape of PBO-centered orbitals, which change according to the connection to the triazole group. From an energetic viewpoint, both compounds have almost the same HOMO–LUMO gap. The first frontier orbitals have very similar energy levels, with the exception of the LUMO+1 that is slightly lower in ReL4 than in ReL3 (Fig. 6 and Fig. S5†).
Figure 6. Isodensity plots of selected frontier molecular orbitals involved in the first electronic transitions of ReL3 and ReL4 in DCM, according to TD-DFT calculations at the PBE1PBE/LANL2DZ/6-31+G** level of theory.
Electrochemical properties
The electrochemical behavior of the new complexes was studied by cyclic voltammetry (CV) and Osteryoung square wave voltammetry (OSWV) measurements in DCM at room temperature. In the OSWV anodic part, the ReL3 and ReL4 complexes were characterized by two oxidation processes around 1.44 and 1.74 V (Table S14, Fig. S7 to S12†). The former process can be assigned to an irreversible Re(I) oxidation process.13 The reversibility of this process was not improved by a decrease or an increase in scan rate. Considering the OSWV cathodic part, both new complexes presented a reduction process beyond −1.8 V, as did ReL1.8 This process was most likely attributed to the reduction of the PBO fragment, confirming that the latter is not involved in the complexation process.14 Indeed, a similar reduction process was detected for both ligands L3 and L4 (Table S14, Fig. S13 to S16†) and was also clearly visible by CV. At more anodic potential around −1.3 V, another reduction process was observed for the complexes. It can be attributed to the reduction process of the substituted triazole ring whose potential value may substantially decrease by complexation as observed in related compounds.13,15 Remarkably, the value of this first reduction process seems to be characteristic of this family of complexes incorporating a 2-pyridyl-1,2,4-triazole ligand8 and could be
related to the bent arrangement of the pyta and PBO moieties. In CV, the careful examination of the first reduction process at different scan rates showed that this process becomes quasireversible around 1 V s−1 for ReL3, as was the case for ReL1. For ReL4, the first reduction potential was 30 to 40 mV lower than for ReL3, and the rather uncommon quasi-reversibility of this process implying the pyta moiety was observed at a lower scan rate, i.e. 0.2 V s−1. Moreover, for both ReL3 and ReL4 complexes, a 1/1 intensity ratio was clearly evidenced between the first one-electron reduction process and the first one-electron oxidation process (Fig. 7).
All these trends are well supported by the TD-DFT calculations, which predict that the Re-centered HOMO on the one hand, and the pyta-centered LUMO on the other hand, are very close in energy for ReL1, ReL3 and ReL4. The experimental electrochemical HOMO–LUMO gap values (Eelg )16 found for the ReL3 and ReL4 complexes (2.55 and 2.50 eV, respectively) also fit very well with the calculated ones (2.70 and 2.65 eV) (Table S15†). Finally, compared to ReL1, the inversion of the PBO connection (ReL4) perturbed slightly more the electronic properties in solution than the addition of a tert-Bu group on the phenyl moiety (ReL3).
Figure 7. Segmented cyclic voltamograms of ReL3 (orange line) and ReL4 (green line) on a Pt working electrode
in CH2Cl2 + 0.1 M n[Bu4N][BF4] at room temperature and at a scan rate of 0.2 V s−1 toward anodic potentials.
UV-vis absorption spectra
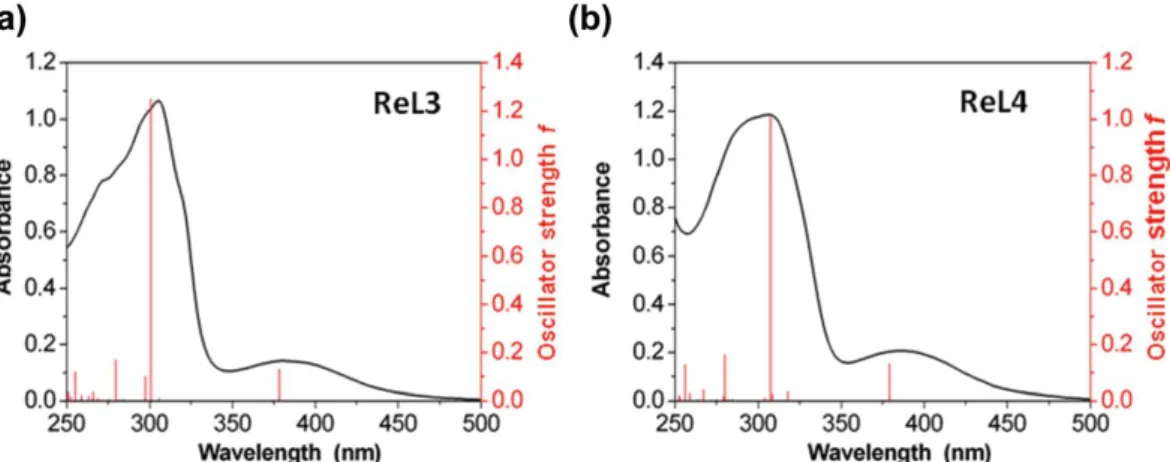
Experimentally, both complexes have very similar molar absorption coefficients and maximum absorption in various organic solvents (Table 1 and Table S17†). For instance, in DCM solutions, the absorption spectra showed an intense band around 305 nm and a distinct band of weak intensity above 380 nm, in good agreement with calculations (Fig. 8, Tables S6 and S7†). The main contributor of the highest energy band was identified as a transition between HOMO−2 and LUMO+1 (Table S5†) with strong intraligand charge transfer (ILCT) character. The lowest energy band results from an HOMO−1 → LUMO transition, and can thus be assigned to metal to ligand charge transfer (MLCT).
Figure 8. Experimental (black line) and simulated (red line) UV-vis absorption spectra of ReL3 (a) and ReL4 (b) in
dichloromethane
Emission properties
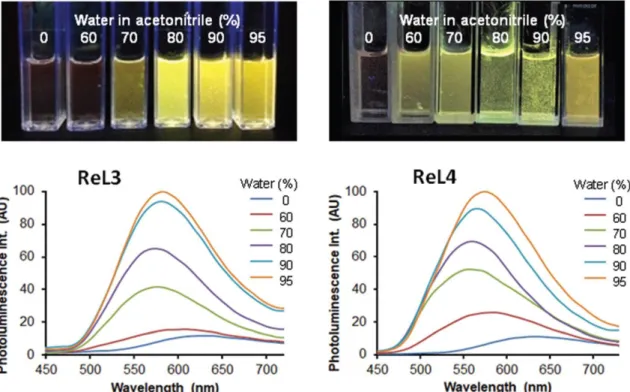
The photoluminescence spectra in organic solvents were recorded upon excitation in the MLCT band (380 nm). Bubbling with argon only led to a small increase of intensity. The excitation spectra resembled the absorption spectra (Fig. S17†). The emission spectra in DCM displayed an intense band centered on 627 nm for ReL3 and 632 nm for ReL4 (Table 1), with moderate quantum yields (0.017 and 0.012) and lifetimes of 80 and 100 ns (Fig. S18 and Table S16†), respectively. In acetonitrile and methanol, the emission spectra were shifted to short wavelengths and their intensity was slightly decreased (Table S17†). These spectroscopic properties are very close to those of ReL1. TD-DFT calculations predict that emission arising from the first triplet state should give bands peaking at 642.8 nm and 658.6 nm for ReL3 and ReL4 in DCM, respectively (Table S9†). The experimental data agree quite well with these values, and this red emission is therefore attributed to phosphorescence. It is noteworthy that the triplet states responsible for this emission have very similar electron distribution in both ReL3 and ReL4, with orbitals located on the rhenium center and its coordination sphere, including the pyta ligand (Fig. S5†). To highlight the AIPE effect, the complexes were dissolved in acetonitrile, and then the proportion of water was increased from 0 to 95%, while keeping the complexes at constant concentration. Under these conditions, the phosphorescence quantum yield was markedly increased about 9 times for both complexes (Fig. 9). This effect was accompanied by the formation of aggregates, which were detected by UV-vis absorption spectroscopy in media containing 60% water or more (Fig. S20†). The largest aggregates were also observed by fluorescence microscopy, which confirms their luminescence properties. We further noted that the AIPE effect appeared at lower complex concentration and lower proportion of water for ReL4 than for ReL3, probably due to solubility differences between the two compounds.
Regarding the position of the emission spectra, a two-step behavior was noticed, more pronounced for ReL4 than for ReL3. Indeed, the emission spectra first went from red to yellow-green with the water proportion passing from 0 to 80%, and then went back to orange-yellow for a higher proportion of water. The initial shift to short wavelengths may be attributed to a negative solvatochromic effect, similar to that observed for dissolved molecules with increasing the solvent polarity (Table S17†). This effect could arise from the large proportion of molecules situated at the surface of small aggregates, in contact with the medium. In contrast, the subsequent shift to long wavelengths could be assigned to a packing effect of bulk molecules, which become preponderant in large aggregates and are insensitive to solvent polarity.
The AIPE effect can be explained as follows. In solution, although limited by steric hindrance, movements of the PBO fragment with respect to the pyta group are possible, as well as the free rotation between the phenyl and benzoxazole rings of PBO. These movements may lead to a waste of excitation energy, hence to weak phosphorescence efficiency. The bimolecular quenching of phosphorescence by oxygen, although moderate in our case, acts in the same direction. In aggregates,
molecular movements are restricted and the access of oxygen is limited, resulting in the observed phosphorescence enhancement, provided that the molecular arrangement is compatible with the emission of light. It must be emphasized that the aggregates formed in the water/ acetonitrile mixtures are in contact with water molecules, and their crystallinity is unknown.
Table 1. Spectroscopic data of the complexes in organic solution and in the solid state. Maximum absorption
wavelength (λabs), maximum phosphorescence and photoluminescence wavelengths (λP and λPL),
phosphorescence and photoluminescence quantum yields (ΦP and ΦPL), τ main lifetime. For solutions, complex
concentration ∼3.5 × 10⁻⁵ M, λ
ex = 380 nm
Dichloromethanea Water/acetonitrile. 95 : 5 v/vb Solid state
Compounds λabs [nm] ε [M −1 cm −1] λP [nm] τ [ns] τ [ns] λabs [nm] λP [nm] ΦP λPL [nm] ΦPL τ[ns] ReL1c 296, 384 27 800, 3900 628 0.017 74.7 - - - 584d 0.065 338 ReL3 305, 383 33 400, 4300 627 0.017 100 310 582 0.090 565 0.21 890 ReL4 310, 388 29 600, 5100 632 0.012 80 30 574 0.090 542 0.55 563 a Samples bubbled with Ar for 5 min before measurements. b Undegassed solutions. c Data from ref. 8. d This work..
Figure 9. Bottom: Emission spectra of complexes ReL3 and ReL4 at 5.2 × 10⁻⁵ M and 3.6 × 10⁻⁵ M, respectively,
in acetonitrile solutions containing 0, 60, 70, 80, 90 and 95% water (from bottom to top), λex = 380 nm. Top:
Corresponding samples illuminated by a hand-held UV lamp (365 nm).
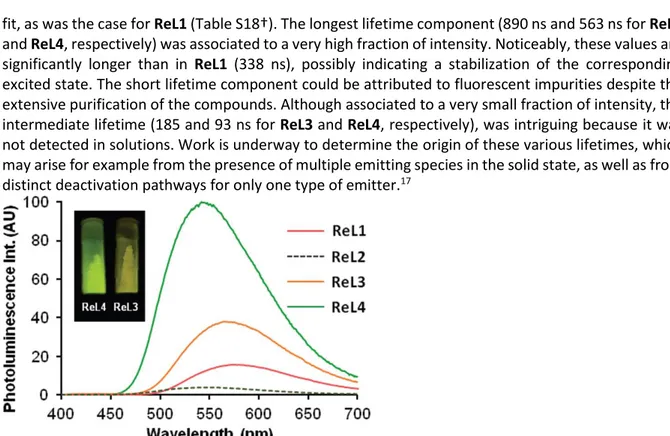
To complete this study, a comparison was made with the powders of ReL3 and ReL4, obtained by crystallization in methanol at the end of the synthesis process. Obviously, the spectroscopic properties of these microcrystalline compounds differed from those of solutions and aggregates. Upon illumination by a hand-held UV lamp, ReL3 emitted golden yellow light. Its solid-state emission spectra peaked at 565 nm (Fig. 10) and the photoluminescence quantum yield was 0.21, i.e. 14 folds higher than in DCM solutions. In contrast, ReL4 emitted bright yellow-green light under the UV lamp. The emission band peaked at 542 nm, with quantum yield as high as 0.55, almost 46 times higher than in DCM solutions. Therefore, the solid-state emission spectra of ReL3 and ReL4 were blue-shifted by 16 and 32 nm, and their photoluminescence efficiency was increased by 3 and 8 folds, respectively, with respect to ReL1. Decay measurements required three components for an acceptable
fit, as was the case for ReL1 (Table S18†). The longest lifetime component (890 ns and 563 ns for ReL3 and ReL4, respectively) was associated to a very high fraction of intensity. Noticeably, these values are significantly longer than in ReL1 (338 ns), possibly indicating a stabilization of the corresponding excited state. The short lifetime component could be attributed to fluorescent impurities despite the extensive purification of the compounds. Although associated to a very small fraction of intensity, the intermediate lifetime (185 and 93 ns for ReL3 and ReL4, respectively), was intriguing because it was not detected in solutions. Work is underway to determine the origin of these various lifetimes, which may arise for example from the presence of multiple emitting species in the solid state, as well as from distinct deactivation pathways for only one type of emitter.17
Figure 10. Comparative emission spectra of pristine powders of the four complexes: ReL1 (orange line), ReL2
(dashed green line), ReL3 (orange line) and ReL4 (green line). The intensity is proportional to the quantum yield. λex = 380 nm for ReL1 and ReL2, 355 nm for ReL3 and ReL4. Inset: Samples of ReL3 and ReL4 illuminated
by a hand-held UV lamp (365 nm).
Conclusions
It was shown here that the presence of the electron-donating tert-butyl group in ReL3 has very little influence on the geometry and behavior of this complex in organic solutions, with respect to ReL1. This is reminiscent of other photo-responsive compounds where tert-butyl groups placed at the periphery of the photoactive core preserve the electronic properties of the mother molecule in solution.18 Reversing the position of the PBO fragment on the pyta group in ReL4 also has little effect, as long as dissolved molecules are considered. However, remarkable differences between the complexes were observed in the solid-state emission properties. The introduction of a bulky substituent in a molecule is a strategy generally used to prevent molecular π– π stacking, which is extremely detrimental to the emission of light.19 The bulkiness and structuring effect of the tert-butyl group previously allowed us to improve the molecular arrangement, and hence the photoluminescence properties, of organic PBO and phenylnaphthoxazole derivatives.20 In the present case, the tert-butyl group of ReL3 prevented any π–π stacking interaction between the aromatic moieties, and led to much better solid-state emission properties with respect to ReL1. With regards to ReL4, attaching the PBO group to pyta via the phenyl ring led to a new crystal network, and strongly enhanced the photoluminescence efficiency, which is by far the best for this series of complexes. The solid state emission properties of mononuclear rhenium(I) complexes can therefore be significantly improved by introducing tiny molecular changes. The original molecular framework of ReL4 is prone to various chemical modifications, and with its superior optical properties, this complex should be the first member of a new series of highly emissive rhenium(I) luminescent probes.
Experimental section
General methodsAll purchased chemicals were of the highest purity commercially available and used without further purification. Analytical grade solvents were used and not further purified unless specified. Reactions
were monitored by analytical thin layer chromatography (TLC) on Kieselgel 60 F254 (Merck). Chromatography purification was conducted using silica gel or neutral alumina obtained from Merck. NMR, mass and infrared spectra were obtained in the relevant ‘Services communs de l’Institut de Chimie de Toulouse, Université de Toulouse III-Paul-Sabatier’. 1H- and 13C-NMR spectra were measured with Bruker Avance DRX 500 MHz or Bruker Avance 300 MHz. Attributions of the signals were made using 2D NMR data (COSY, HSQC and HMBC). Protons and carbon atoms were numbered according to Fig. S10.† App = Apparent; * = The multiplicity of the signal is more complex as it is part of an AA′XX′ system. Electrospray mass spectra were obtained using a QTRAP Applied Biosystems spectrometer and high-resolution mass spectra (HRMS) were recorded using an LCT Premier Waters spectrometer. Desorption chemical ionization (DCI) mass spectra (NH3 or CH4) were obtained on a DSQ II Thermofisher apparatus. Infrared spectra were obtained on a Nexus Thermonicolet apparatus with DTGS as the detector. The microanalyses were performed with a PerkinElmer 2400 elemental analyzer in the ‘Service d’Analyse Chimique du Laboratoire de Chimie de Coordination de Toulouse’ (LCC, Toulouse).
2-(4-tert-Butylphenyl)-6-nitrobenzoxazole (1). A mixture of 2-amino-5-nitrophenol (2.31 g, 15 mmol), 4-tert-butylbenzoic acid (2.67 g, 15 mmol) and polyphosphoric acid (24 g) was heated to 120 °C with stirring for 16 h. After reaction, iced water (100 mL) was added. The resulting mixture was neutralized with 10% NaOH solution and extracted with ethyl acetate (3 × 60 mL). All organic layers were combined, washed with water, dried over anhydrous MgSO4, filtered and concentrated to dryness. The residue was purified by column chromatography on silica gel using ethyl acetate/petroleum ether 1: 10 v/v, and 1 was obtained as a yellow solid (3.33 g, yield 75%). 1H NMR (300 MHz, CDCl3): δ (ppm) = 8.49 (d, J = 1.8 Hz, 1H), 8.33 (dd, J = 2.2, 8.8 Hz, 1H), 8.24–8.19 (m, 2H), 7.84 (d, J = 8.8 Hz, 1H), 7.61– 7.57 (m, 2H), 1.39 (s, 9H, t-Bu).
2-(4-tert-Butylphenyl)-6-aminobenzoxazole (2). To a solution of 1 (1.72 g, 5.8 mmol) in MeOH/CH2Cl2 (1: 2 v/v, 30 mL) was added 10% Pd/C (30% w/w, 0.52 g) and the mixture was stirred at room temperature for 24 h under 6 bars pressure of H2. After reaction, the mixture was filtered twice to remove the catalyst. The filtrate was concentrated to dryness and purified by column chromatography on silica gel using ethyl acetate/petroleum ether 1: 3 v/v as the eluent, to afford 2 as a pale white solid (1.27 g, yield 82%). 1H NMR (300 MHz, CDCl3): δ (ppm) = 8.12–8.08 (m, 2H), 7.53–7.50 (m, 3H), 6.87 (dd, J = 2.2, 0.5 Hz, 1H), 6.70 (dd, J = 8.4, 2.2 Hz, 1H), 1.36 (s, 9H, t-Bu). ESI-MS: m/z 267.1 ([M + H]+ calcd for C17H19N2O, 267.1).
N,N-Dimethyl-N′-picolinoylformohydrazonamide (3). A mixture of pyridine-2-carbohydrazide (0.82 g, 6 mmol) and N,N-dimethylformamide dimethyl acetal (1.06 mL, 8 mmol) in CH2Cl2 (20 mL) was stirred at reflux for 2 h. After the consumption of pyridine-2-carbohydrazide, the solvent was evaporated and the resulting precipitate was purified by column chromatography using CH3OH/CH2Cl2 1: 10 v/v as eluent to afford 3 as a yellow solid (1.09 g, yield 95%). 1H NMR (300 MHz, CDCl3): δ (ppm) = 10.04 (s, 1H, NH), 8.49 (ddd, J = 2.6, 1.7, 0.9 Hz, 1H), 8.19 (dt, J = 7.8, 1.1 Hz, 1H), 7.96 (s, 1H, HCvN), 7.83 (td, J = 7.6, 1.7 Hz, 1H), 7.38 (ddd, J = 7.6, 4.8, 1.3 Hz, 1H), 2.93 (s, 6H, 2CH3). DCI/NH3-MS: m/z 193.1 ([M + H]+ calcd for C9H13N4O, 193.1).
2-(4-tert-Butylphenyl)-6-(3-(pyridin-2-yl)-4H-1,2,4-triazol-4-yl) benzoxazole (L3). To a mixture of 2 (0.38 g, 1.4 mmol) and 3 (0.27 g, 1.4 mmol) in CH3CN (10 mL) was added acetic acid (1 mL). The resulting mixture was refluxed at 90 °C with stirring for 24 h. After cooling to room temperature, the mixture was concentrated to dryness and purified by column chromatography using CH3OH/CH2Cl2 1: 10 v/v as eluent to afford a light yellow solid. Then, the crude product was washed twice with methanol (2 × 10 mL) and dried in vacuum to afford L3 as a white powder (0.35 g, yield 64%). 1H NMR (500 MHz, DMSO-d6): δ (ppm) = 8.97 (s, 1H, H5′), 8.36 (ddd, J = 4.8, 1.8, 0.9 Hz, 1H, H6″), 8.15 (app. d*, J = 8.8 Hz, 2H, Hb,f), 8.10 (dt, J = 7.9, 1.1 Hz, 1H, H3″), 8.00 (dd, J = 2.0, 0.5 Hz, 1H, H7), 7.99–7.97 (m, 1H, H4″), 7.86 (dd, J = 8.4, 0.5 Hz, 1H, H4), 7.66 (app. d*, J = 8.8 Hz, 2H, Hc,e), 7.42 (ddd, J = 7.6, 4.8, 1.2 Hz, 1H, H5″),
7.39 (dd, J = 8.4, 2.0 Hz, 1H, H5), 1.34 (s, 9H, t-Bu). 13C NMR (125 MHz, DMSO-d6): δ (ppm) = 164.4, 155.9, 152.1, 150.2, 149.5, 146.9 (C3′), 142.1, 137.8, 132.8, 127.8, 126.8, 125.0, 124.4, 123.9, 123.8, 122.2, 120.0, 109.8, 35.4 (Cqt-Bu), 31.3 (CH3). DCI/CH4-HRMS: m/z 396.1813 ([M + H]+: calcd for C24H22N5O, 396.1824).
2-(4-Aminophenyl) benzoxazole (4). A mixture of 2-aminophenol (2.21 g, 0.02 mol), 4-aminobenzoic acid (2.75 g, 0.02 mol) and polyphosphoric acid (40 g, 0.4 mol) was stirred at 220 °C for 4 h. Distilled water (200 mL) was added to the mixture and a saturated solution of NaHCO3 was slowly poured into the solution until no bubbling was detected. After filtration, washing with water and drying, the solid obtained was sublimated at 240 °C under vacuum. Compound 4 was obtained as a pink solid (2.72 g, yield: 65%). 1H NMR (300 MHz, CDCl3): δ (ppm) = 8.12–8.01 (m, 2H), 7.76–7.65 (m, 1H), 7.58–7.48 (m, 1H), 7.33–7.27 (m, 2H), 6.82–6.70 (m, 2H). DCI/CH4-MS: m/z 211.09 ([M + H]+ calcd for C13H11N2O, 211.09).
2-(4-(3-(Pyridin-2-yl)-4H-1,2,4-triazol-4-yl)phenyl)benzoxazole (L4). Reacting 5 (0.42 g, 2.0 mmol) and 3 (0.38 g, 2.0 mmol) according to the procedure described for L3, L4 was obtained as a white powder (0.29 g, yield 43%) after purification on column chromatography (silica gel, ethyl acetate) and two washings with methanol. 1H NMR (500 MHz, DMSO-d6): δ (ppm) = 9.03 (s, 1H, H5′), 8.41 (ddd, J = 4.8, 1.8, 1.0 Hz, 1H, H 6″), 8.28 (app. d*, J = 8.5 Hz, 2H, Hb,f), 8.12 (dt, J = 7.8, 1.2 Hz, 1H, H3″), 8.02 (td, J = 7.6, 1.8 Hz, 1H, H4″), 7.86–7.81 (m, 2H, H4,7), 7.62 (app. d*, 2H, Hc,e d, J = 8.5 Hz), 7.49–7.43 (m, 3H, H5,6,5″). 13C NMR (125 MHz, DMSO-d6): δ (ppm) = 161.8, 151.8, 150.8, 149.5, 146.7, 146.5 (C3′), 141.9, 138.4, 138.0, 128.5, 127.3, 126.9, 126.3, 125.5, 125.1, 124.4, 120.5, 111.5. DCI/CH4-HRMS: m/z 340.1194 ([M + H]+ calcd for C20H14N5O, 340.1198).
General procedure for the preparation of tricarbonylrhenium(I) complexes
A mixture of ligand and [Re(CO)5Cl] (1.15 eq.) in methanol was stirred for 16 h at 65 °C. After consumption of the ligand, the mixture was cooled to room temperature and filtered, the precipitate was purified by chromatography on silica gel using ethyl acetate as eluent to afford the desired product.
ReL3. 130 mg (0.33 mmol) of L3 and 130 mg (0.36 mmol) of [Re(CO)5Cl] afforded ReL3 as a yellow solid (164 mg, yield 71%). 1H NMR (500 MHz, DMSO-d6): δ (ppm) = 9.30 (s, 1H, H5′), 9.10 (ddd, J = 2.2, 1.5, 0.8 Hz, 1H, H6″), 8.47 (br s, 1H, H7), 8.22 (app d*, J = 8.7 Hz, 2H, Hb,f), 8.13 (dd, J = 8.5, 0.5 Hz, 1H, H4), 8.07 (td, J = 7.9, 1.6 Hz, 1H, H4″), 7.76–7.74 (m, 1H, H5″), 7.72 (app d*, J = 8.8 Hz, 2H, Hc,e), 7.24 (ddd, J = 2.1, 1.2, 0.9 Hz, 1H, H3″), 1.36 (s, 9H, t-Bu). 13C NMR (125 MHz, DMSO-d6): δ (ppm) = 198.3, 197.7, 189.5 (CO), 165.4, 156.3, 155.1, 155.0, 150.7, 149.0 (C5′), 144.5, 144.3, 141.2, 129.1, 128.8, 128.1, 126.9, 124.6, 123.8, 123.5, 121.5, 115.1, 111.3, 35.4 (Cqt-Bu), 31.3 (CH3). DCI/CH4-HRMS: m/z 699.0806 ([M]+ calcd for C27H21N5O4185ReCl, 699.0812), m/z 664.1116 ([M − Cl]+ calcd for C27H21N5O4185Re 664.1123); Anal. calcd (%) for C27H21N5O4ReCl: C 46.25, H 3.02, N 9.99; found: C 45.97, H 3.53, N 10.08. IR(ATR): ν(CO) = 2028, 1920, 1883 cm−1.
ReL4. 130 mg (0.38 mmol) of L4 and 158 mg (0.44 mmol) of [Re(CO)5Cl] afforded ReL4 as a yellow solid (197 mg, yield 80%). 1H NMR (500 MHz, DMSO-d6): δ (ppm) = 9.33 (s, 1H, H5′), 9.11 (ddd, J = 5.4, 1.5, 0.7 Hz, 1H, H6″), 8.55 (app. dd*, J = 7.6, 1.3 Hz, 2H, Hb,f), 8.12 (td, J = 7.9, 1.5 Hz, 1H, H4″), 8.08 (app. br d*, 2H, 9 Hz, Hc,e), 7.92–7.87 (m, 2H, H7,4), 7.76 (ddd, J = 6.7, 5.5, 1.2 Hz, 1H, H5″), 7.54–7.47 (m, 2H, H5,6), 7.29 (dt, J = 8.1, 1.1 Hz, 1H, H3″). 13C NMR (125 MHz, DMSO-d6): δ (ppm) = 198.3, 197.7, 189.5 (CO), 161.4, 155.0, 154.8, 150.9, 148.5 (CH5′), 144.5, 141.8, 141.1, 135.2, 129.8, 129.5, 128.8, 128.6, 126.8, 125.8, 123.7, 120.7, 111.7. ESI/CH4-HRMS: m/z 608.0502 ([M − Cl]+ calcd for C23H13N5O4185Re 608.0497), m/z 649.0767 ([M − Cl + CH3CN]+ calcd for C25H16N6O4185Re 649.0763); Anal. calcd (%) for C23H13N5O4ReCl: C 42.83, H 2.03, N 10.86; found: C 42.58, H 1.98, N 10.62. IR(ATR): ν(CO) = 2021, 1934, 1887 cm−1.
X-ray crystallography
Crystal data were collected at 193 K on a Bruker AXS Quazar APEX II diffractometer using a 30 W air-cooled microfocus source (ImS) with focusing multilayer optics using MoKα radiation (wavelength = 0.71073 Å). Phi- and omega-scans were used. The structures were solved by direct methods (SHELXS 97) or using intrinsic phasing method (ShelXT).21,22 All nonhydrogen atoms were refined anisotropically using the leastsquare method on F2.22 Selected crystallographic data are collected in Table 2.
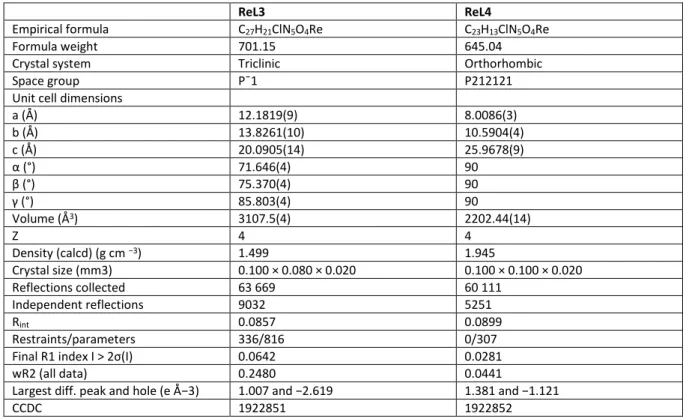
Table 2. Selected crystallographic data of complexes ReL3 and ReL4
ReL3 ReL4
Empirical formula C27H21ClN5O4Re C23H13ClN5O4Re
Formula weight 701.15 645.04 Crystal system Triclinic Orthorhombic Space group Pˉ1 P212121 Unit cell dimensions
a (Å) 12.1819(9) 8.0086(3) b (Å) 13.8261(10) 10.5904(4) c (Å) 20.0905(14) 25.9678(9) α (°) 71.646(4) 90 β (°) 75.370(4) 90 γ (°) 85.803(4) 90 Volume (Å3) 3107.5(4) 2202.44(14) Z 4 4 Density (calcd) (g cm −3) 1.499 1.945 Crystal size (mm3) 0.100 × 0.080 × 0.020 0.100 × 0.100 × 0.020 Reflections collected 63 669 60 111 Independent reflections 9032 5251 Rint 0.0857 0.0899 Restraints/parameters 336/816 0/307 Final R1 index I > 2σ(I) 0.0642 0.0281 wR2 (all data) 0.2480 0.0441
Largest diff. peak and hole (e Å−3) 1.007 and −2.619 1.381 and −1.121
CCDC 1922851 1922852
Computational details
The GAUSSIAN09 program package23 was employed for all calculations with the aid of the ChemCraft visualization program.24 The ground state (S0), the first excited state (S1) and the lowest triplet state (T1) geometries of compounds were fully optimized with the restricted and unrestricted density functional theory (R-DFT and U-DFT) method using the Perdew–Burke–Ernzerhof PBE1PBE functional without symmetry constraints.25 In all calculations, the “double- ζ” quality basis set LANL2DZ with Hay and Wadt’s relative effective core potential ECP (outer-core [(5s25p6)] electrons and the (5d6) valence electrons)26 was employed for the Re atom. The 6-31+g** basis set for H, C, N, O and Cl atoms was used.27 The solvent effect (dichloromethane, ε = 9.08) was simulated using the Self-Consistent Reaction Field (SCRF) under the Polarizable Continuum Model (PCM).28 The vibrational frequencies calculations were performed using the optimized structural parameters of compounds, to confirm that each optimized structure represents a local minimum on the potential energy surface and all eigenvalues are non-negative. On the basis of the optimized ground and excited state geometries, the absorption and emission properties were calculated by the time dependent density functional theory (TD-DFT) method at the PBE1PBE/LANL2DZ/6-31+G** level. These methods have already shown good agreement with experimental studies for different rhenium(I) complexes.29
Electrochemistry
The electrochemical properties of the new compounds were determined by cyclic voltammetry (CV) and Osteryoung square wave voltammetry (OSWV) in DCM. The solutions used during the electrochemical studies were typically 1 × 10⁻³ M in ligand or 6.5 × 10⁻³ M in complex, and 0.1 M in
supporting electrolyte. The supporting electrolyte (nBu4N)(BF4) (Fluka, 99% electrochemical grade) was used as received and simply degassed under Ar. DCM was dried using an MB SPS-800 solvent purification system just prior to use. The measurements were carried out with an Autolab PGSTAT100 potentiostat controlled by GPES 4.09 software. Experiments were performed at room temperature (r.t.) in a homemade airtight three-electrode cell connected to a vacuum/Ar line. The reference electrode consisted of a saturated calomel electrode (SCE) separated from the solution by a bridge compartment. The counter electrode was a Pt wire of ca. 1 cm2 apparent surface. The working electrode was a Pt microdisk (0.5 mm diameter). Before each measurement, the solutions were degassed by bubbling Ar and the working electrode was polished with a polishing machine (Presi P230). Under these experimental conditions, Fc+/Fc is observed at +0.55 ± 0.01 V vs. SCE. OSWVs were obtained using an amplitude of 20 mV, a frequency of 20 Hz, and a step potential of 5 mV.
Spectroscopy and photophysics
Dye solutions were prepared by gentle heating in a solvent, sonication and filtration on paper filter prior to measurement. Spectroscopic measurements in solutions were conducted at 20 °C in a temperature-controlled cell. UV-visible absorption spectra were recorded on a Hewlett Packard 8453 spectrometer. Fluorescence spectra in solutions were measured with a Xenius SAFAS spectrofluorometer using cells of 1 cm optical pathway. All fluorescence spectra were corrected. The fluorescence quantum yields in solution (ΦF) were determined using the classical formula:
ΦFx = (As × Fx × nx2 × ΦFs)/(Ax × Fs × ns2) where A is the absorbance at the excitation wavelength, F the area under the fluorescence curve and n the refraction index. Subscripts s and x refer to the standard and to the sample of unknown quantum yield, respectively. Coumarin 153 (ΦF =0.53) in ethanol was used as the standard.30 The absorbance of the solutions was equal or below 0.055 at the excitation wavelength. The error on the quantum yield values is estimated to be about 10%.
The solid state spectrum of ReL1, previously recorded on a Xenius SAFAS spectrofluorometer, was corrected using a homemade correction curve. Solid state spectra and photoluminescence quantum yields of ReL3 and ReL4 were recorded on a Fluorolog spectrofluorometer from HORIBA Scientific equipped with an integrating sphere. Solid samples were deposited on a metal support and luminescence spectra were corrected. The absolute photoluminescence quantum yield values (ΦP) were determined by a method based on the one developed by de Mello et al.,31 as described elsewhere.8 The error was estimated to be about 20%.
Fluorescence decays curves in dilute DCM solutions (Abs at λex < 0.1) were recorded by time-correlated single-photon counting method (TCSPC). Solutions were first bubbled with Ar for 5 min before measurements. An oscillating femtosecond titanium–sapphire laser (Tsunami, Spectra-Physics) pumped by a double Nd: YVO4 laser (Millenia Xs, Spectra-Physics) was used for excitation. Harmonic generators were employed to tune to λ ex = 380 nm. Emitted photons were detected at 90° through a monochromator by means of a Hamamatsu MC P 3809U photomultiplier connected to a SPC-630 TCSPC module from Becker and Hickl. The instrumental response function was recorded after each decay curve. The decay curves were analyzed with reconvolution and global non-linear leastsquares minimization method using the Globals software package developed at the Laboratory for Fluorescence Dynamics at the University of Illinois at Urbana-Champaign.
In the solid state, decay curves were measured by an LP920- K spectrometer equipped with a Xenon lamp (450 W pulse), a monochromator with 300 mm focus, and a photomultiplier (Hamamatsu R928). Quartz sample holders (0.2 mm) from Starna were used. The sample was excited by an oscillating Nd:YAG nanosecond laser (7–8 ns) with a repetition rate of 10 Hz at its third harmonic generation (355 nm). The instrumental response function was recorded with each set of decay curves. The data were analyzed with reconvolution using the L900 software.
Conflicts of interest
Acknowledgements
J. Wang thanks the Chinese Scholarship Council (CSC) for a PhD funding. The calculations were carried out in the Wroclaw Centre for Networking and Supercomputing, Poland (http://www.wcss.pl). We are also grateful to Dr Stéphane Balayssac for his help in interpreting NMR spectra, to Dr Alix Sournia-Saquet (LCC-CNRS) for electrochemical measurements and to Dr Rémi Métivier for fruitful discussions. J. P. Calupitan and C. Allain also thank the European Research Council for funding (ERC StG-715757 MECHANO-FLUO to C. A.), and thank Arnaud Brosseau (PPSM) for his help with the time-resolved fluorescence measurements.
References
1 ( a) V. Sathish, A. Ramdass, P. Thanasekaran, K.-L. Lu and S. Rajagopal, J. Photochem. Photobiol., C, 2015, 23, 25–44; (b) L. Ravotto and P. Ceroni, Coord. Chem. Rev., 2017, 346, 62–76.
2 M. Wrighton and D. L. Morse, J. Am. Chem. Soc., 1974, 96, 998–1003.
3 (a) L. C.-C. Lee, K.-K. Leung and K. K.-W. Lo, Dalton Trans., 2017, 46, 16357–16380; (b) K. K.-W. Lo, Acc. Chem. Res., 2015, 48, 2985–2995; (c) R. G. Balasingham, M. P. Coogan and F. L. Thorp-Greenwood, Dalton Trans.,
2011, 40, 11663–11674.
4 (a) M. V. Werrett, G. S. Huff, S. Muzzioli, V. Fiorini, S. Zacchini, B. W. Skelton, A. Maggiore, J. M. Malicka, M. Cocchi, K. C. Gordon, S. Stagni and M. Massi, Dalton Trans., 2015, 44, 8379–8393; (b) T. Klemens, A. ŚwitlickaOlszewska, B. Machura, M. Grucela, H. Janeczek, E. SchabBalcerzak, A. Szlapa, S. Kula, S. Krompiec, K. Smolarek, D. Kowalska, S. Mackowski, K. Erfurt and P. Lodowski, RSC Adv., 2016, 6, 56335–56352; (c) A. Świtlicka, T. Klemens, B. Machura, E. Schab-Balcerzak, K. Laba, M. Lapkowski, M. Grucela, J. Nycz, M. Szala and M. Kania, RSC Adv., 2016, 6, 112908–112918; (d) G.-W. Zhao, J.-H. Zhao, Y.-X. Hu, D.-Y. Zhang and X. Li, Synth. Met., 2016, 212, 131–141; (e) N. Azzarelli, S. Ponnala, A. Aguirre, S. J. Dampf, M. P. Davis, M. T. Ruggiero, V. Lopez Diaz, J. W. Babich, M. Coogan, T. Korter, R. P. Doyle and J. Zubieta, Inorg. Chim. Acta, 2019, 489, 301– 309.
5 (a) V. Sathish, A. Ramdass, Z.-Z. Lu, M. Velayudham, P. Thanasekaran, K.-L. Lu and S. Rajagopal, J. Phys. Chem. B, 2013, 117, 14358–14366; (b) B. Manimaran, P. Thanasekaran, T. Rajendran, R.-J. Lin, I.-J. Chang, G.-H. Lee, S.-M. Peng, S. Rajagopal and K.-L. Lu, Inorg. Chem., 2002, 41, 5323–5325; (c) Y.-J. Pu, R. E. Harding, S. G.
Stevenson, E. B. Namdas, C. Tedeschi, J. P. J. Markham, R. J. Rummings, P. L. Burn and I. D. W. Samuel, J. Mater. Chem., 2007, 17, 4255–4264; (d) V. Sathish, E. Babu, A. Ramdass, Z.-Z. Lu, M. Velayudham, P. Thanasekaran, K.-L. Lu and S. Rajagopal, Talanta, 2014, 130, 274–279.
6 E. Quartapelle Procopio, M. Mauro, M. Panigati, D. Donghi, P. Mercandelli, A. Sironi, G. D’Alfonso and L. De Cola, J. Am. Chem. Soc., 2010, 132, 14397–14399.
7 (a) Q. Wei, Y. Dai, C. Chen, L. Shi, Z. Si, Y. Wan, Q. Zuo, D. Han and Q. Duan, J. Mol. Struct., 2018, 1171, 786– 792; (b) M. T. Gabr and F. C. Pigge, Dalton Trans., 2017, 46, 15040–15047; (c) T. Tao, H. Fang, Y.-X. Peng, M.-D. Zhang and W. Huang, Inorg. Chem. Commun., 2017, 84, 15–19.
8 J. Wang, B. Delavaux-Nicot, M. Wolff, S. Mallet-Ladeira, R. Métivier, E. Benoist and S. Fery-Forgues, Dalton Trans. , 2018, 47, 8087–8099.
9 C. Carayon and S. Fery-Forgues, Photochem. Photobiol. Sci., 2017, 16, 1020–1035.
10 (a) Y.-X. Li, H. Zhang, M.-N. Yu, S.-S. Wang, Y.-R. Liu, D.-Q. Lin, L.-H. Xie, Z.-Q. Lin and W. Huang, Nanoscale,
2019, 11, 5158–5162; (b) L. Zhang, J. Liu, J. Gao, R. Lu and F. Liu, RSC Adv., 2017, 7, 46354–46357; M.-M. Shi,
V. C. Tung, J.-J. Nie, H.-Z. Chen and Y. Yang, Org. Electron., 2014, 15, 281–285.
11 (a) M. I. Knyazhanskii, P. V. Gilyanovskii and O. A. Osipov, Chem. Heterocycl. Compd., 1977, 13, 1160–1177; (b) R. Giménez, L. Oriol, M. Piñol, J. L. Serrano, A. I. Viñuales, T. Fisher and J. Stumpe, Helv. Chim. Acta, 2006, 89, 304–319.
12 L. Suntrup, S. Klenk, J. Klein, S. Sobottka and B. Sarkar, Inorg. Chem., 2017, 56, 5771–5783.
13 (a) R. Eychenne, S. Guizani, J.- H. Wang, C. Picard, N. Malek, P.-L. Fabre, M. Wolff, B. Machura, N. Saffon, N. Lepareur and E. Benoist, Eur. J. Inorg. Chem., 2017, 1, 69–81; (b) T. Y. Kim, A. B. S. Elliott, K. J. Shaffer, C. J. McAdam, K. C. Gordon and J. D. Crowley, Polyhedron, 2013, 52, 1391–1398.
14 Y. Zhao, R. Zhang, Y. Xu, H. Qi, X. Chen and C. Zhang, J. Electroanal. Chem., 2015, 739, 28–35.
15 (a) W. K. C. Lo, G. S. Huff, J. R. Cubanski, A. D. W. Kennedy, C. J. McAdam, D. A. McMorran, K. C. Gordon and J. D. Crowley, Inorg. Chem., 2015, 54, 1572–1587; (b) P. Datta, D. Sarkar, A. P. Mukhopadhyay, E. Lopez-Torrez,
C. J. Pastor and C. Sinha, J. Organomet. Chem., 2011, 696, 488–495.
16 (a) Y. Zhou, J. W. Kim, R. Nandhakumar, M. J. Kim, E. Cho, Y. S. Kim, Y. H. Jang, C. Lee, S. Han, K. M. Kim, J.-J. Kim and J. Yoon, Chem. Commun., 2010, 46, 6512–6514 and references therein; (b) G. V. Loukova, Chem. Phys. Lett., 2002, 353, 244–252.
17 A. Vlček, Top. Organomet. Chem., 2010, 29, 73–114.
18 J. P. Dela Cruz Calupitan, O. Galangau, O. Guillermet, R. Coratger, T. Nakashima, G. Rapenne and T. Kawai, Eur. J. Org. Chem., 2017, 2451–2461.
19 (a) S. P. Anthony, ChemPlusChem, 2012, 77, 518–531; (b) J. Cornil, D. Beljonne, D. A. Dos Santos, J. P. Calbert, Z. Shuai and J. L. Brédas, C. R. Acad. Sci., Ser. IV: Phys., Astrophys., 2000, 403–408.
20 (a) A. Ghodbane, P. Bordat, N. Saffon, S. Blanc and S. FeryForgues, Dyes Pigm., 2016, 125, 282–291; (b) A. Ghodbane, J. Colléaux, N. Saffon, R. Mahiou, J.-P. Galaup and S. FeryForgues, ChemPlusChem, 2013, 78, 185– 191.
21 G. M. Sheldrick, Acta Crystallogr., Sect. A: Found. Adv. , 2015, 71, 3–8. 22 G. M. Sheldrick, Acta Crystallogr., Sect. C: Struct. Chem., 2015, 71, 3–8.
23 M. J. Frisch, G. W. Trucks, H. B. Schlegel, G. E. Scuseria, M. A. Robb, J. R. Cheeseman, G. Scalmani, V. Barone, B. Mennucci, G. A. Petersson, H. Nakatsuji, M. Caricato, X. Li, H. P. Hratchian, A. F. Izmaylov, J. Bloino, G. Zheng, J. L. Sonnenberg, M. Hada, M. Ehara, K. Toyota, R. Fukuda, J. Hasegawa, M. Ishida, T. Nakajima, Y. Honda, O. Kitao, H. Nakai, T. Vreven, J. A. Montgomery, J. E. Peralta, F. Ogliaro, M. Bearpark, J. J. Heyd, E. Brothers, K. N. Kudin, V. N. Staroverov, R. Kobayashi, J. Normand, K. Raghavachari, A. Rendell, J. C. Burant, S. S. Iyengar, J. Tomasi, M. Cossi, N. Rega, J. M. Millam, M. Klene, J. E. Knox, J. B. Cross, V. Bakken, C. Adamo, J. Jaramillo, R. Gomperts, R. E. Stratmann, O. Yazyev, A. J. Austin, R. Cammi, C. Pomelli, J. W. Ochterski, R. L. Martin, K. Morokuma, V. G. Zakrzewski, G. A. Voth, P. Salvador, J. J. Dannenberg, S. Dapprich, A. D. Daniels, O. Farkas, J. B. Foresman, J. V. Ortiz, J. Cioslowski and D. J. Fox, Gaussian 09, Revision A.1, Gaussian, Inc., Wallingford CT, 2009.
24 G. Zhurko and D. Zhurko, ChemCraft 1.6, 2011, http://www.chemcraftprog.com/index.html. 25 J. P. Perdew, K. Burke and M. Ernzerhof, Phys. Rev. Lett., 1996, 77, 3865–3868.
26 (a) P. J. Hay and W. R. Wadt, J. Chem. Phys., 1985, 82, 270–283; (b) P. J. Hay and W. R. Wadt, J. Chem. Phys.,
1985, 82,299–310.
27 W. J. Hehre, L. Radom, P. V. R. Schleyer and J. A. Pople, Ab initio Molecular Orbital Theory, Wiley, New York, 1986.
28 (a) B. Mennucci and J. Tomasi, J. Chem. Phys., 1997, 106, 5151–2158; (b) M. Cossi, V. Barone, B. Mennucci and J. Tomasi, Chem. Phys. Lett., 1998, 286, 253–260.
29 G. Velmurugan, B. K. Ramamoorthi and P. Venuvanalingam, Phys. Chem. Chem. Phys., 2014, 16, 21157– 21171.
30 K. Suzuki, A. Kobayashi, S. Kaneko, K. Takehira, T. Yoshihara, H. Ishida, Y. Shiina, S. Oishi and S. Tobita, Phys. Chem. Chem. Phys., 2009, 11, 9850–9860.
![Figure 7. Segmented cyclic voltamograms of ReL3 (orange line) and ReL4 (green line) on a Pt working electrode in CH 2 Cl 2 + 0.1 M n[Bu 4 N][BF 4 ] at room temperature and at a scan rate of 0.2 V s −1 toward anodic potentials](https://thumb-eu.123doks.com/thumbv2/123doknet/13647494.428027/8.892.112.587.430.745/figure-segmented-cyclic-voltamograms-working-electrode-temperature-potentials.webp)