HAL Id: hal-03184137
https://hal.archives-ouvertes.fr/hal-03184137
Submitted on 29 Mar 2021HAL is a multi-disciplinary open access archive for the deposit and dissemination of sci-entific research documents, whether they are pub-lished or not. The documents may come from teaching and research institutions in France or abroad, or from public or private research centers.
L’archive ouverte pluridisciplinaire HAL, est destinée au dépôt et à la diffusion de documents scientifiques de niveau recherche, publiés ou non, émanant des établissements d’enseignement et de recherche français ou étrangers, des laboratoires publics ou privés.
Catalysis
Rinaldo Poli
To cite this version:
Rinaldo Poli. The Elucidation of Mechanisms in Homogeneous Catalysis. Comments on Inor-ganic Chemistry, Taylor & Francis, 2009, 30 (5-6), pp.177-228. �10.1080/02603590903423942�. �hal-03184137�
THE ELUCIDATION OF MECHANISMS IN HOMOGENEOUS CATALYSIS
RINALDO POLI
CNRS; Laboratoire de Chimie de Coordination; Université de Toulouse; UPS, INPT; Toulouse, France and Institut Universitaire de France, 103, bd Saint-Michel, 75005 Paris, France
Abstract
After a reminder of the definition of common terms used in catalysis and reaction mechanisms, different chapters highlight the various approaches used for the elucidation of catalytic mechanisms, each with its own advantages and limitations. Kinetics investigations define the rate law and provide information on certain features of the reaction pathway between the resting state and the transition state of the rate-determining step. The use of isotope labels is useful in three ways: through the measurement of kinetic isotope effects, through the study of the incorporation into the products (regio-, stereochemical features), and through the incorporation into the incompletely converted reactants (reversibility). The investigation of isolated intermediates, if available, gives experimental structural information and thermodynamic/activation data on selected stoichiometric steps of the catalytic cycle. In situ spectroscopic investigations help determine the chemical nature of the resting state and other low energy intermediates if carried out under catalytic conditions, or assist in the identification of other intermediates if performed under modified conditions on stoichiometric steps. Effects of the ligand modification on catalytic activity and selectivity also provide information on kinetically relevant steps. Finally, the application of computational methods is highlighted, with emphasis on the advantages and limitations of different computational strategies, the choice of basis functions and chemical model, and the handling of solvent models for the computation of thermodynamically and kinetically relevant parameters in solution.
Address correspondence to Rinaldo Poli, Laboratoire de Chimie de Coordination, 205, route de Narbonne, F-31077 Toulouse, France. E-mail : rinaldo.poli@lcc-toulouse.fr.
SUMMARY
1. INTRODUCTION 3
2. A FEW DEFINITIONS 4
3. KINETICS 11
4. ISOTOPE LABELLING STUDIES 16
4.1 Kinetic isotope effects 17
4.2 Distribution of the isotope labels in the products 23
4.3 Reversibility of substrate activation steps 25
5. STOICHIOMETRIC STUDIES ON ISOLATED INTERMEDIATES 27
6. IN SITU SPECTROSCOPIC INVESTIGATIONS 29
6.1 In situ investigations of a catalytic run 29
6.2 Investigating the identity of missing intermediates 35
7. EFFECTS OF THE LIGAND STRUCTURE 37
8. THEORETICAL CALCULATIONS 38
8.1 Computational methods 41
8.2 Basis functions 47
8.3 Thermodynamic properties, chemical and solvent model 51
9. CONCLUSION 56
10. ACKNOWLEDGEMENT 57
1. INTRODUCTION
In this « technique » article, we address the complex topic of how one approaches the deduction of mechanisms in homogeneous catalysis. The article will not provide a cookbook recipe that can be applied to every situation. This is impossible. The study of reaction mechanisms in general and of catalytic mechanisms in particular is haunted by numerous difficulties as will be pointed out in due course and each reaction or catalytic cycle has its own specificities. The article is just meant to introduce various different and complementary approaches that have the potential of providing useful information toward the ultimate elucidation of a catalytic mechanism. Indeed, it normally takes the combination of many different approaches to arrive at a reasonably complete understanding of a catalytic mechanism. There is a popular statement that a reaction mechanism can never be proven, whereas a wrong mechanistic hypothesis may be ruled out if the results of suitable experiments that have been set out to test it are contrary to expectations. The correct mechanism will, of course, be in agreement with the results of any correctly carried out experiment. Thus, it is possible to arrive at a reasonable confidence in favour of a certain mechanism when all possible alternatives have been ruled out. Nowadays, with the help of highly sensitive in situ characterization techniques, the appropriate use of isotope labels and high-level computations, in combination with kinetics studies and stoichiometric investigations of elementary steps involving real intermediates and model compounds, our confidence in a mechanism can reach very high levels, approaching 100% in certain cases. It is therefore necessary to be familiar with all the available approaches for the elucidation of mechanisms and with the criteria that help us select the appropriate experiment for a given situation. The article is divided into chapters devoted to the various available approaches. Comprehensive reviews on this specific subject do not seem to be available. Many books and
monographs are devoted to catalysis itself but only few address the methods used for investigating catalytic mechanisms.[1, 2] Selected approaches are presented in a few other sources.[3-6] Other literature references will be cited within each chapter. The article is based on a tutorial delivered in Camerino (Italy) on 23 August 2009 within the framework of an “Intensive Programme” on “Advanced Catalysis and Organometallic Chemistry” for students at the Masters and Doctoral level.
2. A FEW DEFINITIONS
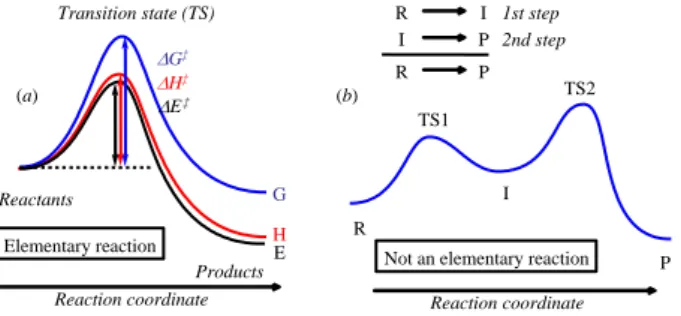
Before starting with the analysis of the various available approaches toward the elucidation of catalytic mechanisms, it is useful to remind ourselves of the meaning of a certain number of terms. A reaction mechanism is the step by step sequence of elementary reactions, each of which is defined as a direct transformation of one or more reactant molecules into one or more product molecules through a single transition state, as shown schematically in Figure 1a. The energy profile thus relates two local minima through a single maximum on the potential energy surface (PES). It may be represented on an energy, enthalpy, or free energy scale. The energy required to take the system from the reactants state to transition state is the threshold energy E‡ (or enthalpy H‡, free energy G‡), also usually referred to as activation energy (or enthalpy, free energy). Strictly speaking, use of the term “activation energy” should be restricted to the empirical parameter Eact characterizing the exponential temperature dependence of the rate constant of the elementary reaction (Arrhenius relationship, equation 1). The threshold (or activation) enthalpy and free energy are related to the rate constant though the Eyring relationship, derived from transition state theory (equation 2).
Reaction coordinate Reactants ProductsE H G Transition state (TS) Elementary reaction H‡ G‡ R TS1 TS2 I P Reaction coordinate
Not an elementary reaction
1st step 2nd step R I I P R P (a) (b) E‡
Figure 1. Energetic profile of (a) an elementary reaction; (b) a two-step process.
RT Eact Ae k (1) RT G R S RT H T k kh B ‡ ‡ ‡ ln (2)
Elementary reactions are classified according to their molecularity, which corresponds to the number of reactant molecules undergoing the chemical transformation. Thus unimolecular reactions are those where a single molecule reacts (as in a bond cleavage or isomerization step), a bimolecular reaction involves the encounter and subsequent transformation of two molecules, and so forth. Termolecular reactions as well as reactions of higher order are extremely rare. According to collision theory, a unimolecular reaction also requires a collision of the reacting molecule with a neutral body (spectator molecules such as the solvent, or the vessel walls) giving it enough extra energy to overcome the reaction barrier. The molecularity of an elementary reaction determines its rate law (the order of the reaction is 1 for each reacting partner). Figure 1b shows the mechanism for a generic two-step reaction. The rate law in this case is not necessarily related to the molecularity of any of its elementary steps (vide infra, chapter on kinetics).
In the mechanism of a catalyzed transformation, the catalyst is regenerated at the end of the process, thus this may be represented by a sequence of elementary steps in a cycle, generally referred to as catalytic cycle, as shown for instance in Figure 2a. Knowledge of the
mechanism implies that the sequence of elementary steps and the identity of each participating species is perfectly defined. The representation as a cycle is equivalent to that as a sequence of elementary transformations (Figure 2b). Another useful representation is as the energy profile, for instance on a free energy scale (Figure 2c), which contains additional information about the reaction barriers of each elementary step - G‡1, G‡2, … - as well as the thermodynamic parameters associated to each step and to the overall transformation - Grxn. [Cat] I1 I2 A B C [Cat] + A I1 I1+ B I2 I2 [Cat] + C Overall: A + B C Elementary reactions Bimolecular Bimolecular Unimolecular [Cat]+A+B I1+B I2 [Cat]+C TS1 TS2 TS3 (a) (b) (c) G‡ 1 G‡ 2 G‡ 3 Grxn
Figure 2. Representation of a catalytic cycle in which two reagents A and B are transformed
into a product C by a catalytic species [Cat] and three elementary steps through the two intermediates I1 and I2.
A pre-catalyst is a stable compound that is used to generate the active catalyst in situ by some sort of activation process. Occasionally one or more of the different species implicated in the catalytic cycle are sufficiently stable to be stored and used to start the catalytic process. An off-loop species is defined as a complex in equilibrium with one or more of the catalytic intermediates but not involved itself in the catalytic cycle. Its free energy may be higher or lower than that of the intermediate in direct equilibrium with it. Thus, certain off-loop species may actually be isolable compounds and may be used to start the process. However, if the
equilibrium is too displaced toward this compound, then its formation is irreversible and it represents a catalyst deactivation process and the compound produced can be considered as a dead catalyst (Figure 3).
A B C Precatalyst activation I’2 (off-loop) (I3) Precatalyst Precatalyst activation activation [Cat] (off-loop) (off-loop) I’3 I’1 I2 I1 Dead catalyst deactivation Dead catalyst deactivation Dead catalyst deactivation
Figure 3. Pre-catalysts, off-loop species, catalytic intermediates and dead catalysts.
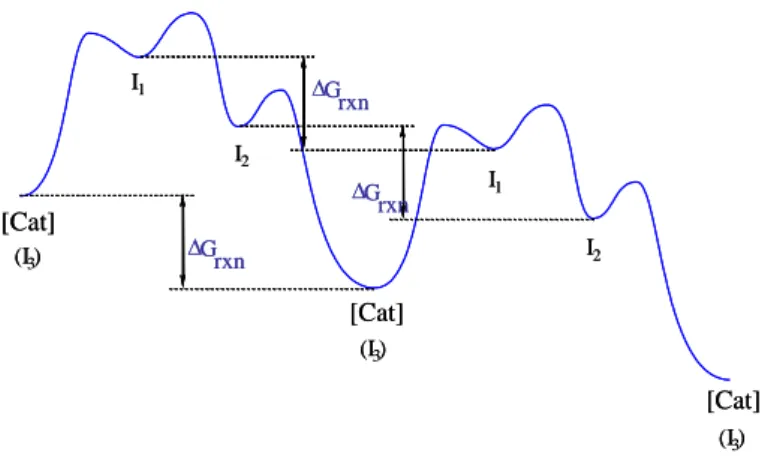
When we represent multiple cycles on an energy profile, for instance two as in Figure 4, it is obvious that species [Cat] has no special property distinguishing it from the other catalytic intermediates. Any of the catalytic intermediates may be generated from a stable pre-catalyst and be in equilibrium with off-loop species. The question then arises: which species is the “catalyst” for a given cycle? The answer is: any of the species capable of generating the catalytic process if placed under catalytic conditions, namely any of the intermediates and any of the off-loop species. All species corresponding to local energy minima along the catalytic cycle may be considered as intermediates and all of them represent different forms of the catalyst. Figure 4 emphasizes the obvious fact that the free energy difference between any intermediate and the same intermediate in the subsequent cycle corresponds to the free enthalpy of the stoichiometric reaction , Grxn.
G rxn G rxn G rxn I1 I1 I2 I2 (I3) (I3) (I3) [Cat] [Cat] [Cat] G rxn G rxn G rxn I1 I1 I2 I2 (I3) (I3) (I3) [Cat] [Cat] [Cat]
Figure 4. A generic representation of the energy profile for two subsequent catalytic cycles.
The rate-determining step (RDS) is the slowest step in the catalytic cycle. Its correct identification is an important point in the elucidation of a catalytic mechanism and this is not always a straightforward exercise. In a simple case, it can be identified as the step associated to the highest free-energy transition state in the cycle. Nota bene: this is not necessarily the step with the greatest activation barrier, as shown by the specific example of Figure 2c where the highest free-energy TS is that of step 2 whereas the greatest barrier is associated to step 1. However, there are trickier cases such as that shown in Figure 5. Which step is rate determining? An unambiguous way to identify the RDS is as follows. Each local minimum can be related to the next one by a positive (up) or a negative (down) G change. For a set of three consecutive intermediates, the possible sequences are down-up, down-down, up-up and up-down. We first need to identify all the catalytic intermediates that have a G lower than both the preceding and the following intermediate, namely the down-up sequences (in the example of Figure 5, we can find two, I4 and I2). Next, we need to consider only those “stable” intermediates that are in a decreasing free energy order (in Figure 5, both I4 and I2 verify this requirement because I2 has a lower G than the preceding I4 and a higher one than the subsequent I4). Now, we need to locate the highest free energy TS between each “stable” intermediate and the next one. In Figure 5, we find TS2 (between I4 and I2) and TS4 (between
stable intermediate to the high-energy TS on the way to the next stable intermediate [in the present example, G(TS2)-G(I4) and G(TS4)-G(I2)]. The highest of these differences determines the rate determining step. In the example of Figure 5, the highest energy difference relates I2 with TS4, thus the RDS is step 4, leading from intermediate I3 to intermediate I4 through transition state TS4. Note that, in this example, TS4 has in fact a lower G than the transition state TS2 that precedes it, but a higher one relative to the TS2 of the subsequent cycle. If we focus only on a single cycle starting and ending with I4, the highest G TS is in fact that of step 2, which is not the RDS.
I4 I1 I1 I2 I2 I3 I3 up up up up down down down down TS1 TS2 TS3 TS4 I4 I4
Figure 5. Determination of the rate-determining step and resting state. Example of the free
energy profile for two cycles of a four-step catalytic process.
Another important definition for a catalytic cycle is that of resting state. This is simply the state in which the catalyst spends most of the time during the catalyzed reaction. Consequently, it is the state which is present at the highest concentration among all the catalytically active species. The assignment of this species to the intermediate having the lowest free energy is not sufficient, at least for irreversible cycles, once again because the point representing the beginning and end of the cycle is arbitrary. However, the assignment is straightforward once the RDS has been identified. For instance, taking the example of Figure 5, species I1 and I3 can immediately be discarded because they have a higher free energy than
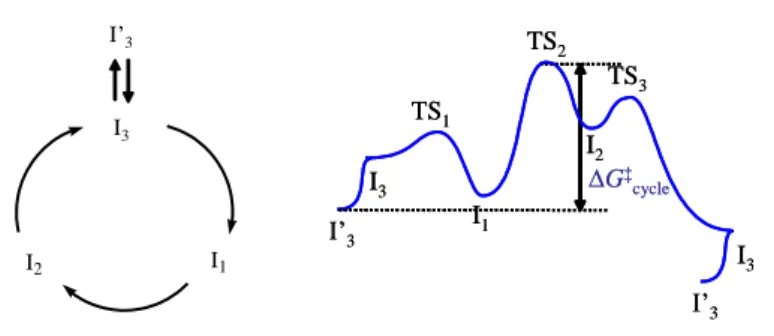
both the preceding and the following intermediates. Amongst intermediates I2 and I4, the former is transformed into the latter at a slower rate than the latter is transformed into the former. Thus, I2 will be the most populated state under catalytic conditions. The resting state can be unequivocally defined as the species having the lowest G between two consecutive transition states of the RDS. Note that an off-loop species, when it has lower G than the catalytic intermediate in equilibrium with it, may also correspond to the catalyst resting state. In the example shown in Figure 6, the resting state would have been I1 if the I3/I’3 equilibrium were not present.
I1 I2 I3 I’3 G‡ cycle I3 I1 TS1 TS2 TS3 I2 I’3 I’3 I3 G‡ cycle I3 I1 TS1 TS2 TS3 I2 I’3 I’3 I3
Figure 6. Example of an off-loop species as resting state.
These definitions are important, because the kinetics of the catalytic process are determined only by the events occurring between the resting state and the TS of the RDS (unless reversibility is involved), and because the relative concentrations of the various intermediates (of importance for their in situ detection) are determined by their G relative to the resting state. The catalytic activity, as defined by the turnover frequency (TOF), is related by the Eyring equation to the free energy difference between the TS of the RDS and the resting state (G‡cycle = GTS(RDS) – GRS), as shown in equation 3. Improvement of the catalytic activity requires lowering G‡cycle, which can be accomplished either by lowering GTS(RDS) or by raising GRS.
RT G B cycle e h T k TOF ‡ (3) 3. KINETICS
The form of the rate law provides useful information on the involvement (or lack thereof) of each substrate in kinetically relevant elementary steps, as well as on their reversibility. The relationship between the form of the rate law and the mechanism is amply discussed in all kinetics textbooks. We shall provide here only a rapid outline of the most relevant relationships. The rate law always shows a non-zero reaction order in catalyst, since a catalytic intermediate is necessarily involved in the RDS, and in one or more of the substrates. The product of the reaction may also appear in the rate expression for reversible cycles (e.g. when Grxn is small). The most useful kinetics expressions are those obtained under conditions of irreversibility. The back transformation is essentially absent and can be neglected for any process (even when Grxn = 0) for degrees of conversion lower than 5-10%. It can also be neglected at higher degrees of conversion for the limiting reagent if the process is carried out with a large excess of the other one(s). A case where excess of a reagent makes the process practically irreversible, for instance, is the transfer hydrogenation of any ketone ArCOR by isopropanol, leading to acetone and to the alcohol ArCH(OH)R, when the reaction is carried out in isopropanol itself as a solvent. The process is practically irreversible under any experimental condition when Grxn < -5 kcal/mol.
A kinetics investigation of a catalytic process typically involves monitoring of any of the reactants and/or products by any suitable physical technique (spectroscopy, gas-volumetry, pressure changes, etc.), and not the monitoring of the catalytic species, the concentration of which remains approximately constant during the transformation. The
timescale of the experiment is typically in the range of minutes to hours, suitable for classical mixing and monitoring. In addition to these investigations, however, specific stoichiometric steps of the catalytic cycle may also be the focus of kinetics investigations, if the desired intermediate is available as an isolated pure product (see section 5). In that case, the study may involve the direct monitoring of the catalytic metal complexes and the transformation may occur on a much shorter timescale, requiring special methodologies (stopped-flow rapid mixing techniques, or line-broadening investigations e.g. in NMR spectra).
Before embarking in a kinetics investigation of a catalytic process, a certain number of requirements must be met. One, as mentioned above, is to select conditions where the transformation is irreversible (the back-reaction can be neglected). A second one is to verify that the rate of the transformation is not limited by the rate of the pre-catalyst activation (absence of an induction time). A good example is provided by the hydrogenation of Z-methyl 3-acetamido butenoate catalyzed by [Rh(cod)2]BF4/Et-DuPHOS in methanol.[7] As shown in Figure 7, the catalytic intermediate under these conditions is complex [Rh(Et-DuPHOS)(MeOH)2]+, obtained in two steps from the pre-catalyst by hydrogenation of the cyclooctadiene ligands. The three cationic rhodium complexes shown in Figure 7 are available as tetrafluoroborate salts, but only the gas absorption data obtained when using the catalytic intermediate allow a straightforward kinetics analysis. Observation of the same enantiomeric excess for the three catalytic runs confirms that the same catalyst operates in all cases. A third requirement is that the process does not suffer from catalyst deactivation. This can be checked in a number of ways. A first one is to verify that the limiting substrate is completely consumed (or that the system reaches equilibrium for reversible processes). A second, more stringent check is to recover and recycle the catalyst (or simply add fresh substrate at the end of the process) and to verify that the catalyzed transformation is resumed
at the same TOF. The subsequent successful fit of the kinetics data to a rate law confirms the absence of deactivation.
Pre-catalyst Pre-catalyst Catalytic intermediate
Me NH Me O O OMe H2 Me NH Me O O OMe * Rh + Et-DuPHOS H2 Rh P P + H2 MeOH Rh P MeOH MeOH P + Et-DuPHOS V o lu m e o f a b so rb e d H 2
Figure 7. Activation of [Rh(cod)2]BF4/Et-DuPHOS in hydrogenation catalysis at 25°C and 1 bar of total pressure.[7]
The direct availability of a catalytic intermediate as an isolated species is rarely possible, so the rate law expresses the reaction order in pre-catalyst. Since the catalyst does not change concentration during a catalytic run (unless slow pre-catalyst activation or deactivation are involved), analysis of the kinetics data yields an observed rate constant, kobs =
k[pre-catalyst]x. The reaction order in pre-catalyst, x, is typically 1, but there are exceptions, therefore checking is necessary. An example is provided by Figure 8, where a dinuclear pre-catalyst is also the off-loop resting state, in equilibrium with the active mononuclear form. Straightforward derivation of the rate law for this cycle yields a half-order in pre-catalyst. The experimental observation of half-order in pre-catalyst is generally an indication of radical mechanisms with reversible dimerization of the active catalyst.
M2L2n 2 MLn•
Pre-catalyst Intermediate of the catalytic cycle MLn•+ A k1 I1 I1 Product(s) + MLn• fast (+B) Rapid and reversible RDS k2,k3,… MLn• MLn• M2L2n M2L2n I1 k1(RDS) k1(RDS) k2 k3
v = k1[MLn•][A] = k1(K[M2L2n])1/2[A] = kobs[A] K
Figure 8. Example of a catalytic cycle showing a half-order in pre-catalyst.
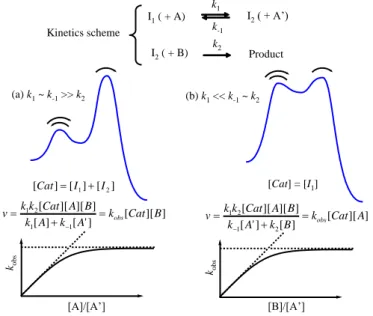
The study of the reaction order in each of the substrates and other parameters (e.g. co-catalysts, mixed-solvent composition, pH, …) follows standard procedures, typically using large excess of all components except one, and verifying whether the transformation proceeds according to a pseudo-zero order or a pseudo-first order rate law. Analysis of the resulting kobs as a function of the excess amount of the other components then allows derivation of the full rate law. Pre-equilibria and competitive forward and backward processes in high-energy intermediates generate complications in the rate law, with the observation of saturation behaviour, as they do for stoichiometric processes. Two limiting cases for the situation of a single intermediate between resting state and TS of the RDS are given in Figure 9, where the kinetic scheme and corresponding rate expressions are completely general (if a species indicated in parentheses is absent in the scheme, its concentration is replaced by 1 in the rate expression). More complex expressions result when more intermediates, each belonging to one of these two limiting situations, are involved.
I1( + A) k1 k-1 I2( + A’) I2( + B) k2 Product Kinetics scheme (a) k1~ k-1>> k2 (b) k1<< k-1~ k2 ] ][ [ ] ' [ ] [ ] ][ ][ [ 1 1 2 1 k Cat B A k A k B A Cat k k v obs ] [ ] [ ] [Cat I1 I2 kobs [A]/[A’] ] ][ [ ] [ ] ' [ ] ][ ][ [ 2 1 2 1 k Cat A B k A k B A Cat k k v obs [Cat] = [I1] kobs [B]/[A’]
Figure 9. Rate laws for two limiting cases of the same single-intermediate kinetics scheme.
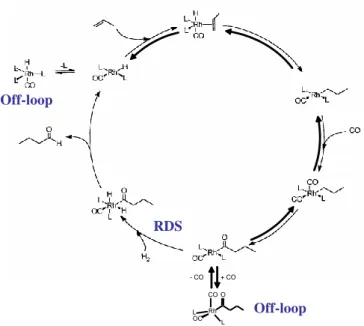
It is necessary to underline that knowledge of the full rate expression often requires extensive experimental studies with excursions into very wide concentration ranges, which may be difficult or impossible given the inherent limitations of the catalytic process. Thus, experimentally derived empirical rate expressions are sometimes given with fractional reaction orders, approximating the expected saturation trend in the intermediate concentration range used for their determination, and their validity is restricted within such range. An example is the expression v = k[Rh][3,3-DMB]0.1[H2]/[CO] derived for the Rh4(CO)12 -catalyzed hydroformylation of 3,3-dimethylbutene.[8] The small reaction order in olefin signals reversibility for the olefin coordination step, as well as for all subsequent steps (olefin insertion into the Rh-H bond, CO coordination and CO insertion, see Figure 10) until the rate-determining hydrogenolysis of the acyl intermediate, whereas the net inverse first order in CO is consistent with a dominant CO trapping relative to hydrogenolysis for the 16-electron acyl intermediate.[9]
RDS Off-loop Rh O OC L L CO + CO - CO Off-loop
Figure 10. Proposed mechanism for olefin hydroformylation with RhHL3(CO)-type
catalysts.[9]
In summary, the kinetics investigation of a catalytic process provides useful information on the nature of the events and on the G profile between the resting state and the transition state of the RDS. It also provides information on the activation parameters (G‡cycle; also H‡
cycle and S‡cycle in case of temperature-dependent studies). However, they provide no information on the faster steps of the catalytic cycle (after the RDS and until the next resting state). Furthermore, they provide no information whatsoever on the chemical identity of the catalytic intermediates.
4. ISOTOPE LABELLING STUDIES
The use of isotope labels provides information on the catalytic mechanisms essentially at three different levels: (a) they highlight differences in bonding patterns between the resting state and the TS of the RDS, through their effect on the rate constants; (b) they can distinguish between alternative mechanistic pathways through the distribution of the isotope labels in the
products (regio-, stereoselecticity); (c) they provide information on the reversibility of certain elementary steps through the label incorporation into the unreacted substrate(s).
Most isotope labelling studies are carried out by using deuterium (2H or D) in place of hydrogen (1H), for several reasons: (a) reagents having D incorporated in specific positions are not too expensive or accessible by synthesis from inexpensive deuterated sources; (b) the bonds experiencing change when going from the resting state to the TS of the RDS often contain H; (c) the H/D substitution provides the strongest isotope effect on the rate constant; (d) deuterium atoms are easily detected by NMR, either directly (even though D is a quadrupolar nucleus, the low quadrupole moment leads to sharp lines and reasonably high sensitivity) or indirectly in 1H, 13C, 31P, … NMR by observation of isotope shifts and scalar couplings (JHD, JCD, JPD, …).
4.1 Kinetic isotope effects
The only relevant players to determine the extent of isotope effect on the turnover frequency are the catalyst resting state and the TS of the RDS, no matter how many elementary steps are in-between. As highlighted above (equation 3), the TOF is determined by G‡
cycle, but the isotopic substitution may only affect the energy component (G = E + PV – TS), with no effect on the PV and S terms. The effect on E is expressed through the zero-point vibrational energy (ZPVE). The isotopic substitution modifies the frequency of the normal modes of vibration, as given by = (k/)1/2, through its effect on the reduced mass , whereas the force constant k is not affected. The zero-point energy (residual nuclear kinetic energy at 0 K) is given by ½h under the harmonic approximation for each one of the 3N-6 normal modes. The reduced mass is dramatically affected if the normal mode of vibration has strong participation of a molecular motion involving bonds to H/D. The strongest expected effect is (D)/(H) = 2 for an uncoupled H/D-X stretching vibration with a heavy X
atom or group (mX >> mH, mD), giving rise to HX/DX = (2)1/2. The ZPVE gain in this limiting case is therefore (ZPVEH/D) = ½h[HX-DX]= ½hHX(1-2-1/2) = 0.146·hHX. This difference is greater for higher vibrational frequencies, as schematically shown in Figure 11.
stronger H-X bond weaker H-X bond n=0 n=1 n=0 n=1 n=0 n=1 n=0 n=1 DX h ) 2 / 1 ( DX h H-X H-X D-X D-X (ZPVEH/D) = 0.146·hHX HX h ) 2 / 1 ( HX h
Figure 11. Effect of H/D exchange on a normal mode of vibration with (D)/(H) = 2.
For a situation in which a X-H bond of the resting state is partially or completely broken at the TS(RDS) level, substitution of H with D at this specific position leads to a greater stabilization of the resting state and a smaller (or zero) stabilization of the TS, thus increasing G‡
cycle and slowing down the catalytic process (kH/kD > 1). This is called a normal kinetic
isotope effect (KIE), whereas the opposite situation (stronger H-X bond in the TS relative to the resting state) leads to kH/kD < 1 (inverse KIE) and is less frequent.
The numerical value of the KIE may vary in a very broad range depending on the number and strength of the bond(s) involved and on the temperature. The contribution of the X-H stretching mode, in the limiting scenario where the bond is completely broken at the TS level, is given in Table 1 for a few X-H and temperature values. The overall KIE value is obviously determined by the overall ZPVE change between resting state and TS(RDS),
comprising all 3N-6 normal modes, resulting from all bond breaking and bond forming contributions. It may be affected by the solvent when this can interact with the molecules and change the vibrational structure at the resting state and/or TS(RDS) levels. A low value may result in certain cases, but any significant deviation from 1 provides quite important information, at least at the qualitative level, about changes at the given bond between the two kinetically relevant states. More quantitative information is often difficult to extract, except by comparison with high-level computations. In some cases higher KIE values relative to those shown in Table 1 may result, even up to 100! Such high values are indicative of tunnelling effects and, as such, they also help clarifying the shape of the PES in the proximity of the TS(RDS).
Table 1. Theoretical maximum contribution to kH/kD (limiting case of full bond breaking at the TS level) by a single X-H/D stretching mode.
/cm-1 k H/kD (max) (T = 273 K) (T = 298 K) (T = 373 K) 3600 15.6 12.4 7.5 3400 13.4 10.8 6.7 3100 10.7 8.7 5.7 2800 8.5 7.1 4.8
An example of the utility of KIE is given by the transfer hydrogenation of acetophenone (acp) with formic acid, catalyzed by the 6-cymene complex (cymene)RuCl{TsNCH(Ph)-CH(Ph)NH2}. The proposed cycle is shown in Figure 12, where the boxed species have been isolated and characterized. The cycle and the presence of the indicated equilibria agree with the form of the rate law, but the details of the rate-determining transformation of the hydride intermediate (top of the cycle) to the diamido species (bottom of the cycle), in particular whether or not the hydridic and protic H atoms are transferred simultaneously, cannot be established by the rate law. Therefore, experiments with D labels were carried out.[10] A positive KIE was measured when using either D2O in place of H2O (the source of the protic H
atom: kRuHNH/kRuHND = 1.68±0.10) or DCOO- in place of HCOO- (the source of the hydridic H atom: kRuHNH/kRuDNH = 2.24±0.10), and simultaneous use of both deuterated sources gave an even higher KIE (kRuHNH/kRuDND = 3.05±0.50). On the other hand, the rate constant measured in DMF-d7 is indistinguishable from that measured in regular DMF (kDMF/k[D7]DMF = 1.06±0.10). These experiments confirm that the bonds to both H atoms are significantly altered on going from the resting state to the TS(RDS) and suggest that the solvent does not play a significant role in this process.
pre-catalyst K1 K2 k RDS comes from HCOO -comes from H2O
Figure 12. Proposed mechanism for the transfer hydrogenation of acetophenone (acp) with
formic acid catalyzed by (cymene)RuCl{TsNCH(Ph)CH(Ph)NH2}.[10]
Many other examples of the use of D/H exchange for the determination of the KIE in catalysis can be found in the current literature. The use of KIE for the elucidation of catalytic mechanisms, however, is not limited to H/D. Important information has also been obtained by use of k12C/k13C. This KIE is not obtained by measuring the rate in the presence and absence of labelled C atoms at specific positions, because this procedure would require rather expensive reagents and the sought information would suffer from low precision since the
effect is expected to be quite small. A simple trick, which only requires the use of reagents at natural 13C abundance, is to run the catalytic process until very high conversion and recover the unused substrate of interest.[11] If a significant KIE arises from the 13C/12C substitution at any position, then the substrate will convert at significantly different rates, enriching the left-over substrate in one of the two isotopes at that particular position (e.g. the 13C fraction will increase in the presence of a normal KIE). The unused substrate must be recovered in sufficiently large amounts to run a high resolution proton-coupled 13C spectrum where the various C resonances can be quantified by integration with sufficiently high precision, with respect to an internal standard known (or assumed) to have no isotope effect. The needed level of substrate conversion depends on the extent of the KIE, because the proportion of a minor isotopic component (R) in recovered material relative to the starting material (R0) is related to the fractional conversion (F) and the KIE by equation 4.[11]
R/R0 = (1 - F)(1/KIE) – 1 (4)
An example of this practice is shown by the hydroamination of styrene with aniline catalyzed by the Pd(OTf)2/dppf.[12] The pre-catalyst is assumed to transform into the catalytically active diphosphine hydrido complex shown in Figure 13, which then coordinates and inserts styrene to yield a 3 methylbenzyl derivative, the isolation and characterization of which suggests its role as catalytic resting state.[13] Running the reaction up to 90% conversion and 13C NMR analysis of the recovered styrene led to the calculation of the KIE values shown in Figure 13 for 4 independent experiments. In this study, the styrene para C atom (sufficiently far away from the reactive part of the substrate) was assumed to have no isotope effect. The absence of a significant deviation from unity for the meta, ortho and ipso C atoms comforts this assumption. The vinyl -C atom also shows an insignificant KIE,
whereas the value determined for the -C atom is significantly greater than 1. This observation is consistent with the proposed catalytic cycle, where the Pd-(-C) bond is substantially weakened on going from the resting state to the TS of the rate-determining step.
RDS
resting state
Figure 13. Proposed mechanism and k12C/k13C results for the hydroamination of styrene with aniline catalyzed by Pd(OTf)2/dppf.[12]
An alternative to the determination of small isotope effects in material labelled only at natural abundance is to employ the high precision of isotope ratio mass spectrometry,[14] but a major restriction is that each site of interest must be selectively degradable, without affecting the isotope ratio, into an analyzable small molecule (for instance, CO2 for the measurement of the 13C KIE). The advantage of the NMR technique is that it provides the simultaneous determination of all individual KIEs by direct measurement without further chemical transformation.
4.2 Distribution of the isotope labels in the products
The utility of this technique for the elucidation of catalytic mechanisms is obvious and is best illustrated with a couple of examples. As alluded to above, transfer hydrogenation of ketones may take place by a variety of mechanism. Four different ones have been proposed, as shown in Figure 14. They consist of the “Noyori-Morris” or “outer sphere” mechanism (A), two “inner-sphere” hydride mechanisms involving ketone coordination, insertion into the metal-hydride bond, and product elimination (distinguished as a “monohydride” (B) and a “dihydride” (C) version), and an “inner-sphere” direct transfer from the reducing agent to the coordinated substrate (D, a metal-templated, Meerwein-Ponndorf-Verley-type concerted mechanism). The KIE study discussed above (Figure 12) refers to a mechanism of type A.
R1 R2 O H R2 OH R1 O H OH [M] H E H [M] E d-d+ [M] H E H R1 R2 O [M] H E H O [M] H R1 R2 O [M] H R1 R2 O [M] H R1 R2 O [M] H O H R2 OH R1 H OH A B O H OH R1 R2 O H R2 OH R1 [M] H H [M] [M] H O R1 H R 2 [M] H O H C O [M] O O R2 H R1 [M] O O R2 H R1 [M] O O R2 H R1 [M] O H R 1 R2 O [M] O R2 H R1 H R2 OH R1 H OH O D
The “dihydride” mechanism C is distinguished from the other by the fate of the two H atoms. For A, B and D, the “hydridic” H atom in the reductant (e.g. the -H atom of isopropanol) selectively becomes the “hydridic”atom in the product, whereas in cycle C this atom is distributed with equal probability to the CH and OH positions. Thus, use of selectively deuterated reductants such as d1-cyclohexanol or racemization studies of an optically active -deuterated alcohol such as d1-phenylethanol allow excluding at least one mechanistic possibility. Screening various catalysts led Pàmies and Bäckvall to the observation of nearly 100% of -D in the product in many cases, excluding mechanism C for these systems, but close to 50% for others, excluding mechanisms A, B and D for these.[15] Note, however, that cycles A, B and D cannot be told apart by this experiment.
A second example is provided by olefin hydroamination, for which two alternative pathways, one involving olefin activation and the second one starting with activation of the amine (see Figure 15) are commonly considered.[16] A particular system where either mechanism could in principle be operative is that based on the [IrCl(olefin)2]2/phosphine pre-catalyst for the hydroamination of norbornene, originally developed by Casalnuovo et al.[17] and later improved by Togni et al.[18] Recent mechanistic investigations by Hartwig et al. using PhND2 demonstrate that the D label is selectively incorporated in a position syn with respect to the PhND sustituent, in agreement with the amine activation pathway. The olefin activation pathway seems excluded for this catalyst, because the amine attack anti relative to the metal would necessarily lead to the formation of the anti deuterated product.[19]
Olefin activation Amine activation
Figure 15. Two alternative pathways for intermolecular olefin hydroamination.
4.3 Reversibility of substrate activation steps
Incorporation of isotope labels is the best method to verify whether the substrate activation and a certain number of subsequent steps are reversible. The experiment requires stopping the catalytic transformation before complete conversion and analysing the isotope content in the unreacted substrate. Once again, the utility of this method is best illustrated by an example. In the olefin hydroformylation reaction, as already shown in Figure 10, the rate law suggests reversibility for a few of the initial steps. The hydroformylation of styrene with pre-catalysts of type [RhCl(COD)]2/(P,N), where (P,N) indicates a bifunctional phosphine-amine ligand, yields a typical branched/linear ratio around 95:5 for the expected PhCH(CHO)CH3 and PhCH2CH2CHO product. The transformation proceeds in the presence of D2O to yield deuterated products, mainly PhCH(CHO)CH2D, indicating exchange of the active Rh-H intermediate with D2O to yield Rh-D, which then places the deuterium atom on the methyl group of the branched product upon 1,2-insertion of styrene, as shown in Figure 16.[20] When the transformation was carried out up to 30% conversion, analysis of the recovered unreacted styrene revealed the presence of a significant amount of PhCH=CHD, but no PhCD=CH2. As outlined in Figure 16, coordination of styrene and insertion into the Rh-D bond leads to either Rh-CH2CHDPh (for 2,1 insertion, ultimately leading to the linear
hydroformylation product) or Rh-CH(Ph)CH2D (for 1,2 insertion, leading to the branched product). Reversal of both steps, with -H elimination rather than -D elimination, liberates PhCD=CH2 and PhCH=CHD, respectively. Thus, in addition to demonstrating the reversibility of the styrene coordination step, the observation of the former and the absence of the latter confirms reversibility for 1,2 insertion, but not for 2,1 insertion. The reversibility of the first 2 steps in the branched cycle was also confirmed by the observation, at high conversion, of the doubly deuterated branched product, PhCH(CHO)CHD2.
Rh D Rh Ph CH2D Ph Rh H Ph D Rh D Ph Rh H Ph D Ph CHO H/D Ph CHO Rh CHD Ph Rh H Ph D Rh H Ph D Observed in recovered styrene after 30% conversion. Not observed: irreversible linear insertion
Observed after high conversions
CHO Ph D D D D
Figure 16. Pathways leading to D incorporation from D2O into unreacted substrate and products during Rh-catalyzed styrene hydroformylation.
A limitation of this method is that it provides only qualitative information. The extent of isotope incorporation into the unreacted starting material depends on several parameters, including the free energy difference between free substrate and the intermediate leading to isotope exchange, the relative activation barriers (G‡) of the two processes that take this intermediate either back to free substrate or to final product, and the extent of substrate conversion. Thus, no quantitative information on the energy profile can be extracted from this
5. STOICHIOMETRIC STUDIES ON ISOLATED INTERMEDIATES
In fortunate cases, catalytic intermediates can be isolated by running stoichiometric reactions between a suitable pre-catalyst and one or more of the reagents. This requires stability of the intermediate with respect to all possible irreversible deactivation processes under the conditions chosen for the synthetic and isolation procedure. The synthesis needs not be carried out under conditions identical to those used in catalysis, for instance conditions avoiding deactivation such as lower temperatures, provided that the pre-catalyst activation can still efficiently lead to the sought species. Once a product is isolated and characterized, its direct implication in the catalytic cycle must be proven by as many methods as possible before concluding that this is indeed a catalytic intermediate. These methods may include: (a) use of the isolated species to initiate catalysis without induction time and with the same activity/selectivities (or better) shown by the previously used pre-catalyst; (b) comparison of the spectroscopic properties with those obtained by in situ monitoring techniques, if available; (c) study of subsequent stoichiometric steps, ultimately leading to the same products of the catalytic process.
An example of the application of the above principle was already shown in Figure 7, where the bis-solvento complex [Rh(Et-DuPHOS)(MeOH)2]BF4 was first generated by hydrogenation of the pre-catalyst in the absence of the unsaturated substrate, and then used as catalyst. A related [Rh(R,R-dipamp)(MeOH)2]BF4 (although not initially described as such) was isolated as a relatively stable yellow solid and then used in catalytic experiments.[21] The subsequent step of the catalytic cycle (coordination of the unsaturated substrate, see Figure 17), led to the isolation of the corresponding intermediate when using another diphosphine ligand, dppe, through the reaction of [Rh(dppe)(MeOH)2]BF4 with
PhCH=C(COOMe)-(NHCOCH3), commonly abbreviated as MAC, in the absence of H2. The product [Rh(dppe)(MAC)]BF4 was isolated and characterized by NMR and by an X-ray diffraction study.[22] The follow-up stoichiometric reaction of this material with H2 yielded the expected hydrogenation product of MAC with regeneration of [Rh(dppe)(MeOH)2]+.
Pre-catalyst P Rh P Ph Ph Ph Ph H2 norbornane RDS Resting state
Figure 17. MAC hydrogenation catalyzed by [Rh(dppe)(MeOH)2]+ and structure of the [Rh(dppe)(MAC)]+ intermediate.
Valuable information may also be furnished by studies on model compounds (complexes that are assumed to approximate the actual catalytic intermediates), that may be more accessible or easier to isolate or containing more suitable spectroscopic tags for reaction monitoring. These may be related to the real intermediates by: (a) a change of metal (typically 5d in place of 4d since the former usually give slower transformations, thus kinetically more stable systems); (b) a change of neutral ligand (e.g. a carbonyl in place of a phosphine, or viceversa); (c) another ligand modifications (e.g. Cl in place of H, Tp in place of Cp, etc.). However, one must be extremely careful when interpreting the results of stoichiometric reactions obtained with model compounds because catalytic cycles often change by slight variations of substrates, ligand substituents, and reaction conditions, let alone deeper changes
as those mentioned above. At best, such studies provide useful hints about the chemical reactivity (stereochemistry, selectivities, …) of the actual catalytic intermediates.
6. IN SITU SPECTROSCOPIC INVESTIGATIONS
These studies can be grossly divided into two classes, with two different objectives. The first class consists in the investigations under truly catalytic conditions, providing information on the nature of the resting state and other low-energy species of the cycle. In order to be really relevant, these studies must be carried out under the actual conditions (nature of the compounds, solvent, temperature and concentrations). The second class includes studies aimed at identifying and obtaining structural information on a specific intermediate. These studies are often carried out under any condition that optimizes the observation of the sought species.[5]
6.1 In situ investigations of a catalytic run
Carrying out an in situ spectroscopic study under conditions identical to the catalytic run is not always possible, for instance when the temperature is outside the range tolerated by the suitable monitoring instrumentation. Another common problem is that of the low catalyst concentrations (often < 1 mM), too low for detection with a reasonable signal-to-noise ratio by certain spectroscopic techniques. In those cases, experiments may be carried out at higher catalyst concentration, perhaps using lower temperatures or less active forms in order to slow down the reaction. However, metal-ligand equilibria may shift considerably upon concentrating the solutions, which hampers direct comparison of the data observed in catalysis and in situ monitoring. Thus, care must be exercised for extrapolation of the results in those cases.
It is important to verify that the observed species is indeed catalytically relevant. As shown in Figure 3, many species may be simultaneously present including pre-catalyst, catalytic intermediates, off-loop species and deactivated forms. The spectroscopic signatures of the pre-catalyst are known, thus such species can be easily recognized. In addition, signals of pre-catalysts are expected to decrease continuously during the induction time. Conversely, signals of deactivated species increase with time in a way that can be correlated with the decrease of the catalytic activity. In an in situ study of a catalytic run, the concentration of a kinetically stable intermediate or off-loop species remain constant, or vary as a function of the reactants conversion in a way that can be related to the chemical equilibria in which the species is involved. In the latter case, the observed concentration changes provide useful information on the equilibria within the catalytic cycle.
Under the assumption that deactivated and not-yet-activated forms are absent, namely that only catalytic intermediates and off-loop species are present, the distribution of the observed species will reflect the relative energetics (G relative to the resting state) according to Boltzmann population statistics, all species being considered within the same cycle between two consecutive TS of the RDS (for instance, between two consecutive TS4 in the energetic profile of Figure 5). If all these species are mononuclear (thus their relative proportion is concentration independent) and considering the ideal case where all other species participating in the equilibria are present at 1 M concentration, then Kx = [Ix]/[RS] = exp(-Gx/RT), where Ix = intermediate or off-loop species under consideration. Simple calculations show that this concentration ratio quickly becomes very small as G increases, for instance 0.025, 1.0∙10-4 and 1.0∙10-8 for G = 2, 5 and 10 kcal mol-1 at 273 K (0.068, 1.2∙10-3 and 1.4∙10-6 for the same G at 373 K). This means that higher energy intermediates are only a tiny fraction of the total catalyst amount, which is itself already quite small. Only very sensitive techniques may detect higher energy intermediates in situ. The most readily
detected species are only the resting state and other intermediates with a free energy very close to it.
Any analytical technique may be used in principle for in situ characterization, provided that: (a) it can be implemented under the same conditions of the catalytic runs (or close to); (b) it is sufficiently sensitive to detect the catalytic intermediates; (c) it provides useful information to probe the chemical nature of the detected species. A non exhaustive list of the techniques that have often been applied to in situ study of catalytic cycles includes multinuclear NMR spectrometry (mostly 1H for sensitivity reasons; structural information through chemical shifts, coupling constants, relaxation time data, diffusion constants, etc.), IR and Raman spectroscopy (absorption frequency, relative line intensity, linewidths, symmetry), UV/visible spectroscopy (absorption frequency, intensity, linewidths), mass spectrometry (m/z, distribution, e.g. in polymerization catalysis), EPR spectrometry (limited to paramagnetic species: g, hyperfine splittings, zero-field splitting).
A special word needs to be spared about reactions involving high-pressure gases (H2 in hydrogenation or hydroformylation, CO in carbonylations, C2H4 and other light olefins in polymerization, etc.). In situ studies of these reactions require the use of special high-pressure cells and indeed, such devices have been developed for spectroscopic techniques such as IR and NMR.[23] For analytical techniques where high-pressure cells are not available, or when the operating pressures are too high for the available technology, monitoring may be carried out under less severe conditions, although once again the value of the resulting information may be questionable. A major problem with the use of static high-pressure cells is slow diffusion, causing shortage of the gaseous reactants and concomitant change in the equilibria involving these species. The consequence is that wrong information may be obtained concerning the nature of the resting state and the relative distribution of other low-energy
species. To alleviate this problem, special flow-cells have been developed, allowing a continuous supply of gases and optimal mixing.
Another special word must be spared on the use of parahydrogen in 1H NMR spectrometry.[24] This technique, generally referred to as parahydrogen induced polarization (PHIP) NMR, is limited to the study of catalytic processes where H2 is consumed, but allows unparalleled sensitivity for the detection of low concentration catalytic intermediates, mostly hydride complexes. Parahydrogen is one of the two possible forms of H2, where the two nuclear spins have an antiparallel correlation. Since its energy is slightly lower than that of the other form (orthohydrogen), para-enriched H2 can be obtained by equilibration at very low T (typically liquid N2 is used, yielding a ca. 50:50 ortho/para distribution, vs. the 75:25 statistical distribution at high temperatures). The equilibration is extremely slow because symmetry forbidden, but is greatly accelerated by certain catalysts such as rust. After generation, para-enriched H2 can be kept essentially indefinitely. The utility of this reagent is that the nuclear spin correlation is maintained when the two H atoms become incorporated into a product, although the loss of symmetry speeds up the eventual loss of coherence. The consequence, when the two H atom are inequivalent in the product, is that among the four possible nuclear spin combinations , and , the last two are much more populated and the first two much less relative to the Boltzmann distribution, thus the four related resonances (two doublets for a coupled HAHB system) are greatly enhanced, theoretically by a factor up to >104, and are observed as two enhanced absorptions and two enhanced emissions, looking as “antiphase” doublets. More complex patterns are seen in the presence of additional coupling (e.g. to the P nucleus of phosphine ligands or to a metal such as Rh). Such dramatic signal enhancements can also be transferred to lower sensitivity nuclei by polarization transfer methods, but application to low concentration catalytic species have so far mostly involved the measurement of 1H signals.
Application of this method to the olefin hydrogenation catalyzed by RhCl(PPh3)3 (Wilkinson’s catalyst) has revealed new features, including the direct detection of the off-loop RhH2Cl(PPh3)3 complex and the RhH2Cl(PPh3)2(olefin) intermediate (see Figure 18), as well as the identification of a second, slower hydrogenation cycle that occurs on dinuclear Rh complexes, the importance of which decreases in the presence of excess PPh3.[25]
RDS Ph3P Rh H Cl H Ph3P PPh3 PPh3 Cl Rh Cl PPh3 PPh3 Rh Ph3P Ph3P H2 Cl Rh Cl PPh3 PPh3 Rh H H PPh3 PPh3 Faster hydrogenation cycle Slower hydrogenation cycle Resting state 1H NMR 1H{31P} NMR Off-loop (suppressed by excess PPh3)
Figure 18. The olefin hydrogenation catalyzed by Wilkinson’s catalyst reinvestigated by in
situ 1H PHIP NMR.
Another example of the application of an in situ spectroscopic study concerns the high-pressure IR monitoring of olefin hydroformylation, which follows the general cycle already outlined in Figure 10. The activation process starting from the Rh(acac)(CO)2 pre-catalyst in the presence of a triaryl phosphite ligand L (Figure 19) generates compound RhH(CO)3L, characterized by bands at 2093, 2043 and 2013 cm-1, and an unknown species with bands at 2064 and 2031 cm-1.[26] After introduction of the olefin, the aldehyde product quickly grows,
obscuring any carbonyl band of possible acyl intermediates in the IR spectrum. However, the use of a rapid scanning technique with monitoring during the very first moments after the olefin addition provides useful information. The results obtained for 1-octene are shown in Figure 19. The difference spectra illustrate the decrease of both RhH(CO)3L and the unknown species, while a new compound characterized by bands at 2080, 2019, 1996 and 1690 cm-1 grows. By comparison with reference compounds, this spectrum can be assigned to the acyl derivative Rh(CO)3(L)(COC8H17). Running the same experiment with difference substrates shows similar results for all terminal olefins (1-octene, styrene and pentafluorostyrene), consistent with the resting state being the acyl species, whereas internal olefins such as cyclohexene do not yield any spectral change, indicating that the resting state in those cases is the hydride complex RhH(CO)3L. These results agree with indications independently obtained from the kinetics studies.
Rh(acac)(CO)2
Pre-catalyst
L = L =
H2/CO/L
RhH(CO)3L + unknown species 2093 cm-1 2043 2013 2064 cm-1 2031 2093 2080 2064 20432031 2019 2013 1996 1690 1734 Aldehyde product
Figure 19. A high-pressure IR study of the 1-octene hydroformylation of olefin catalyzed by
Rh(acac)(CO)2. The figure shows the difference spectra obtained after the addition of 1-octene, subsequent to pre-catalyst activation by H2/CO/L. Spectra were collected at a rate of 80 spectra per second for a time span of 0.82 s.
6.2 Investigating the identity of missing intermediates
Because of the concentration limitations described above, certain catalytic intermediates may never be detectable under truly catalytic conditions. Thus, additional information may be obtained by monitoring specific stoichiometric steps of the catalytic cycle. These studies may be carried out at higher concentrations of the metal species and in the presence of only those reagents implicated in the given step, but the purpose is not observing and possibly isolating the final product of the stoichiometric transformation (this topic was covered in a previous section), but rather to spectroscopically detect an intermediate and to elucidate its structural details. Demonstration that the observed stoichiometric transformation is indeed part of the catalytic cycle requires independent verification that the starting and ending compounds are themselves active catalysts for the process under consideration, with the same activity and selectivities under the same conditions. Thus, only isolated intermediates or off-loop species may be used as starting point. A pre-catalyst needing activation won’t do. Typically, the resting state of the cycle is the compound most easily isolated and therefore most frequently used in this approach, but starting from a higher energy catalytic intermediate, if available, provides additional advantages by allowing other intermediates, at yet higher energy, to accumulate to higher concentrations becoming more easily observable. This detective task may also be facilitated by working under different reaction conditions, e.g. at very low temperature or in a different solvent, possibly resulting in a favourable change of the PES in favour of the sought intermediate, although once again care is needed for extrapolation of the results to the catalytic conditions.
One example where this strategy was applied is related once again to the hydrogenation of unsaturated compounds catalyzed by [Rh(PP)(MeOH)2]+-type complexes, with the mechanism already outlined in Figure 17. Treatment of the isolated resting state (the enamide complex [Rh(dppe)(MAC)]+) with H
2 in CD3OD at -78°C for 3 h allowed the accumulation in solution and spectroscopic identification by 1H and 13C NMR of the alkyl-hydride intermediate that precedes the RDS.[27] Success of this strategy in this particular case is related to the concurrence of several positive effects of the low temperature: (a) the H2 solubility in methanol increases; (b) the relative free energy shifts in favour of the alkyl-hydride intermediate because of the negative entropy change; (c) the rate of the subsequent reductive elimination step decreases. Proof that the observed product is indeed a catalytic intermediate is readily provided by the observed release of the hydrogenated substrate and concomitant regeneration of [Rh(dppe)(MeOH)2]+ when the solution is warmed up.
Still remaining focused on this catalytic mechanism, the identity of the last missing intermediate, the olefin-dihydride compound, could be investigated by using a system with a different diphosphine ligand, PHANEPHOS, see Figure 20.[28] The chosen conditions modulate the PES in favour of such intermediate and detection was facilitated by the signal enhancement provided by parahydrogen (vide supra). The assignment of the two observed hydride resonances to the dihydride species, rather than the alkyl-hydride product of subsequent olefin insertion, was supported by the strong coupling that both hydrides show with the Rh and P nuclei, as well as with each other. In addition, the signal around -2 is further split by strong coupling when 100% 13C-enriched MAC at the position was used. This suggests that the compound has in fact already established an interaction between the hydride and the coordinated olefin, with rapid equilibrium between the dihydride form and the hydride-alkyl form, or perhaps the insertion product keeps a strong agostic interaction that simultaneously allows strong H-Rh and H-P coupling.
PHANEPHOS
[Rh(PHANEPHOS)(COD)2]+
MAC p-H2
MeOH/-25°C
Strong H-C() coupling
Figure 20. A 1H PHIP NMR study of the MAC hydrogenation catalyzed by
[Rh(PHANEPHOS)(MeOH)2]+. The reaction was carried out in the presence of parahydrogen at 1 bar in CD3OD at -25°C.
7. EFFECTS OF THE LIGAND STRUCTURE
A last experimental strategy for the investigation of catalytic mechanisms consists of the examination of ligand effects. Ligand modification is at the very heart of homogeneous catalysis, with the obvious goals of maximizing the catalytic activity and the selectivity (chemo-, regio-, stereo-, enantio-) in favour of the desired reaction product. In turn, the analysis of how the measurable physical parameters (G‡cycle, selectivities) are affected by the ligand modification provides valuable information on the catalytic cycle, notably on the resting state and on the transition state of the RDS. Many studies of this type are available in the literature, because checking how the activity and selectivity of a catalytic reaction depend on the ligand substitution is not only systematically done for catalyst optimization, but it is also much simpler to execute experimentally than an in situ spectroscopic study or a complete kinetics investigation. As an illustrative example, Table 2 shows the results for the
hydroformylation of 1-octene using a variety of THIXANTPHOS-type ligands.[29] Electron donating substituents decrease the reaction rate, while the most active systems contain electron withdrawing groups (CF3). This has been considered consistent with weakening of CO coordination to the acyl intermediate, speeding up the catalysis by raising the energy of the acyl resting state (see cycle in Figure 10). The l:b ratio was found to correlate with the ratio of equatorial-equatorial (ee) and equatorial-apical (ea) isomers for the Rh(THIXANTPHOS)H(CO)2 complex: the ee/ea ratio shifts gradually from approximately 1 for the p-NMe2 substituted ligand to more than 9 for the p-CF3 substituted ligand.
Table 2. Activity and selectivities observed in 1-octene hydroformylation catalyzed by Rh
complexes containing THIXANTPHOS-type bidentate ligands.[29]
X Ratea % Isomer.b l:bc CF3 158 7 89 Cl 68 7 68 H 107 5 50 F 75 6 52 Me 78 5 44 OMe 45 6 37 NMe2 29 5 45
aRate in mol h-1. b% isomer = selectivity for 2-octene. cl:b = linear to branched ratio of aldehyde product.
Another way in which ligand variation can help for the elucidation of catalytic mechanisms is by assisting the in situ spectroscopic investigation of catalytic intermediates, through suitable modification of the PES, thus raising the relative concentration of a particular intermediate, and/or by introducing more easily interpretable spectroscopic tags. Examples of these approaches have already been given in the previous sections.
![Figure 2. Representation of a catalytic cycle in which two reagents A and B are transformed into a product C by a catalytic species [Cat] and three elementary steps through the two intermediates I 1 and I 2](https://thumb-eu.123doks.com/thumbv2/123doknet/13667607.430230/7.892.200.694.435.708/figure-representation-catalytic-reagents-transformed-catalytic-elementary-intermediates.webp)


![Figure 7. Activation of [Rh(cod) 2 ]BF 4 /Et-DuPHOS in hydrogenation catalysis at 25°C and 1 bar of total pressure](https://thumb-eu.123doks.com/thumbv2/123doknet/13667607.430230/14.892.278.607.225.632/figure-activation-rh-duphos-hydrogenation-catalysis-total-pressure.webp)