HAL Id: hal-00845046
https://hal.archives-ouvertes.fr/hal-00845046
Submitted on 28 May 2020
HAL is a multi-disciplinary open access
archive for the deposit and dissemination of
sci-entific research documents, whether they are
pub-lished or not. The documents may come from
L’archive ouverte pluridisciplinaire HAL, est
destinée au dépôt et à la diffusion de documents
scientifiques de niveau recherche, publiés ou non,
émanant des établissements d’enseignement et de
anthropized unconfined aquifer using bomb peak 14C
and reconstructed irrigation water 3H of irrigation water
P. Baudron, F. Barbecot, Marina Gillon, J.L. Garcia Arostegui, Yves Travi, C.
Leduc, M. Gomariz Castillo, D. Martinez-Vicente
To cite this version:
P. Baudron, F. Barbecot, Marina Gillon, J.L. Garcia Arostegui, Yves Travi, et al.. Assessing
groundwa-ter residence time in a highly anthropized unconfined aquifer using bomb peak 14C and reconstructed
irrigation water 3H of irrigation water. Radiocarbon, University of Arizona, 2013, 55:, pp.3-4 (IF
1,065). �10.2458/azu_js_rc.55.16396�. �hal-00845046�
© 2013 by the Arizona Board of Regents on behalf of the University of Arizona
Proceedings of the 21st International Radiocarbon Conference edited by A J T Jull & C Hatté
UNCONFINED AQUIFER USING BOMB PEAK 14C AND RECONSTRUCTED
IRRIGATION WATER 3H
Paul Baudron1,2,3 • Florent Barbecot4 • Marina Gillon5 • José Luis García Aróstegui6 • Yves Travi5 • Christian Leduc2 • Francisco Gomariz Castillo1,7 • David Martinez-Vicente1,8
ABSTRACT. Radiocarbon decay is rarely used to assess the residence time of modern groundwater due to the low resolution of its long half-life in comparison to the expected range of ages. Nonetheless, the modern 14C peak induced by the nuclear bomb tests traces efficiently the impacts of recent human activities on groundwater recharge, as well as for tritium. A simple lumped parameter model (LPM) was implemented in order to assess the interest of 14C and 3H nuclear peaks in a highly anthropized aquifer system of southeastern Spain under intense agricultural development. It required i) to assess a correction factor for modern 14C activities and ii) to reconstruct the 3H recharge input function, affected by irrigation. In such a complex hydrogeological context, an exponential model did not provide satisfying results for all samples. A better solution was reached by taking into account the qualitative recent variation of the recharge rates into a combined exponential flow and pis-ton flow model. Apart from presenting an uncommon approach for 14C dating of modern groundwater, this study highlights the need of considering not only the variation of the tracer but also the variability of recharge rates in LPMs.
INTRODUCTION
Radiocarbon is rarely used for dating modern groundwaters infiltrated after the 1950s and 1960s nuclear tests, despite its common use in hydrogeology (Geyh 2000). At this timescale, this tracer is more often considered in dating peat profiles (e.g. Goslar et al. 2005) or speleothems (e.g. Hodge et al. 2011), while hydrogeological tracers more adapted to recent phenomena such as 3H/3He (e.g. Massmann et al. 2009), CFCs (Plummer and Busenberg 1999), SF6 and other emerging contaminants (e.g. Darling et al. 2012) are generally preferred. Nonetheless, due to the nuclear bomb tests, 14C can be used for modern groundwater dating by comparing the 14C contents in groundwater and recharge water. This requires a previous reconstruction of the recharge signal and its later modification by the underground flow. Lumped parameter models (LPMs) are a powerful alternative to the physical modeling of groundwater flow (e.g. Alvarado et al. 2007). A limited number of studies combined LPM with modern 14C. Kalin (2000) in Arizona (USA), Ndembo Longo et al. (2011) in Congo, and Stewart (2012) in New Zealand, working in unconfined aquifers, obtained mean residence times ranging from a tenth to a few hundreds of years. One of the difficulties of this approach is to assess a correction factor that allows comparing the measured 14C activities with the recharge time series. It can be performed by geochemical and isotopic modeling (Fontes 1992). One alternative was pro-posed by Bruce et al. (2007), who obtained this factor by repetitive sampling of both 14C and tritium in groundwater, but it needs a longer and more costly investigation. In any case, a limitation of this approach is expected to be reached in transient state, i.e. when recharge is not a continuous and stable process or when the tracer signal is hard to assess because of a variable origin of the recharge water.
1Fundación Instituto Euromediterráneo del Agua, Murcia, Spain.
2Institut de Recherche pour le Développement, UMR G-EAU, Montpellier, France. 3Université Paris Sud, UMR CNRS-UPS 8148 IDES, Orsay, France. Corresponding author.
Email: paul.baudron@baudron.com.
4GEOTOP-UQAM, Département des Sciences de la Terre et de l’Atmosphère, Montréal, Québec, Canada. 5Université Avignon Pays de Vaucluse, UMR1114 EMMAH, Avignon, France.
6Instituto Geológico y Minero de España, Murcia, Spain.
7Universidad de Alicante, Departamento de Ciencias Marinas y Biología Aplicada, Alicante, Spain. 8Universidad de Murcia, Instituto Universitario del Agua y del Medio Ambiente, Murcia, Spain.
The objective of the present study is to investigate the applicability of combining LPMs with mod-ern 14C and anthropogenic 3H in the case of a watershed under intensive irrigation and with a limited number of samples. Our approach takes into account both the modifications of the recharge signal and the modifications of the recharge rate. In order not to overinterpret the system, simple LPMs were selected. We apply this method in an unconfined aquifer in southeastern Spain where recharge is significantly controlled by modern irrigation practices (Baudron et al. 2013a). It makes this aqui-fer favorable to the studied ranges of ages. The 3H content of irrigation water is reconstructed by considering the 3H content of each water source and their relative contribution to the input water. The equivalent soil gas 14C activity of groundwater samples was modeled in order to compare it with the atmospheric time series, once introduced as a correction factor that allows applying LPM.
STUDY AREA
Located in southeastern Spain (Figure 1) and covering an approximate area of 1200 km2, the Campo de Cartagena is one the most productive agricultural area in Europe. Despite a semi-arid climate, the regional economy relies on agro-industry, with crops covering one third of the total surface area. Due to the low precipitation (~300 mm/yr) and lack of permanent surface water, the development of intensive irrigation during the 20th century was mainly supported by groundwater extraction (Baudron et al. 2013a). In the 1980s, the water provided by the Tagus-Segura water transfer canal (Figure 1), hereafter “TTS”, started to provide additional quantities of water from a river basin located 400 km northward (Tagus Basin). The water is delivered in the 3 irrigation areas of CRCC (Comunidad de Regantes del Campo de Cartagena): Oriental, Cota 120, and Occidental (where TTS water started to flow in the 1990s). In the last decade, additional water resources (desalinated sea-water, treated wastewater) started to provide extra sources of water for irrigation, although their use remains very limited in comparison to the volumes coming from groundwater and TTS. Farmers mix the different sources of water and store them in open-air water reservoirs before their applica-tion to crops. The mixing proporapplica-tions between groundwater and TTS water mainly depend on the availability of TTS water.
Figure 1 Map of the Campo de Cartagena, indicating the CRCC irrigation zones (Occidental, Oriental, and Cota 120), the TTS canal, and the Quaternary aquifer sampling points.
The Campo de Cartagena multi-aquifer system is one of the main groundwater resources of the Mediterranean basin. The upper productive layer is a shallow unconfined Quaternary aquifer com-posed of sand, silt, clay, conglomerate, caliche, and sandstone (Jiménez-Martínez et al. 2012; Baudron et al. 2013b). It receives the irrigation return flow from agriculture. Below the Quaternary aquifer and separated by thick aquitard layers, the following confined aquifers appear along increas-ing depth: sandstone (Pliocene), limestone (Messinian), sandy limestone and conglomerate (Torto-nian), and marble from the Triassic bedrock.
The different sources of water for irrigation present highly variable tritium activities: from 0 to 70 TU for deep groundwater (Baudron et al. 2013a) and TTS water (De Pablo San Martin 2008), respectively, including up to 8 TU for shallow groundwater (Baudron et al. 2013a).
METHOD
Lumped Parameter Model (LPM)
Particles travel in groundwater according to the aquifer geometry and to the flow configuration (local hydrodynamic characteristics, pumping, and recharge), conditions that vary considerably from one site to another. In addition, depending on the length of the screen inside the aquifer, groundwater pumped from a well or tubewell might result from a distribution of ages, as it is repre-sentative of several flow lines. As a consequence, quantitative age assessment with time tracers from a groundwater sample might actually reflect mean residence times (MRT) rather than the often called “absolute ages.”
To support the interpretation of age tracers, LPMs have been developed (e.g. Zuber 1986; Zuber and Maloszewski 2001; Jurgens et al. 2012). They are based on simplified aquifer geometry and flow configuration that account for effects of mixing and dispersion in the aquifer and around the tube-well. They relate the tracer concentration measured in a sample to the history of the tracer input that actually recharged the aquifer (Jurgens et al. 2012). We implemented the 3 most commonly used LPMs. Simulations were made for the year of sampling (2011).
The piston flow model (PFM) assumes a displacement of the tracer from the inlet position (recharge area) to the outlet position (e.g. tubewells or springs) without hydrodynamic dispersion or mixing. Conceptually and mathematically, it is identical to the distribution of idealized groundwater age. The PFM can be considered in the case of short-screen tubewells from unconfined and confined aquifers, or in confined aquifers where the groundwater recharge area is small in relation to the dis-tance from the outlet position (Jurgens et al. 2012).
The exponential model (EM) considers a vertical stratification of groundwater age increasing loga-rithmically from zero at the water table to close to infinite at the base of the aquifer. This is the case in homogeneous unconfined aquifers of constant thickness that receive uniform recharge (Jurgens et al. 2012). It is generally reflected in long-screen wells that would fully penetrate the saturated zone of the aquifer.
The dispersion model (DM) is an intermediate between the 2 aforementioned models. It uses one additional parameter, the dispersion parameter (DP), which is the inverse of the Peclet number, and describes the relative importance of advective and dispersive flow within the system. When DP is very small, DM is close to PFM. Inversely, when DP is very large, DM is similar to EM. As a con-sequence, DM can be used to describe age distribution in many aquifer configurations.
Reconstruction of Tritium Recharge Signal
As the presence of 3H confirms the influence of post-nuclear test water, the LPMs could have been run considering a simplified atmospheric chronicle as representative for the input function. Resi-dence times could have been calculated. However, a strong doubt would remain on the reliability of the results, since the high variability of the tritium recharge signal would not have been considered. We reconstructed the 3H recharge signal for the2 main water sources: precipitation and irrigation. A correction factor was applied to the large tritium in precipitation time series from Vienna, as detailed below. It was obtained by comparison between the 35 yr of dual measurements in Madrid and Vienna. For irrigation water, a mass balance calculation of the relative contribution of the 3 sub-sources composing irrigation water (shallow groundwater, deep groundwater, TTS canal) was per-formed, as detailed below. The reconstitution of the 3H recharge signal was carried out separately for the 3 CRCC irrigation areas.
Changes in Land Use
Historically called “the Desert of Murcia,” the Campo de Cartagena was progressively converted along the 20th century into an area of intensive agriculture (Baudron et al. 2013a). A reconstruction of the long-term changes in land use was therefore necessary for the present study. It was elaborated from i) aerial photographs in 1945, 1956, 1981, and 2009; ii) remote sensing images (Landsat TM and Landsat ETM) from 1989 to 2010 (Alonso Sarria et al. 2007) and iii) official yearly statistical data (1971–1977 and 1981–2011) from the Murcia Regional Ministry of Agriculture. Three main land-use categories were defined: irrigated fruit trees (citrus); irrigated horticultural crops (mainly melon and lettuce); and non-irrigated areas.
Irrigated Crops Requirement (Virrigation)
The irrigated crop water requirement was set to 6400 m3/ha/yr for irrigated fruit trees, 6200 m3/ha/ yr for horticultural crops before 1980 (considering only 1 annual crop, represented by melon), and 7800 m3/ha/yr for horticultural use between 1980 and present (considering 2 annual crops, repre-sented by lettuce and melon), according to estimations by Jiménez-Martínez et al. (2010).
The actual volume of irrigation water depends on the irrigation technique. In the Campo de Carta-gena, flood irrigation was the main irrigation technique until the mid-1970s. Drip irrigation has pro-gressively extended: it was 50% at the beginning of the 1990s and close to 100% in the following decade (Figure 2), as detailed in Alcón et al. (2006). The irrigation efficiency (Eirr) is the percentage of irrigation water efficiently used by crops, i.e. not lost by surface runoff, evaporation, and deep percolation below the root zone (Brouwer et al. 1985). Considering an Eirr of 40–50% for flood irri-gation and 80–95% for drip irriirri-gation, we estimated the actual volume of water (Virrigation) required by crops (Figure 3). Rainfall was considered as an extra supply of water.
Contribution from Groundwater (VdeepGW and VshallowGW)
As pumps have very rarely volumetric meters, groundwater withdrawal (VGW) was deduced indi-rectly from the difference between the total crops water requirement (Virrigation) calculated above and the use of TTS water (VTTS), provided on a yearly basis by CRCC, as follows:
(1)
The relative proportions of groundwater coming from the deep Pliocene, Messinian, and Triassic aquifers on one side (VdeepGW) and from the shallow Quaternary aquifer on the other side (VshallowGW) were estimated from local studies (e.g. Conesa 1990), the survey by the Geological Sur-vey of Spain and field observations and discussions with farmers. We therefore considered the fol-lowing evolution of the relative percent of VdeepGW and VshallowGW: 30–70% (1945 to 1955); 40–60% (up to 1962); 50–50% (up to 1970); 60–40% (up to 1978); 70–30% (up to 1994); and 80–20% (up to 2011), respectively.
Contribution from Precipitation (VinfRF)
Rainfall was recorded at the San Javier Airport by the Spanish Agency for Meteorology (AEMET). In non-irrigated areas, where rainfall infiltration is the only source of groundwater recharge, the pro-portion of infiltrated rainfall (VinfRF)was set to 5% of the total precipitation, a typical value for such climatic conditions (Scanlon et al. 2006). In irrigated areas, according to a vadose zone investigation (Jiménez-Martínez et al. 2009), intensive irrigation artificially maintains cultivated soils at their
Figure 2 Implementation of drip irrigation in the CRCC area. Modified from Alcón et al. (2006).
Figure 3 Reconstructed evolution of water demand and applied water for irrigation in the 3 main TTS irrigation areas.
water retention capacity, and nearly all precipitation infiltrates (VinfRF ~ 100%). As this local obser-vation was in a place where the water table is very close to the ground surface, we assumed for more ordinary situations VinfRF to be 50% of the total yearly rainfall in irrigated areas.
Final Composition of Input Water
The 3H content in irrigation water is calculated from a mass balance approach. The proportion of each source of water in the mixing brought to crops during irrigation is expressed as follows:
VdeepGW * 3HdeepGW + VshallowGW * 3HshallowGW + VTTS * 3HTTS = Virrigation * 3Hirrigation (2) where 3H
deepGW, 3HshallowGW, 3HTTS, and3Hirrigation are the mean 3H contents of deep aquifers, shallow aquifer, TTS water, and irrigation water, respectively.
The 3H content of recharge water (3H
rech) is obtained by a mass balance approach between irrigation water and effective rainfall:
Vrech * 3Hrech = Virrigation * 3Hirrigation + VinfRF * 3HinfRF (3) where VeffectiveRF and 3HeffectiveRF are the volume and the tritium content of effective rainfall. As a consequence, the 3H activity of recharge water can be expressed as follows:
3H
rech = (VdeepGW * 3HdeepGW + VshallowGW * 3HshallowGW + VTTS * 3HTTS + VinfRF * 3HinfRF) / Vrech (4) 3H
deepGW and 3HshallowGW were fixed according to the results of the groundwater survey (24 samples), i.e. 0 and 8 TU respectively. This last value is the highest measurement in the Quaternary aquifer. For 3H
rainfall, a 5-yr data set (2000–2006, median of 6 TU) exists at the San Javier airport (IAEA data-base), in the study area. It was compared to the IAEA Madrid station (1971–2006, median of 12 TU). In a second step, the Madrid data set was extended from the Vienna IAEA time series (1945 to present), with a transposition factor of 0.74; the reconstructed series for Madrid had a median value of 10 TU. For 3H
TTS, a stable mean value of 70 TU has been measured every 3 months between 1999 and 2008 a few tenths of kilometers upstream from the Campo de Cartagena (De Pablo San Martin 2008; sampling point ECT-03). This value was considered constant for the whole TTS period and is explained by the presence of a nuclear plant close to the uptake in the water basin of origin.
Radiocarbon Correction
The carbon isotopic composition (13C, 14C) of total dissolved inorganic carbon (TDIC) in ground-water is acquired mainly during transit in the unsaturated zone by exchanges with soil CO2 and the carbonate matrix (Gillon et al. 2009). It is later affected by equilibration with the carbonate matrix in the saturated zone (Fontes 1992; Barbecot et al. 2000). 14C dating assesses the initial activity of the TDIC (A14C
0; e.g. Bruce et al. 2006). For measuring A14C0, the most common tools are adjust-ment models (Fontes 1992) but other approaches exist like the detailed investigation of carbon iso-topes in solid, liquid, and gaseous phases in the unsaturated zone (Carmi et al. 2009). In adjustment models, a key parameter is the soil CO2 14C activity (A14Csoil-CO2), generally 100 pMC, i.e. the almost stable pre-bomb peak atmospheric state. But groundwater may have 14C activities higher than the theoretical value of A14C
0 (e.g. Baudron et al. 2013a),preventing a direct age assessment. Such high values are explained by the influence of high atmospheric 14C from the atmospheric nuclear tests. Samples higher than 100 pMC are obviously modern.
Considering root respiration to be the main source of 14C in soils, A14C
soil-CO2 should reflect the atmo-spheric 14C (A14C
modern samples (A14C
corr) and to compare it with the output signal of the atmospheric chronicle pro-vided by LPMs. Radioactive decay of modern samples (a few tenths of years) is considered insig-nificant compared to the 14C half-life (5730 yr). Thus, A14C
meas should be equal to A14C0, once cor-rected from exchange processes between TDIC and the carbonate matrix. The A14C
soil-CO2 that allows this equality is A14C
corr. As such exchange processes were proven to take place in the study area by Baudron et al. (2013a), adjustment models like Mook (1980) were discarded and the widely used Fontes & Garnierequ (Fontes 1992) and IAEA methods (Fontes 1992) were selected. The isotopic con-tents for carbon end-members were ones commonly applied in such environments: 13C = 0‰ and A14C = 0.8 pMC for marine carbonate and 13C
soil-CO2 = –23‰ for soil gas CO2. Using the same cal-culation for old groundwater samples, A14C
corr corresponds to the decayed value for A14Csoil-CO2 in the atmosphere at time of recharge. Thus, it can also be compared with the output of the atmospheric chronicle provided by the LPMs, since both A14C
corr and the LPM model take radioactive decay into account. Other methods exist for comparing modern 14C with the atmospheric signal, like the cor-rection factor proposed by Bruce et al. (2007) based on repetitive sampling in groundwater. None-theless, land use and flow paths would have to be considered as constant. Moreover, the use of tritium for calibration would induce an additional source of error in our case study, as for Carmi et al. (2009).
RESULTS
Tritium Recharge Water Signal
The reconstruction of the extent of the 3 land-use categories in the 3 CRCC irrigation areas is the base of the calculation for agricultural water demand (Figure 3). It increased by 1 order of magni-tude between 1950 and 1980, and has remained almost stable since the early 1990s. As drip irriga-tion progressively covered the whole area, the global efficiency of irrigairriga-tion progressively increased up to a maximum value in the early 2000s, once drip irrigation was generalized. As a consequence, almost no difference is found between the water demand for irrigation and the actual water applica-tion in the decade of 2000s (Figure 3).
The relative contribution of each water source (shallow groundwater, deep groundwater, TTS canal) is highly variable, as shown in Figure 4 for the Oriental irrigation area. The arrival of the TTS water
Figure 4 Evolution of the relative contribution of the different sources of water to the input signal, illustrated for the Oriental CRCC area.
in the early 1980s reduced the withdrawals from deep and shallow aquifers. Since the total water demand remained mostly stable since the late 1980s (Figure 3), the variation of groundwater pump-ing is directly linked to the TTS input. Dependpump-ing on the years, the TTS contribution to irrigation varied from 10% to 90% of the total with a mean value of 33%. For farmers, groundwater buffers the highly variable TTS supply (Figure 4), which can lead to overexploitation.
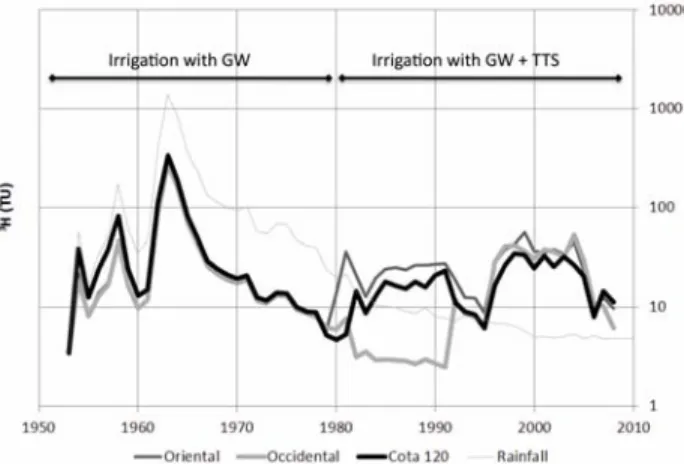
The obtained tritium recharge time series for the CRCC irrigation areas show 2 stages (Figure 5). In the pre-TTS period (until 1980), tendencies of the recharge functions are very similar to that of rain-fall, as the recharge signal is the combination of rainfall with groundwater. Since the 1980s and the progressive arrival of the TTS water, with higher tritium content than rainfall and groundwater, the recharge signal does not show direct correlation with rainfall. Indeed, a global increase in the 3H sig-nal is found, slightly delayed in the western area due to the later arrival of the TTS water (in the early 1990s).
Radiocarbon Correction Regarding the Atmospheric Signal
Regarding 14C, 2 groups of samples appeared, depending on whether the corrected 14C activities (A14C
corr) are <100 pMC (old groundwater) or >100 pMC (modern groundwater). Four modern groundwater samples (14, 17, 20, and 21) have A14C
corr ranging from 107.8 to 125.1 pMC (Table 1). Three old groundwater samples (18, 19, and 22) are affected by decay and range between 69.2 and 82.9 pMC. These averaged A14C
corr were thereafter inserted in the LPMs.
Figure 5 Tritium content in the recharge water in the TTS irrigation areas (Oriental, Occidental, and Cota 120) and rainfall.
Table 1 Tritium content (3H
mes), measured 14C activity (A14Cmes), calculated soil gas 14C activity (A14Csoil-CO2)
for F&Geq, IAEA and average values of corrected 14C (A14Ccorr) and 14C age category.
Sample ID CRCC area 3H mes (TU) A14C mes (pMC) A14C corr (pMC) 14C age category F&Geq IAEA Average
14 Oriental 8 76.2 116.7 98.8 107.8 Modern 17 Oriental 4.2 69.4 134.0 116.2 125.1 Modern 20 Cota 120 6.4 63.7 119.7 107.4 113.6 Modern 21 Oriental 2.4 55.6 123.0 106.8 114.9 Modern 18 Oriental 1.2 46.5 90.6 75.2 82.9 Old 19 Oriental 4.3 36.0 72.5 65.9 69.2 Old 22 Cota 120 0.6 50.6 82.5 74.4 78.5 Old
DISCUSSION
Reconstruction of the Tritium Recharge Signal
The sensitivity of the choice of a simplified constant tritium value of 8 TU for Quaternary ground-water was tested. It was varied from extremely low (0 TU) to extremely high values (40 TU) using the most probable recharge pattern: the perfect mixing of an exponential model (EM). The modifi-cations of the 3H signal did not affect notably the general trend of the input signal. Also, calculated residence times showed smooth modifications ranging from a few percent to 20%. These results are considered satisfactory, as illustrated by Figures 4 and 5. First, the arrival of TTS water in 1980 induced a decrease in the contribution of Quaternary groundwater to the recharge signal from 20% before 1980 to a present value around 5% (Figure 4). The impact of Quaternary groundwater on the recharge signal was therefore concentrated in the 1950–1970 period, contemporaneous of the atmo-spheric bomb peak. Secondarily, as a consequence of the use of TTS water for irrigation since 1980, 2 tritium irrigation peaks in 1980–1990 and 1995–2005 (Figure 5) have a stronger influence on the present tritium content than the older bomb peak. Another sensitivity analysis showed that residence times vary between a few percent and 20% when VinfRF is varied from 0% to 100% of total rainfall. As a consequence, our assumptions are considered satisfactory.
Mean Residence Times
Tritium
A very specific feature of the tritium recharge in the CRCC irrigation areas is the high importance given to the 10 to 15 last yr of irrigation, due to the high 3H activity of the TTS water. Indeed, the aforementioned irrigation peaks are well evidenced in the case of a piston flow input function for age simulation (Figure 6). In the case of exponential flow input function, the calculated 3H activities of water with small mean residence time are also higher considering our reconstructed chronicle than for calculation using the atmospheric 3H signal (3 times higher in the last decade, Figure 7). Obviously, this high weight given to the irrigation peak notably influences the results of the lumped parameter models. The reconstructed chronicle for the CRCC irrigation Occidental area shows a dif-ferent behavior, due to the later arrival of the TTS water.
Figure 6 Piston flow tritium output functions in groundwater for sampling year 2011, as a function of mean residence time in the TTS irrigation areas (Oriental, Occidental, and Cota 120) and rainfall. The corrected value for sample 17 is indicated by the dashed horizontal line.
According to the piston flow model (PFM), the calculated variability of the 3H signal leads to a wide range of residence times that does not allow a reliable assessment of mean residence times. For example, the measured activity of 8 TU for sample 14 intercepts the output function 7 times (Figure 6), providing a wide range of mean residence time from 16 to 42 yr (Figure 8).
Coherent with the expected recharge model for unconfined aquifer, the exponential model is more reliable, providing a single solution for sample 17 of 32 yr (Figure 7). A limit of the approach might be found for very low 3H activities, like for sample 22, where the obtained mean residence time is close to 800 yr. As these low activities are very close to the detection limit, with a high analytical uncertainty (0.4 TU), the age calculations are not the most representative.
Figure 7 Exponential model tritium output functions in groundwater for sampling year 2011, as a function of mean residence time in the TTS irri-gation areas (Oriental, Occidental, and Cota 120) and rainfall. The cor-rected value for sample 14 is indicated by a dashed horizontal line.
Figure 8 Mean residence times obtained by the piston flow model (PFM), exponential model (EM), and diffusion model (DM) for 3H and 14C data. The upper and lower graphs show the residence times obtained for 3H and 14C, respectively. The DM model is given for a dispersion parameter of 0.03. One value of 5 yr for sample 14 with PFM was not indicated. Mean residence times higher than 1000 yr for old 14C samples are not indicated.
Radiocarbon
Considering a continuous recharge over the past decades, the exponential model should be most rep-resentative of our system. It does work for most samples, except for those where A14C
corr is above the modeled range of values for the exponential model, preventing the assessment of mean residence times with such a model. The value for sample 17 (A14C
corr = 125 pMC) intercepts twice the output function of the PFM but not does not reach the output function of the EM (Figure 9), as for sample 21. Therefore, the EM could not explain the measured values for these samples. The PFM does provide results for all samples, although its use is harder to justify in an unconfined aquifer. To assess whether a possible intermediate situation between piston flow and exponential model could be a better solution, several dispersion models were tested. The maximum dispersion factor fitting all the measured values including young 14C was 0.03. Nevertheless, in this case of a low dis-persion factor, the difference with a piston flow is extremely weak.
Impact of Recharge Rates
The LPM that is most likely to be applied for unconfined aquifer is EM, although it does not provide results for all modern 14C samples. LPMs rely on the assumption of a constant flow through the sys-tem, although drip irrigation lowers the irrigation return flow compared to other techniques (e.g. Liu et al. 2012). Therefore, the progressive implementation of drip irrigation in the Campo de Cartagena (Alcón et al. 2006) might have lowered the recharge rates, and thus lowered the flow through the system. As far as we know, an LPM taking into account this situation does not exist.
To approximate the present situation with a simple LPM, we propose to describe the system with an exponential model (EM) followed by a piston flow model (PFM). The EM model represents the continuous recharge up to 1992, i.e. when <50% of the fields were equipped with drip irrigation. Then, the lowered recharge rate induced by the generalized use of drip irrigation in comparison with traditional irrigation techniques is illustrated by a PFM, i.e. a displacement of the tracer into the aquifer without hydrodynamic dispersion or mixing. To do so, we modeled the evolution of 3H
rech and A14C
corr up to 1992 with the EM and we only considered the radioactive decay between 1992
Figure 9 Exponential model and piston flow 14C output functions of dissolved carbon in groundwater for sampling year 2011, as a function of mean residence time.
and 2011 (Figure 10). Corrected 14C activities were then compared with this EM+PFM output sig-nal. This quantitative approach provides much better results, since mean residence times are pro-vided for all samples for both 3H and 14C, including the EM for modern 14C groundwater samples (Figure 11). Still, this approach is not perfect. Notable discrepancies that remain in the obtained ages between the results for 3H and 14C are mostly due to the assumptions that were made in this approach. For example, each CRCC irrigation sector might include a series of subsectors, but avail-able data on TTS datation does not allow downscaling. Also, Gillon et al. (2012) showed that A14C
0 is not necessarily similar to A14C
atm in natural groundwater systems. Inside the aquifer, additional mixing processes might occur. Taking them into account should be done with much care in order not to overinterpret the hydrogeological pattern. Finally, tubewell screens were considered to be located all along the saturated zone of the aquifer, although only limited technical information on building is available. In any case, the results highlight the need for an LPM that would take into consideration not only the evolution of the activity of the tracer but also the rate of groundwater recharge.
Figure 10 Exponential + piston flow model illustrated for 3H in the Oriental CRCC irrigation area.
Figure 11 Mean residence time obtained by an exponential model (up to 1993) coupled with a piston flow model (from 1983) for each sample with 3H or 14C. Mean residence times >1000 for old 14C samples are not indicated (see Table 1).
CONCLUSION
The reconstruction of the tritium signal showed the existence of an irrigation 3H peak from the 1990–2000s up to present in the Quaternary groundwater. It is explained by the use of high 3H water from the TTS water transfer canal, influenced by a nuclear plant in the water basin of origin. Its impact on the groundwater signal was found to be of the same order of magnitude as the nuclear tests peak. This result emphasized the importance of reconstructing the input signal. Three models were then performed: piston flow model (PFM), exponential model (EM), and dispersion model (DM). The PFM provided a large number of equally possible results for each sample. The DM needed such a small dispersion factor that it was finally equivalent to the PFM. The EM was the most reasonable model type according to the hydrogeological pattern, but this model could not explain all modern 14C groundwater samples. The modification of the recharge rates as a conse-quence of the implementation of water-saving irrigation was therefore considered to impact the results of the lumped parameter models. A simple interpretation of such a hydrological event was proposed by using an EM before drip irrigation became important and a PFM simulating a more lim-ited recharge since that time. This new model improved the best results as it provided an estimation of all age ranges for both tracers. Therefore, this study highlights a fundamental limitation of LPMs in intensively irrigated areas: the temporal evolutions of the tracer and of the recharge rate must be considered. This is expected to be the case especially in semi-arid areas where recharge can be highly variable and strongly influenced by both meteorological conditions and human activities. This study emphasizes the necessity of quantitative water balance archives, which unlikely exist, and the adaptation of LPMs to complex sets of tracers with specific input functions.
ACKNOWLEDGMENTS
This work was developed within the scope of the Project “Modelación Hidrológica en Zonas Semi Aridas” financed by the Regional Ministry of Universities, Business and Research (Region of Mur-cia, Spain). The authors acknowledge the Fundación Instituto Euromediterráneo del Agua (MurMur-cia, Spain) for its fundamental financial support. Additional supports came through the “CARTAG-EAU” project financed by the French SICMED initiative, the 08225/PI/08 research project financed by “Programa de Generación del Conocimiento Científico de Excelencia” of the Fundación Seneca, Región de Murcia (II PCTRM 2007–10), and the SWAM Project (“Increasing Regional Competive-ness through RTD&I on Sustainable Water Resources Management”, FP7 Grant Agreement nº 245427).
REFERENCES
Alcón FJ, Gomez Demiguel MD, Fernandez-Zamudio MA. 2006. Modelización de la difusión de la tec-nología de riego localizado en el campo de Cartagena. Estudios Agrosociales y Pesqueros 8(1):227–45. Alonso Sarria F, Gomariz F, Cánovas F. 2007. Temporal
analysis of land use changes in River Segura basin us-ing remote sensus-ing. Implications on desertification. Revista C&G 24:73–88.
Alvarado JAC, Purtschert R, Barbecot F, Chabault C, Rueedi J, Schneider V, Aeschbach-Hertig W, Kipfer R, Loosli HH. 2007. Constraining the age distribution of highly mixed groundwater using 39Ar: a multiple environmental tracer (3H/3He, 85Kr, 39Ar, and 14C) study in the semiconfined Fontainebleau Sands Aqui-fer (France). Water Resources Research 43: W03427, doi:10.1029/2006WR005096.
Barbecot F, Marlin C, Gibert E, Dever L. 2000. Hydro-chemical and isotopic characterisation of the Batho-nian and Bajocian coastal aquifer of the Caen area (northern France). Applied Geochemistry 15(6):791– 805.
Baudron P, Barbecot F, García-Aróstegui JL, Leduc C, Travi Y, Martinez-Vicente D. 2013a. Impacts of hu-man activities on recharge in a multilayered semiarid aquifer (Camp de Cartagena, SE Spain). Hydrological Processes, in press. doi:10.1002/hyp.9771.
Baudron P, Alonso-Sarria F, García-Aróstegui JL, Cáno-vas-García F, Gomariz-Castillo F, Martinez-Vicente D, Moreno Brotóns J. 2013b. Identifying the origin of groundwater samples in a multi-layer aquifer system with Random Forest classification. Journal of Hydrol-ogy 499:303–15.
Brouwer C, Goffeau A, Heibloem M. 1985. Introduction to Irrigation. Rome: FAO.
Bruce D, Friedman GM, Kaufman A, Yechieli Y. 2006. Spatial variations of radiocarbon in the coastal aquifer of Israel—indicators of open and closed systems. Ra-diocarbon 43(2B):783–91.
Bruce DL, Yechieli Y, Zilberbrand M, Kaufman A, Fried-man GM. 2007. Delineation of the coastal aquifer of Israel based on repetitive analysis of 14C and tritium. Journal of Hydrology 343:56–70.
Carmi I, Kronfeld J, Yechieli Y, Yakir D, Boaretto E, Stiller M. 2009. Carbon isotopes in pore water of the unsaturated zone and their relevance for initial 14C ac-tivity in groundwater in the coastal aquifer of Israel. Chemical Geology 268:189–96.
Conesa C. 1990. El campo de Cartagena. Clima e Hidrología de un medio semiárido. 1st edition. Mur-cia: EDITUM Universidad de Murcia. 450 p. Darling WG, Gooddy DC, MacDonald AM, Morris BL.
2012. The practicalities of using CFCs and SF6 for groundwater dating and tracing. Applied Geochemis-try 27(9):1688–97.
DePablo San Martin MA. 2008. Vigilancia radiológica del agua (I). Ingeniería Civil 151:77–83.
Fontes JC. 1992. Chemical and isotopic constraints on 14C dating of groundwater. In: Taylor ER, Long A, Kra RS, editors. Radiocarbon After Four Decades. New York: Springer-Verlag. p 242–61.
Geyh MA. 2000. An overview of 14C analysis in the study of groundwater. Radiocarbon 42(1):99–114. Gillon M, Barbecot F, Gibert E, Corcho Alvarado JA,
Marlin C, Massault M. 2009. Open to closed system transition traced through the TDIC isotopic signature at the aquifer recharge stage, implications for ground-water 14C dating. Geochimica et Cosmochimica Acta 73(21):6488–501.
Gillon M, Barbecot F, Gibert E, Plain C, Corcho-Alva-rado J-A, Massault M. 2012. Controls on 13C and 14C variability in soil CO2. Geoderma 189–190:431–41. Goslar T, van der Knaap WO, Hicks S, Andric M,
Cz-ernik J, Goslar E, Rasanen S, Hyotyla H. 2005. Radio-carbon dating of modern peat profiles: pre- and post-bomb 14C variations in the construction of age-depth models. Radiocarbon 47(1):115–34.
Hodge E, McDonald J, Fischer M, Redwood D, Hua Q, Levchenko V, Drysdale R, Waring C, Fink D. 2011. Using the 14C bomb pulse to date young speleothems. Radiocarbon 53(2):345–57.
Jiménez-Martínez J, Skaggs TH, Van Genuchten MT, Candela L. 2009. A root zone modeling approach to estimating groundwater recharge from irrigated areas. Journal of Hydrology 367:138–49.
Jiménez-Martínez J, Candela L, Molinero J, Tamoh K. 2010. Groundwater recharge in irrigated semi-arid ar-eas: quantitative hydrological modeling and sensitiv-ity analysis. Hydrogeology Journal 18:1811–24.
Jiménez-Martínez J, Candela L, García-Aróstegui JL, Aragón R. 2012. A 3D geological model of Campo de Cartagena, SE Spain: hydrogeological implications. Geologica Acta 10:49–62.
Jurgens BC, Bohlke JK, Eberts SM. 2012. TracerLPM (Version 1): an Excel® workbook for interpreting groundwater age distributions from environmental tracer data. US Geological Survey Techniques and Methods Report 4-F3. 60 p.
Kalin RM. 2000. Radiocarbon dating of groundwater systems. In: Cook PG, Herczeg AL, editors. Environ-mental Tracers in Subsurface Hydrology. Boston: Kluwer Academic Publishers. p 111–44.
Liu H-L, Chen X, Bao A-M, Wang L, Pan X, He X-L. 2012. Effect of irrigation methods on groundwater re-charge in alluvial fan area. Journal of Irrigation and Drainage Engineering 138:266–73.
Mook WG. 1980. Carbon-14 in hydrogeological studies. In: Fritz P, Fontes JC, editors. Handbook of Environ-mental Isotope Geochemistry, The Terrestrial Envi-ronment. Volume 1. New York: Elsevier Scientific Publishers. p 49–74.
Massmann G, Sueltenfuss J, Pekdeger A. 2009. Analysis of long-term dispersion in a river-recharged aquifer using tritium/helium data. Water Resources Research 45: W02431, doi:10.1029/2007WR006746. Ndembo Longo J, Plummer LN, Travi Y, Vitvar T. 2011.
The use of multiple environmental tracers in age inter-pretation of the Mont Amba Aquifer, Kinshasa, Dem-ocratic Republic of Congo. Proceedings of the Inter-national IAEA Symposium on Isotopes in Hydrology, Marine Ecosystems, and Climate Change Studies. 27 March–1 April 2011, Monaco.
Plummer LN, Busenberg E. 1999. Chlorofluorocarbons. In: Cook PG, Herczeg AL, editors. Environmental Tracers in Subsurface Hydrology. Boston: Kluwer Ac-ademic Publishers. p 441–78.
Scanlon BR, Keese KE, Flint AL, Flint LE, Gaye CB, Edmunds WM, Simmers I. 2006. Global synthesis of groundwater recharge in semiarid and arid regions. Hydrological Processes 20:3335–70.
Stewart MK. 2012. A 40-year record of carbon-14 and tritium in the Christchurch groundwater system, New Zealand: dating of young samples with carbon-14. Journal of Hydrology 430–431:50–68.
Zuber A. 1986. Mathematical models for the interpreta-tion of environmental radioisotopes in groundwater systems. In: Fritz P, Fontes JC, editors. Handbook of Environmental Isotope Geochemistry, The Terrestrial Environment. Volume 1. New York: Elsevier Scien-tific Publishers. p 1–59.
Zuber A, Maloszewski P. 2001. Lumped-parameter mod-els. In: Environmental Isotopes in the Hydrological Cycle. Volume 6. Modelling. UNESCO/IAEA, Tech-nical Document Hydrology 39. p 5–35.