Publisher’s version / Version de l'éditeur:
Vous avez des questions? Nous pouvons vous aider. Pour communiquer directement avec un auteur, consultez la première page de la revue dans laquelle son article a été publié afin de trouver ses coordonnées. Si vous n’arrivez pas à les repérer, communiquez avec nous à PublicationsArchive-ArchivesPublications@nrc-cnrc.gc.ca.
Questions? Contact the NRC Publications Archive team at
PublicationsArchive-ArchivesPublications@nrc-cnrc.gc.ca. If you wish to email the authors directly, please see the first page of the publication for their contact information.
https://publications-cnrc.canada.ca/fra/droits
L’accès à ce site Web et l’utilisation de son contenu sont assujettis aux conditions présentées dans le site LISEZ CES CONDITIONS ATTENTIVEMENT AVANT D’UTILISER CE SITE WEB.
Research Report (National Research Council of Canada. Institute for Research in
Construction), 2004-02-01
READ THESE TERMS AND CONDITIONS CAREFULLY BEFORE USING THIS WEBSITE.
https://nrc-publications.canada.ca/eng/copyright
NRC Publications Archive Record / Notice des Archives des publications du CNRC : https://nrc-publications.canada.ca/eng/view/object/?id=520108c8-8302-4d32-8c3a-ecaa6463e5fd https://publications-cnrc.canada.ca/fra/voir/objet/?id=520108c8-8302-4d32-8c3a-ecaa6463e5fd
NRC Publications Archive
Archives des publications du CNRC
For the publisher’s version, please access the DOI link below./ Pour consulter la version de l’éditeur, utilisez le lien DOI ci-dessous.
https://doi.org/10.4224/20377251
Access and use of this website and the material on it are subject to the Terms and Conditions set forth at
Comparison of Two Test Methods for Evaluating Sound Absorption of
Ceiling Panels
Comparison of Two Test Methods for Evaluating Sound
Absorption of Ceiling Panels
Warnock, A.C.C.
IRC-RR-158
February 2004
INTRODUCTION
INTRODUCTION
Sound attenuation between work areas in an open-office depends on two critical factors: the height of the barrier between the work area and the sound-absorbing properties of the ceiling. Two methods for evaluating ceiling systems are available: ASTM E11111 and ASTM C4232. E1111 uses a rating called the articulation class (AC) that is defined in ASTM E11103; C423 defines and uses the
sound absorption average (SAA). This report presents
measurements of several ceiling systems in accordance with ASTM E1111 and in a reverberation room according to ASTM C423. The measurements were made to provide a link between articulation class values and sound absorption average ratings. Manufacturers often do not provide both ratings for their products and it is useful to be able to use either rating system. During the measurements the effects of some changes to measurement conditions were made to evaluate their effects on the E1111 results.
The measurements were made on behalf of Public Works and Government Services Canada (PWGSC). This report is the seventh in a series. The first report4 presents measurements of sound propagation made in nine offices. The second report5 presents measurements of speech levels in the offices. Background
information on open office acoustics can be found in the third report.6 The fifth report7 presents results of a study on the effect of speaker orientation and reflectivity of vertical surfaces in open ‘team-style’ offices in a simulated office in the laboratory. The sixth report8 presents measurements of the average sound field around the heads of human talkers.
The measurements were carried out by Arnaud Trollé† under the supervision of Alf Warnock of the Institute for Research in Construction, National Research Council of Canada (NRC).
†
A guest student from INSA de Lyon, France.
SUMMARY OF FINDINGS
SUMMARY OF FINDINGS
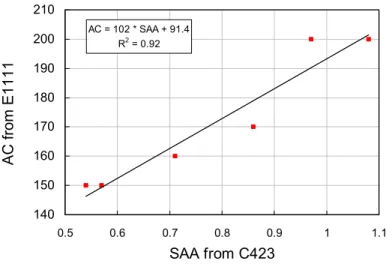
The correlation between the articulation class rating for a 1.5 m high screen and the sound absorption average is good. Figure 1 shows the correlation between the two ratings for the six ceiling panels tested. (The AC rating was defined such that 10 units corresponds to a change of 1 decibel of weighted sound attenuation.) As shown in the figure, AC and SAA are related by
AC = 102 * SAA + 91.4 AC = 102 * SAA + 91.4 R2 = 0.92 140 150 160 170 180 190 200 210 0.5 0.6 0.7 0.8 0.9 1 1.1 SAA from C423 AC from E1111
Figure 1: Correlation between AC for a 1.5 m high screen and SAA.
The correlation for a 1.8 m high screen was calculated and found to be
AC = 118 SAA + 93, R2 = 0.90.
In the absence of E1111 test data, C423 SAA values can be used to select ceiling systems. The common recommended minimum SAA of 0.9 corresponds to an AC of 180 when the screen height during the ASTM E1111 test is 1.5 m and to an AC of 200 when the screen height is 1.8 m.
If necessary, one-third octave band attenuations for an ASTM E1111 test can be calculated from absorption coefficients obtained from a C423 test.
Measurements also showed that AC was not very sensitive to the sound absorptive properties of the floor in the test chamber or to the
SUMMARY OF FINDINGS
details of the construction of the edge of the barrier used in the test. The height of the barrier above the measurement axis does affect the AC rating.
BACKGROUND
BACKGROUND
When there is a barrier between occupants in an open office, sound must bend around the barrier (diffraction) to reach listener locations on the other side. The attenuation during this diffraction process depends on the angle through which the sound has to bend — the greater the angle, the greater the attenuation9. So, higher and wider barriers give more attenuation (It should not be forgotten that diffraction occurs at vertical edges of barriers too).
Thus the screens or barriers in open offices are critical elements in acoustical design. The other critical element is the ceiling. Sound reflects from the ceiling and bypasses the barrier between work areas as shown in Figure 2.
Figure 2: Some sound paths between work areas. Dotted lines indicate attenuated sound.
For many years the sound absorptive properties of ceiling materials have been measured in reverberation rooms in accordance with ASTM C423. Ceiling panels are placed in a frame that measures 2.44 x 2.74 m and supports the panels 400 mm from the laboratory floor. Sound decay rates measured in the room with and without the specimen are used to calculate the sound absorption coefficients at frequencies ranging from about 100 to 5000 hertz. Twelve of the coefficients are used to calculate a single number rating called the sound absorption average (SAA). (Until a few years ago, the rating calculated was the noise reduction coefficient (NRC); it used only four coefficients and is now obsolete.)
Sound fields in a reverberation room are approximately diffuse – sound waves travel in all directions – and it was felt by ASTM
BACKGROUND
committee E33 that a more appropriate evaluation of ceilings for use in open offices could be made in a space that simulated an open-office. Figure 3 gives a schematic of the test arrangement. The roof of the facility above the test specimen is hard and reflects sound. The barrier in the middle of the facility extends completely across the room so there is negligible transmission around the side of the barrier. The floor is carpeted and all the walls are lined with sound absorbing material. (See Figure 4) In this test the range of angles of incidence of the sound on the ceiling is much less than the range in a reverberation room test.
The two most important sound paths between the source and a microphone are those shown in Figure 3. Transmission through the body of the screen is negligible by design. Thus, the sound levels on the receiving side are primarily due to the combination of sound diffracting over the top of the barrier and sound reflecting from the ceiling specimen. Other reflections and more complicated paths are possible but are not shown in the figure. The three microphones on the source side of the barrier are used to calculate a reference level. Differences between the levels measured at the microphones on the receiving side and the reference level are used to calculate
articulation class.
The barrier height is 1.5 m and the measurement axis is 1.2 m above the floor. Receiving microphone positions range from 2.1 to 4.2 m from the source at 0.3 m intervals.
The floor of the chamber was covered with a commercial grade carpet with a SAA of 0.2. This is the minimum value allowed by ASTM E1111 which calls for an SAA between 0.2 and 0.4.
BACKGROUND 1800 27 00 75 0
Ceiling Test Specimen
Figure 3: Arrangement of test apparatus for ASTM E1111 The black ellipse at the left is the omni-directional sound source. The array of small black circles are the microphone positions. Dimensions are in mm. The arrows show the two major paths from the source to one of the microphone positions.
Figure 4: View of the test facility.
MEASUREMENTS
MEASUREMENTS
ASTM C423 measurements
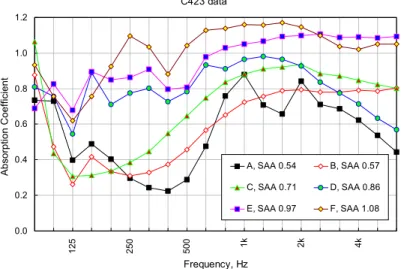
Five different ceiling panels were used in these measurements. They are described generically in the following table. The table also gives the SAA rating measured according to ASTM C423. The coefficients for each panel are shown in Figure 5.
Table 1: Types of ceiling panels used
ID Description SAA
A Fiberglass Panels. 16 mm thick. 0.54 B Mineral Fiber panels, 16 mm thick. 0.57 C Fiberglass panels, 19 mm thick 0.71 D Fiberglass panels, 25 mm thick, perforated vinyl
face 0.86
E Fiberglass panels (D), 25 mm thick, perforated
vinyl face, installed upside down. 0.97 F Fiberglass panels, 40 mm thick, foil backing 1.08
C423 data 0.0 0.2 0.4 0.6 0.8 1.0 1.2 125 250 500 1k 2k 4k Frequency, Hz Abs o rption Coeffic ient A, SAA 0.54 B, SAA 0.57 C, SAA 0.71 D, SAA 0.86 E, SAA 0.97 F, SAA 1.08
Figure 5: One-third octave band absorption coefficients for the six ceiling specimens used.
E1111 Results
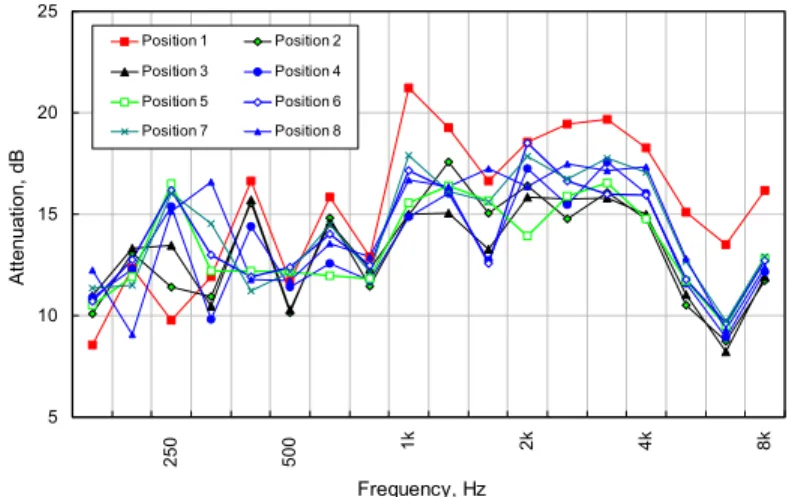
An E1111 test generates a considerable amount of data. An example of the measurements obtained is shown in Figure 6. The peaks and valleys in the spectra at low frequencies are due to interference between sound waves traveling along different paths
MEASUREMENTS
from the source to each receiving microphone. This interference is inherent in the test procedure. E1111 specifies the use of articulation class to reduce the spectral information to single-number ratings. Articulation class (AC) is calculated using the data from 200 to 5000 Hz. For the data in Figure 6 the AC values range from 140 to 170. The greater the AC, the greater the average attenuation. (AC can be converted to a decibel-like quantity by dividing the number by 10.) The AC for the average of the attenuations in Figure 6 is 150. An important point to note about AC is that it is always a multiple of 10. 5 10 15 20 25 250 500 1k 2k 4k 8k Frequency, Hz A tt enuat ion, dB Position 1 Position 2 Position 3 Position 4 Position 5 Position 6 Position 7 Position 8
Figure 6: An example of the data collected during an ASTM E1111 test. Ceiling specimen A. Position 1 is closest to the barrier, position 8 is furthest from it.
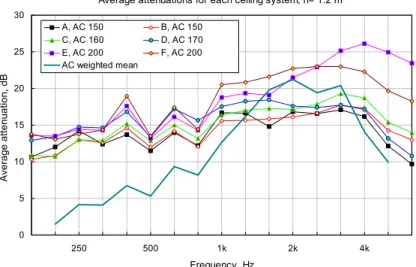
For each ceiling specimen a spectrum that was the average of the attenuations measured at the eight receiving positions was
calculated and an average articulation class calculated. The data are plotted in Figure 7. Also shown in the figure is the average
attenuation for all specimens weighted by the factors used in the calculation of articulation class. This spectrum makes it clear that the frequencies from about 1000 to 4000 Hz are most important for determining articulation class and thus speech privacy.
The correlation between SAA and AC has already been shown in Figure 1 but is displayed again in Figure 8 for convenience.
MEASUREMENTS
Average attenuations for each ceiling system, h= 1.2 m
0 5 10 15 20 25 30 250 500 1k 2k 4k Frequency, Hz Av erage attenuation, dB A, AC 150 B, AC 150 C, AC 160 D, AC 170 E, AC 200 F, AC 200 AC weighted mean
Figure 7: Average attenuation for each ceiling specimen. Height of measurement axis = 1.2 m, carpeted floor.
Foam edge, carpet, h=1.2 m
AC = 102 * SAA + 91.4 R2 = 0.92 140 150 160 170 180 190 200 210 0.5 0.6 0.7 0.8 0.9 1 1.1 SAA from C423 AC from E1111
Figure 8: Correlation between AC and SAA.
Some acousticians have proposed a new single number rating to be used with C423 results in addition to SAA. This rating is formed by multiplying the absorption coefficients at each frequency from 200 to 5000 Hz by the articulation class weight. The proposed name for this rating is speech reduction average (SRA). This rating correlates with AC only slightly better than SAA. The equation is
AC = 123 * SRA + 66.5, R2 = 0.95.
MEASUREMENTS
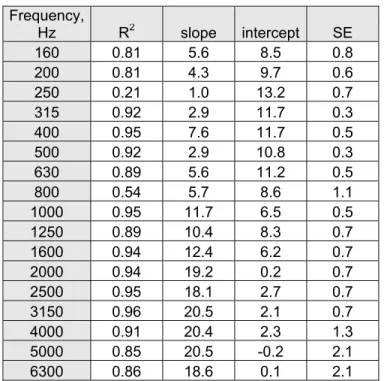
It is not just the single number ratings that correlate. C423
coefficients in each one-third octave band also correlate well with the mean attenuation measured in the E1111 test. The results of the regression analysis are shown in Table 2. With the exception of two bands, the square of the correlation coefficient (R2) is greater than 0.8.
Table 2: Regression between C423 absorption coefficients (α) and E1111 mean attenuations. Attenuations are calculated for each
frequency band using the expression Attenuation, dB = slope * α + intercept. SE is the standard error of the estimate. Frequency, Hz R2 slope intercept SE 160 0.81 5.6 8.5 0.8 200 0.81 4.3 9.7 0.6 250 0.21 1.0 13.2 0.7 315 0.92 2.9 11.7 0.3 400 0.95 7.6 11.7 0.5 500 0.92 2.9 10.8 0.3 630 0.89 5.6 11.2 0.5 800 0.54 5.7 8.6 1.1 1000 0.95 11.7 6.5 0.5 1250 0.89 10.4 8.3 0.7 1600 0.94 12.4 6.2 0.7 2000 0.94 19.2 0.2 0.7 2500 0.95 18.1 2.7 0.7 3150 0.96 20.5 2.1 0.7 4000 0.91 20.4 2.3 1.3 5000 0.85 20.5 -0.2 2.1 6300 0.86 18.6 0.1 2.1
Effect of floor reflections
ASTM E1111 specifies a carpet with an SAA lying in the range 0.2 to 0.4. To investigate whether this is a critical factor in the testing, the measurements were repeated with the carpet covered on both sides of the barrier with a 50 mm thick layer of sound-absorbing foam. This material had a SAA value of 0.96.
In four cases the AC value increased by 10. In the remaining two cases the AC values did not change when the foam covered the carpet. Data for two ceilings are shown in Figure 9. Changes above 1000 Hz are small and could be due to random variations. Below
MEASUREMENTS
1000 Hz, the interference peaks and valleys are reduced by the action of the foam on the floor. These changes, however, are at frequencies that do not contribute strongly to the AC.
5 10 15 20 25 250 500 1k 2k 4k Frequency, Hz Av erage attenuation, dB A, foam AC 160 A, carpet, AC 150 F, foam AC 200 F, carpet, AC 200
Figure 9: Attenuations for two ceiling specimens for the carpeted floor and for the floor covered with 50 mm of sound-absorbing foam.
The change from a carpet with an SAA of 0.2 to foam with an SAA of 0.96 is much greater than that allowed in E1111 for the carpet (SAA 0.2 to 0.4). One can conclude therefore that, as long as the carpet has an SAA in the specified range, changes in the AC values due to changes in carpet absorption will be negligible.
Effect of changes to screen edge
In previous measurements in the anechoic chamber9 at NRC, absorption on the edge of the barrier had a significant effect on its insertion loss. ASTM E1111 specifies that the edge of the barrier should be absorptive. To investigate the effects of changes to the screen edge when a ceiling is present, the measurements on each ceiling system were carried out with an absorptive screen edge and a hard, 100-mm wide edge. Changes to the average attenuations were only a few tenths of a decibel and no value of AC changed. One may conclude from this that any increase in insertion loss due to having an absorptive screen edge will be overshadowed by reflections from the ceiling.
MEASUREMENTS
Change in height of barrier above measurement axis
Since the top edge of the screen is only 0.3 m above the
measurement axis, there is a limit to the attenuations that can be achieved in an E1111 measurement. The limit arises when the sound reflected from the ceiling is much less than the sound diffracting over the barrier. Assuming a perfectly absorbing ceiling, AC values calculated at each measurement position range from 200 to 230 with an average of 210. These are the maximum possible values for any ceiling. Thus the test procedure does not discriminate amongst ceilings that achieve average AC ratings of 200 or so. The discrimination can be improved by increasing the distance between the measurement axis and top edge of the screen to increase the attenuation due to diffraction. One way to do that is to increase the height of the screen. A recent change in E1111 allows the screen height to be 1.8 m. The calculated maximum AC rating for this test configuration is 260.
Another approach might be to lower the measurement axis. This brings the source closer to the floor, which does not simulate reality, and floor reflections may be overly important. Despite this drawback, some measurements were made with the measurement axis 0.3 m above the floor as an experiment. The calculated maximum AC rating for this test configuration is 310. Measured values of AC are shown for two heights of the measurement axis in Table 3. The lower measurement height makes it clearer that ceilings E and F, despite the fairly high SAA, reflect a considerable amount of sound; the AC rating is 50 points (5 dB) below the calculated case for no ceiling.
MEASUREMENTS
Table 3: Articulation class values for two heights of measurement axis. Measurement height Ceiling 1.2 m 0.3 m A 150 200 B 150 200 C 160 210 D 170 220 E 200 260 F 200 260 No ceiling 210 310
This analysis confirms that where screens higher than 1.5 m are used in offices, it is very important to have highly absorptive ceilings to get the full benefit of the high screens.
Conclusions from the measurements
In the absence of E1111 test data, C423 SAA values can be used to select ceiling systems. The common recommended minimum SAA of 0.9 corresponds to a minimum AC of 180 when the screen height during the ASTM E1111 test is 1.5 m.
If necessary, one-third octave band attenuations for an ASTM E1111 test can be calculated from absorption coefficients obtained from a C423 test.
Algorithms for modeling
To model open office acoustics, an estimate of the energy reflected from the ceiling at each frequency is needed. It is known that C423 absorption coefficients can not be used directly to estimate reflection from ceilings. Absorption coefficients from a C423 test are often greater than one because of diffraction and other effects. At low frequencies, the characteristics of the E400 mount gives absorption coefficients that will not be applicable to real situations where the cavity behind the ceiling panel is not 400 mm. Despite these difficulties, the data collected in these measurements was used to
MEASUREMENTS
estimate reflection coefficients for each ceiling specimen and to relate these to C423 measurements.
The first step in for estimating the ceiling reflection is to calculate the insertion loss,
IL
, of the screen. The work done by Maekawa10is most often referred to and used as the basis for calculating the insertion loss due to a screen. Rather than read insertion loss values from the chart presented by Maekawa, it is common to use some formula that gives the same values as the best-fit line in the
Maekawa chart. Yamamoto and Takagi11 examined four formulas of different complexity that fit the Maekawa chart data with different precision. In this report, the second formula is used and referred to here as Yam2. It is
10 log N +13
forN
>1IL =
5+8N |N|
-0.55-0.143|N|for –0.3 <
N
<1 ( 1 )0
forN
< -0.3N
is the Fresnel number, which is defined asλ
−
+
=
2
(
A
B
d
)
/
N
where
A
is the distance from the source to the top of the screen,B
is the distance from the top of the screen to the receiving point,
d
is the straight line distance between the source and the receiving point, andλ
is the wavelength of sound at the frequency of interest. In other work done in this project9, different expressions were developed based on a set of measurements in our anechoicchamber. The applicable expression for the screen used in this work is
IL = 15.95 N
0.277,N > 0
( 2 )The screen insertion loss calculated using these expressions was used with the measured attenuation when the ceiling specimens were installed to estimate an effective ceiling absorption coefficient.
MEASUREMENTS
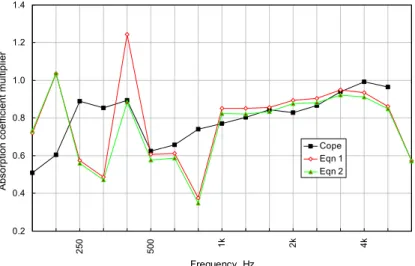
Adjustments were made to account for the different path lengths involved. Interference effects were not included in the analysis. The effective absorption coefficient was obtained by multiplying the measured coefficient by a constant for each band, k(f), that was adjusted to minimize the mean square difference between calculated and measured attenuations. Thus the effective absorption coefficient becomes k(f).α(f) and the attenuation due to reflection is
10 log[1- k(f).α(f)] dB. 0.2 0.4 0.6 0.8 1.0 1.2 1.4 250 500 1k 2k 4k Frequency, Hz Abs o rption c oeffic ient m u ltiplier Cope Eqn 1 Eqn 2
Figure 10: Absorption coefficient multipliers obtained in this work and
in the NRC COPE12 study.
Three curves are shown in Figure 10. Two come from the
measurements made in this project and use either equation ( 1 ) or equation ( 2 ). The differences between these two curves are mostly insignificant. The third curve comes from another study12 where similar calculations were made but two sizes of plenum above the ceiling were used. The agreement between the two projects at and above 1000 Hz is good.
The large variations in the multiplier obtained in this project below 1000 Hz are due to interference. Interference effects will be specific to any given installation and will depend, for example, on ceiling height. It is fortunate that in the frequency range most important for estimating speech privacy, these interference effects seem to be negligible.
MEASUREMENTS
As shown earlier in Figure 7, most of the contribution to AC comes from the frequency bands around 2000 Hz. In fact, about 80% of the AC for these ceilings is determined by the attenuations in the bands from 1000 to 5000 Hz. Thus for modeling, the choice of multipliers from Figure 10 is not too important but the COPE curve is probably the best choice since it is based on measurements made with two ceiling plenum depths, not just one. Because of that, effects due to the plenum depth at low frequencies will be averaged to some extent.
Estimated values for 1.8 m screen height
Having empirical multipliers available for estimating the attenuation for waves reflecting from the ceiling, allows one to calculate attenuations for the E1111 test with a screen height of 1.8 m. This results in a second set of AC values for the ceilings and a different correlation with C423 SAA values. The calculated AC values for 1.8 m and the measured values for 1.5 m are shown in Figure 11.
AC(1.5) = 102 SAA + 91 R2 = 0.90 AC(1.8) = 118 SAA + 93 R2 = 0.90 140 160 180 200 220 240 0.4 0.5 0.6 0.7 0.8 0.9 1.0 1.1 1.2 SAA AC Measured, 1.5 m Calc, 1.8 m
Figure 11: Correlation between SAA and AC values for two screen heights.
The proposed speech reduction average, SRA, again correlates better with the AC values. (Figure 12)
MEASUREMENTS AC(1.5) = 123 SRA + 67 R2 = 0.95 AC(1.8) = 146 SRA + 62 R2 = 0.97 140 160 180 200 220 240 0.5 0.6 0.7 0.8 0.9 1.0 1.1 1.2 SRA AC Measured, 1.5 m Calc, 1.8 m
Figure 12: Correlation between SRA and AC values for two screen heights.
REFERENCES
REFERENCES
1
ASTM E1111 Standard Test method for measuring interzone attenuation of ceiling systems.
2
ASTM C423 Standard Test method for sound absorption and sound absorption coefficients by the reverberation room method. 3
ASTM E1110 Standard Classification for determination of articulation class.
4
Measurements of Sound Propagation in Open Offices, A.C.C. Warnock and W.T. Chu. Internal Report IR836. Institute for Research in Construction. NRCC. August 2000.
5
Voice and Background Noise Levels Measured in Open Offices, W.T. Chu and A.C.C. Warnock. Internal Report IR837. Institute for Research in Construction. NRCC. August 2000
6
Guide To Open Office Acoustics, A.C.C. Warnock. Research Report B3144.3. Institute for Research in Construction. NRCC. August 2000
7
Sound Propagation in a Simulated ‘Team-style’ Open Office, W.T. Chu and A.C.C. Warnock. Research Report RR-156, Institute for Research in Construction. NRCC. September 2001.
8
Detailed Directivity of Sound Fields around Human Talkers, W.T. Chu and A.C.C. Warnock. Research Report RR-104, Institute for Research in Construction. NRCC. September 2001.
9
Measurements of screen insertion loss in an anechoic chamber, A.C.C. Warnock and W.T. Chu. Research Report RR-157. Institute for Research in Construction. NRCC. September 2001.
10
Noise Reduction by Screens. Z. Maekawa. Appl. Acoustics, 1, p.157, 1968.
11
Expressions of Maekawa’s Chart for Computation. K. Yamamoto and K. Takagi. Appl. Acoustics, 37, p75, 1992.
REFERENCES
12
Prediction of the speech intelligibility index behind a single screen
in an open-plan office, Applied Acoustics, 63, (8), August 2002 and Acoustic Behavior of a Single Screen Barrier in an Open-plan Office.
C. Wang and J.S. Bradley. Report B3205.1, January 2001.