Publisher’s version / Version de l'éditeur:
Quantitative Nondestructive Evaluation, pp. 270-277, 2004-02-26
READ THESE TERMS AND CONDITIONS CAREFULLY BEFORE USING THIS WEBSITE.
https://nrc-publications.canada.ca/eng/copyright
Vous avez des questions? Nous pouvons vous aider. Pour communiquer directement avec un auteur, consultez la
première page de la revue dans laquelle son article a été publié afin de trouver ses coordonnées. Si vous n’arrivez pas à les repérer, communiquez avec nous à PublicationsArchive-ArchivesPublications@nrc-cnrc.gc.ca.
Questions? Contact the NRC Publications Archive team at
PublicationsArchive-ArchivesPublications@nrc-cnrc.gc.ca. If you wish to email the authors directly, please see the first page of the publication for their contact information.
NRC Publications Archive
Archives des publications du CNRC
This publication could be one of several versions: author’s original, accepted manuscript or the publisher’s version. / La version de cette publication peut être l’une des suivantes : la version prépublication de l’auteur, la version acceptée du manuscrit ou la version de l’éditeur.
For the publisher’s version, please access the DOI link below./ Pour consulter la version de l’éditeur, utilisez le lien DOI ci-dessous.
https://doi.org/10.1063/1.1711634
Access and use of this website and the material on it are subject to the Terms and Conditions set forth at
Optical amplification of the laser-ultrasonic signal
Blouin, A.; Monchalin, J.-P.
https://publications-cnrc.canada.ca/fra/droits
L’accès à ce site Web et l’utilisation de son contenu sont assujettis aux conditions présentées dans le site LISEZ CES CONDITIONS ATTENTIVEMENT AVANT D’UTILISER CE SITE WEB.
NRC Publications Record / Notice d'Archives des publications de CNRC:
https://nrc-publications.canada.ca/eng/view/object/?id=90def084-a130-4dde-afe2-0491a3c9ebc1 https://publications-cnrc.canada.ca/fra/voir/objet/?id=90def084-a130-4dde-afe2-0491a3c9ebc1OPTICAL AMPLIFICATION OF THE LASER-ULTRASONIC
SIGNAL
A. Blouin and J.-P. Monchalin
Industrial Materials Institute, National Research Council of Canada, 75 de Mortagne Blvd., Boucherville, Québec, J4B 6Y4, Canada
ABSTRACT. Optical amplification of the detection laser light seems an elegant method to improve the sensitivity of a system for the optical detection of ultrasound. However, the amplified spontaneous emission associated to the optical amplification process is a source of both phase and intensity noises. Two configurations are possible, one with the amplifier located ahead of the inspected surface (pre-amplification) and one after (post-(pre-amplification). We discuss the advantages and drawbacks of these two schemes when a photorefractive two-wave mixing demodulator is used.
INTRODUCTION
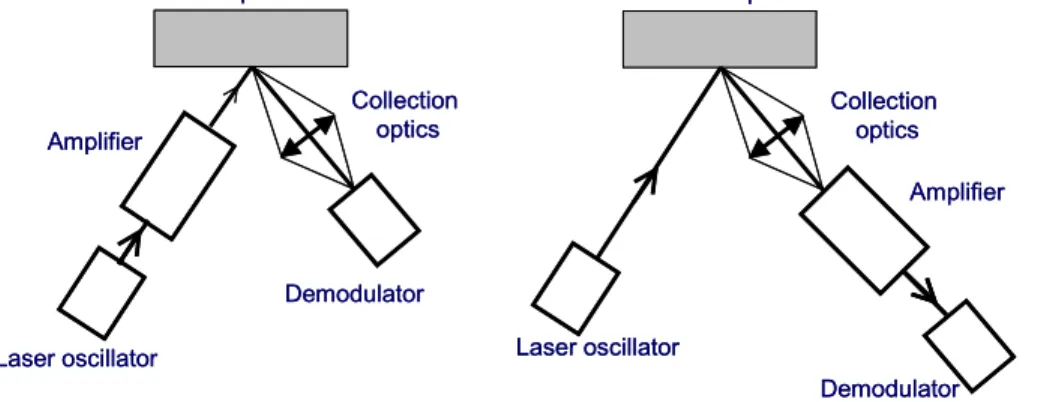
A laser-ultrasonic detection system is composed of three main components: 1) a stable, single mode detection laser, 2) an illumination and collection optical system and 3) a phase demodulator including an interferometer, optical components and photodetectors. To get a detection system sensitive enough for measuring at a distance the small ultrasonic surface displacements (a few nm typically) on highly scattering and absorbing industrial surfaces, the detection laser should have a power of about 1 kW. In practice, such a power is obtained with a pulsed laser. A pulse duration of about 60 µs is usually sufficient to capture several ultrasonic echoes bouncing back and forth in the part. This detection laser is made up in practice of a very stable, single mode, cw laser-oscillator followed by optical amplifiers. The high peak power is desirable since the ultrasonic displacement signal increases linearly with the light power sent to the demodulator while the shot-noise increases as the square-root of this light power. In other words, assuming that the shot-noise is the dominant shot-noise source, the more light power is sent to the demodulator the more sensitive is the detection system to the ultrasonic surface displacement. The maximum peak power of this detection laser is limited for example by the optical damage threshold of the inspected materials or by the self-oscillation threshold of the amplifying scheme. An elegant approach to overcome these peak power limitations is to amplify the light collected back from the surface by adding an amplifier between the optical collection system and the interferometer. We called this approach post-amplification of the signal while the conventional detection uses pre-amplification of the signal; pre and post refers to amplification before and after the light has reached the surface of the inspected part. Sketches of the two schemes are shown in figure 1. This paper is about the advantages and drawbacks of the pre- and post-amplification of the optical laser beam of the laser-
CP700, Review of Quantitative Nondestructive Evaluation Vol. 23, ed. by D. O. Thompson and D. E. Chimenti 2004 American Institute of Physics 0-7354-0173-X/04/$22.00
FIGURE 1. Sketches of the (a) pre- and (b) post-amplification schemes.
ultrasonic detection system when a photorefractive two-wave mixing demodulator (PTWMD) is used. The analysis below is also essentially focused on the cases where the amplifiers are operated in the linear regime and does not intend to describe all other cases where the optical amplifiers are driven in a strong saturation regime1.
The detectivity of a laser-ultrasonic detection system is characterized by the minimum surface displacement (MSD) that can be measured. The best detectivity is obtained when the dominant noise of the photodetector is the signal shot-noise. In this case, the MSD increases as the square root of the light power sent to the demodulator. Another source of noise is the Johnson (or thermal or resistor) noise. The Johnson noise does not depend on the incident light power on the photodetector. Therefore a photodetector can be designed such that the shot-noise dominates the Johnson noise for a given range of light power, resulting in an optimum detectivity even for low light power sent to the demodulator. However, one should keep in mind that the detectivity varies as the square root of the light power sent to the demodulator and a low light power means a low detectivity. The two other major limiting noise sources are the laser-oscillator intensity and phase fluctuations and the amplified spontaneous emission (ASE) from the optical amplifiers, both are of photonic origin. Laser-oscillators available on the market are very stable and some have an electronic noise eater system. The phase and intensity fluctuations are very small and usually in a limited frequency range that can be selected outside the ultrasonic frequency range. In addition, with the PTWMD, the intensity fluctuations are eliminated by the balanced detection scheme and the phase fluctuations are eliminated by keeping the pump and signal beampaths nearly equal. Regarding the ASE noise sources, we will show that these noise sources found in any laser amplifying inverted-medium limit the post-amplification approach.
BASIC EQUATIONS
Assuming that the output of a single frequency (single transverse and longitudinal mode) laser-oscillator of power Ps is received by a PTWMD after it goes through
amplifiers, lossy components, including a scattering surface in ultrasonic motion. Inside the demodulator, the received modulated light is mixed with a pump beam, previously extracted from the laser, to create a local oscillator beam of power PLO. The amplitude of
this local oscillator beam is fixed by the photorefractive gain of the crystal. The received light beam and local oscillator are then mixed and beat on the photodetectors of a balanced detection scheme. Assuming photorefractive anisotropic diffraction configuration, the currents on each photodetector of the balanced detection scheme are given by2:
Laser oscillator Collection optics Demodulator Amplifier Test sample Laser oscillator Collection optics Demodulator Amplifier Test sample Laser oscillator Collection optics Demodulator Amplifier Test sample Laser oscillator Collection optics Demodulator Amplifier Test sample 271
[
]
[
1 2 ()]
2 ) ( 2 2 2 t x x e GLP h e t P e GLP P e GLP h e i x s LO x s LO x s d = + ± Φ = + ± Φ − − − ± ην α α ην α γ γ (1)where η is the detector efficiency, e is the electrical charge of the electron, hν is the photon energy, α, x and γ are the absorption coefficient, the length and the photorefractive amplitude gain of the photorefractive crystal respectively, G is the amplifier gain and L is the overall attenuation coefficient due to optical losses in the detection channel, Φ is the phase modulation produces by the ultrasonic surface displacement. The balanced detection scheme photocurrent proportional to the ultrasonic surface displacement is given by:
) ( 2 t x e GLP h e is = s −xγ Φ ν η α . (2)
The main contribution to the attenuation coefficient L is the collection loss equal to the ratio of the laser power collected back from the part scattering surface to the laser power incident on this surface. By definition G is larger than one and L is smaller than one. The ASE power in any spatial mode is given by:
ν ν µ ∆ − = G h PASE ( 1) (3)
in which µ is the laser medium inversion factor and ∆ν is the spontaneous emission bandwidth. Note that this formula assumes that µ is constant throughout the laser medium and that the amplifier is operated in the unsaturated or linear regime.
The photocurrent noise sources power are3: 1) The signal shot-noise :
[
2]
2 2 2 GLPe 1 x h B e i x s e shot ν γ η α + = − (4)in which Be is the electronic detection bandwidth and Ps is the light power injected in the
amplifier. The shot-noise is then proportional to the signal power incident on the photodetector (GLPs).
2) The shot-noise produced by the ASE :
[
]
x ASE e sp shot N P L e h B e i α ν η − − = 2 2 2 (5) in which N is the number of spatial modes seen by the photodetector. This ASE shot-noise is proportional to the ASE incident on the photodetector, N PASE L.3) The noise produced by the beat note of the various modes of the ASE:
[
]
x ASE e sp sp N P L e B h e i α ν ν η 2 2 2 2 − − ∆ = . (6)This noise power is proportional to the product of the number of modes seen by the photodetector and the square of the ASE power in each mode incident on the photodetector, N (PASE L)2. This noise source can be eliminated or at least strongly reduced
by the balanced detection scheme.
4) The noise produced by the beat note of the amplified signal and ASE: 272
[
][
]
x ASE s e sp s GLP P Le B h e i α ν ν η 2 2 2 2 − − ∆ = . (7)This noise power is proportional to the product of the signal power and the ASE incident on the photodetector, [GLPs ] [PASE L]. This noise source can be eliminated or at
least strongly reduced by the balanced detection scheme.
5) The noise produced by the beat note of the local oscillator and ASE:
[
]
[
]
x ASE x s e sp LO GLPe x P L e B h e i α γ α ν ν η − − − ∆ = 2 2 2 2 . (8)This noise power is proportional to the product of the signal power and the ASE incident on the photodetector, [GLPs ] [PASE L]. It can be easily shown that equation (8) is valid for
a signal power GLPs confined to a single spatial mode or distributed in multiple spatial
modes.
Two other noise contributions are produced by the beat note between the ASE of the pump beam diffracted by the photorefractive grating and either the ASE of the signal beam or the amplified signal beam. Since the ASE beams are not spatially coherent the amount of ASE light diffracted by the grating is not easily evaluated, but is expecting to be low. In a first approximation, we may assume that these contributions are negligible compared to the other noise sources. It should be noted that these two contributions are not eliminated by the balance detection scheme.
Note that in equations 5, 6, 7 and 8, we have assumed that the ASE is affected by the same loss factor as the signal. This assumption is valid for pre-amplification but, for post-amplification, these equations have to be modified.
The signal-to-noise ratio at the amplifier output is then given by:
2 2 2 2 ) ( sp LO sp shot shot s out i i i i SNR − − + + = . (9)
In addition, the ASE light power could affect the photorefractive grating written by the coherent pump and signal beams, resulting in reduced diffraction coefficient (γ) and demodulator sensitivity. The ASE power received by the demodulator can be reduced with a spatial filter to limit the number of modes (N) and with a spectral filter to reduce the bandwidth.
A good noise figure is obtained by normalizing the SNR at the detection system output to the SNR at laser-oscillator output, which is the initial SNR sent in the detection system. in out SNR SNR NF = in which Φ + = − 2 1 2 x x B h e P SNR e x s in γ γ ν η α . (10)
SNRin gives the signal-to-noise ratio obtained on a mirror test part and a lossless
optical system, and assuming, for simplicity, that all the laser-oscillator power is used for the signal beam. The pump beam can be, for example, made by amplifying a small beam power previously extracted from the oscillator or by first sending all the laser-oscillator power in the crystal and using the beam at the output of the crystal as the signal beam. It should be noted that optimum characteristics of the PTWMD are obtained for a
pump beam power much larger than the signal beam power. The NF is a measure of the improvement or degradation of the initial laser-oscillator signal-to-noise ratio as it goes through the optical detection system including amplifiers and lossy components.
In an ideal PTWMD, γx >> 1 and α→0, which results in local oscillator power (PLO)
much larger than the signal power (Ps) and a
Φ = e s ideal in B h P SNR ν η 2 . (11)
More realistic values obtained with an InP:Fe photorefractive crystal under an applied field are γx=0.3 and αx=0.8.
PRE-AMPLIFICATION OF THE OPTICAL SIGNAL
Since the gain of the optical amplifier G is much larger than one, then (G-1) ≈ G. The product GL is then the net optical gain of the optical system or the ratio of the power received by the photodetector to the power of the laser-oscillator. The pump beam is extracted from the signal beam at the output of the amplifier. Since the losses associated to the low ratio of the light collected back from the part surface to the light sent to the surface are large, only a few percent of the amplified signal beam is required to get a pump beam power much larger than the signal beam power.
As previously mentioned, the optimum detectivity is obtained when ishot, the
shot-noise produced by the signal, is the dominant shot-noise source. With a proper optical system for the illumination of the surface part, the number of ASE modes captured by the photodetector can be made small enough such that the contributions of isp-sp and ishot-sp are
negligible compared to the iLO-sp contribution and the photorefractive grating strength is not
affected by the ASE power. As mentioned before, the isp-sp and is-sp noises are strongly
reduced or even eliminated by a demodulator equipped with a balanced detection scheme. In principle, since the signal Ps is single transverse mode, N can be reduced to unity,
in practice we may assume that N<10. Figure 2 shows the variation of NF versus the net gain GL. The signal shot-noise power (ishot)2 varies as (GL), (iLO-sp)2 varies (GL)2 and the
signal power varies as (GL)2. Then for GL smaller than about 5, ishot dominates iLO-sp and
from equation (8) the SNR grown as GL . For GL larger than about 5, iLO-sp dominates
ishot and the NF becomes independent of GL. The NF saturates to a maximum value of
(
)
x e x x ηµγ α γ − + 2 21 . This saturation of the noise figure means that the amplification
process adds as much noise as signal. For example, for µ=1, η=0.9 and with the
FIGURE 2. Noise figure NF versus the net gain GL for pre-amplification of the optical signal with the following parameters hν =1.17 eV, η=0.9, Be=20 MHz, µ=1, N=10, ∆ν=130 GHz, γx=0.3 and αx=0.8.
0 1 2 3 4 5 0 10 20 30 40 50 Net gain (GL) N oi s e f igur e ( N F ) 274
parameters of an InP:Fe crystal, the maximum NF is about 5. It is worth noting, that this maximum NF corresponds to SNRout tending to SNRinideal and is reached for a power on
the photodetector larger than the laser-oscillator power. With an ideal PTWMD, the saturation is obtained for GL of about 1, which means for a power on the photodetector equal to the laser-oscillator power. This limit shows that even in the ideal case, the pre-amplification noise figure cannot exceed the laser-oscillator noise figure since the amplifying medium always adds noise. In addition, this analysis shows that pre-amplification can compensate for the non-ideal characteristics of the PTWMD.
From these results, we can conclude that it is better to operate the system with a laser-oscillator as powerful as possible and with the lowest possible noise. However, in practice, the losses associated to the low ratio of the light collected back from the part surface to the light sent to the surface are so large, that the net gain is typically very small (e.g.10-4). Note that for small value of the net gain, NF = GL .
For example, the detection system built at IMI for the inspection of composites is based on the pre-amplification scheme. The collection system has a large etendue of about 0.35 mm2 sr to gather as much light as possible from the scattering surface. The laser-oscillator power is 200 mW and the output of the detection laser is about 1 kW peak power for a gain G of about 5 x10³. Among the 1 kW sent to the surface only about 1 mW is received by the demodulator photodetector, giving a loss coefficient L ≈10-6 and a net gain of about 5 x10⁻³. With such a low net gain the shot-noise is still the dominant noise source and the system detectivity increases as the square-root of the light power received by the demodulator. A net gain of 5 x10⁻³ will result in a NF of 0.07. So, in a practical laser-ultrasonic detection system, the pre-amplification of the laser-oscillator power allows to increase the amount of light collected back from the surface and sent to the photodetector while maintaining shot-noise limited operation. The net result is an increased detectivity to ultrasonic displacement when compared to the non-amplified laser-oscillator alone. POST-AMPLIFICATION OF THE OPTICAL SIGNAL
For the post-amplification configuration, the signal is amplified after being scattered and collected from the part surface. The ASE is not attenuated by the scattering-collection process. Accordingly, the previous equations should be modified by replacing the terms PASE L by PASE. This results in greater ASE noise contributions compared to the
pre-amplification configuration. In addition, the signal beam is changed from one spatial mode to many spatial modes after scattering and collection from the surface. This multimode beam is then amplified. It follows that many modes of the ASE are collected and seen by the photodetector, increasing isp-sp and ishot-sp noise contributions and reducing the
photorefractive grating strength. For large enough ASE modes collected N, the ASE power becomes large enough to reduce or even washout the grating. In addition, isp-sp and ishot-sp
become comparable to iLO-sp. This number of collected ASE modes can be reduced by
spatial filtering with the drawback of reducing the system etendue or light gathering efficiency. The collected ASE modes can also be reduced by adding optical spectral filters such as optical etalons to limit ∆ν, the spontaneous emission bandwidth seen by the photodetector. These spatial and spectral filters increase the complexity and the cost of the detection system. In addition, the isp-sp and is-sp noise are strongly reduced or even
eliminated by a demodulator equipped with a balanced detection scheme. However, assuming that one can make isp-sp, is-sp and ishot-sp negligible compared to iLO-sp, the
maximum NF is obtained for iLO-sp comparable to ishot.
[
][
]
[
]
[
2]
2 2 2 1 1 2 ) 1 ( 2 x x e G x e GLP h B e e h G x e GLP B h e i i x x s e x x s e shot sp s γ γ ηµ γ ν η ν ν µ γ ν ν η α α α α + = + ∆ − ∆ = − − − − − . (12)Then, for η=0.9, µ=1, γx=0.3 and αx=0.8, the noise is dominated by iLO-sp as long as
the gain G is larger than 5, which is always the case for an amplifier. For G>>1, the maximum value of NF is L(1+γx2) ηµγx2e−αx . The maximum NF in the post-amplification is reduced by a factor equal to the square-root of the losses compared to the maximum NF of the pre-amplification configuration. It should also be noted that in this case of G>>1 the SNR becomes independent of the photorefractive parameters.
In a practical post-amplification scheme, an etendue smaller than the 0.35 mm2 sr of the IMI system to reduce the number of modes N collected by the system coupled to spatial and spectral filtering could allow operation in the regime where iLO-sp is the
dominant noise source. Reduction of the etendue results in an increase of losses. Reasonable values are L is 10-7, one order of magnitude smaller than in the pre-amplification regime and ∆ν≈50 MHz obtained by spectral filtering. The NF versus the net gain in these conditions is shown in figure 3. Assuming a gain amplifier of 5 x 10³, as for the pre-amplification, the net gain is 5 x 10⁻⁴. This means that NF is operated at its maximum value of 1.5 x 10⁻³. For comparison, the NF of the pre-amplification was 0.07. Using the same amplifier in both schemes, the detectivity of the post-amplification is shown to be about two orders of magnitude smaller then the pre-amplification detectivity. USING BOTH PRE- AND POST-AMPLIFICATION
Improvement of the post-amplification scheme is expected by adding a pre-amplifier to the post-amplification setup. As shown above, for high loss coefficient, the light collected back from the surface in the pre-amplification scheme is dominated by the shot-noise. Then, adding pre-amplification is equivalent to increase the light power of the laser-oscillator Ps by the pre-amplifier gain coefficient. The NF of the post-amplification will
then be improved by the square-root of G. For example for a gain coefficient of 5 x 10³, the NF is improved to 1 x 10⁻¹, which is about the same as in the pre-amplification scheme. It should be noted that we have assumed losses of one order of magnitude larger than for the pre-amplification scheme treated above, which corresponds to a relatively low collection etendue, a requirement to decrease the number of ASE modes.
FIGURE 3. Noise figure NF vs the net gain GL for post-amplification of the optical signal with the following parameters hν =1.17 eV, η=0.9, Be=20 MHz, µ=1, N=10, ∆ν=50 MHz, L=10
-7 , γx=0.3 and αx=0.8. 0.0E+00 5.0E-04 1.0E-03 1.5E-03 2.0E-03
0.0E+00 5.0E-06 1.0E-05
Net gain (GL) N o ise f igur e (N F) 276
CONCLUSION
For the pre-amplification scheme, we have shown that the high optical loss coefficient intrinsic to any industrial laser-ultrasonic detection system, allows the shot-noise to dominate the other ASE noise sources. For an ideal PTWMD, this remains true as long as the net gain defined as the product of the laser gain by the optical losses, is smaller than one. The maximum value of the detectivity obtained for a net gain of about 1 is about the same as the detectivity expected from a laser-oscillator detecting displacement on a lossless mirror. Then, the maximum detectivity is limited by the laser-oscillator power. In the IMI laser-ultrasonic detection system designed for composite inspection, the net gain is about 5 x 10⁻³ and the detectivity is about an order of magnitude smaller than the maximum value fixed by the laser-oscillator power.
For the post-amplification, since the amplifier is located after the scattering surface the ASE noise sources are not attenuated and become dominant over the shot-noise. The ASE noise source can be reduced by adding fine spectral filtering components and by reducing the system etendue, with the drawback of increasing the losses. With these efforts the maximum NF or detectivity obtained is about two or three orders of magnitude smaller than the NF of the pre-amplification scheme. The post-amplification is then not very attractive, particularly with the PTWMD. Coupling both pre- and post-amplification does not improve the NF over the pre-amplification scheme alone. In conclusion, this analysis shows that pre-amplification with a stable and low-noise laser-oscillator should be generally preferred for its effectiveness and simplicity. While the post-amplification scheme can be used to increase the light power above the Johnson noise, this can be more easily done by modifying the photodetector.
This analysis has also shown that one can become insensitive to the photorefractive parameters when GL>>1 in the pre-amplification case and G>>1 in the post-amplification one, i.e. the results obtained are the same as if an ideal PTWMD had been used.
Finally, it should be noted that these conclusions are solely based on a theoretical analysis and they will need to be confirmed by experimentation. In addition, the analysis above does not cover all the possible configurations, more specifically those in which very high gain saturation prevail, with the effect of reducing spontaneous emission and for which different conclusions might be reached.
ACKNOWLEDGEMENTS
The authors acknowledge that this work supported by the National Research Council of Canada was partially performed as partner in the project “Improved NDE Concepts for Innovative Aircraft Structures and Efficient Operational Maintenance” (INCA) of the European Commission, EC Contact no. G4RD-CT2001-00507
REFERENCES
1. Post amplification scheme with the amplifier operated in the saturation level is currently being developed by a partner through the project “Improved NDE Concepts for Innovative Aircraft Structures and Efficient Operational Maintenance” (INCA) supported by the European Commission, EC Contact no. G4RD-CT2001-00507 2. Delaye, P., Blouin, A., Drolet, D., de Montmorillon, L.-A., Roosen, G., Monchalin,
J.-P., Journal of the Optical Society of America B14, 1-12, 1997.
3. Kingston, R.H., Optical Sources, Detectors and Systems, Fundamentals and applications, Academic Press, (1995), pp. 130-137.