https://doi.org/10.4224/8913347
READ THESE TERMS AND CONDITIONS CAREFULLY BEFORE USING THIS WEBSITE. https://nrc-publications.canada.ca/eng/copyright
Vous avez des questions? Nous pouvons vous aider. Pour communiquer directement avec un auteur, consultez la première page de la revue dans laquelle son article a été publié afin de trouver ses coordonnées. Si vous n’arrivez pas à les repérer, communiquez avec nous à PublicationsArchive-ArchivesPublications@nrc-cnrc.gc.ca.
Questions? Contact the NRC Publications Archive team at
PublicationsArchive-ArchivesPublications@nrc-cnrc.gc.ca. If you wish to email the authors directly, please see the first page of the publication for their contact information.
NRC Publications Archive
Archives des publications du CNRC
For the publisher’s version, please access the DOI link below./ Pour consulter la version de l’éditeur, utilisez le lien DOI ci-dessous.
Access and use of this website and the material on it are subject to the Terms and Conditions set forth at
An Empirical Evaluation of the ISO/IEC 15504 Assessment Model
El-Emam, Khaled; Jung, H.-W.
https://publications-cnrc.canada.ca/fra/droits
L’accès à ce site Web et l’utilisation de son contenu sont assujettis aux conditions présentées dans le site LISEZ CES CONDITIONS ATTENTIVEMENT AVANT D’UTILISER CE SITE WEB.
NRC Publications Record / Notice d'Archives des publications de CNRC:
https://nrc-publications.canada.ca/eng/view/object/?id=2e363196-bc9b-439d-98ac-817835cd3b18 https://publications-cnrc.canada.ca/fra/voir/objet/?id=2e363196-bc9b-439d-98ac-817835cd3b18National Research Council Canada Institute for Information Technology Conseil national de recherches Canada Institut de technologie de l'information
An Empirical Evaluation of the ISO/IEC 15504
Assessment Model *
El-Emam, K., Jung, H.-W.
February 2000
* published as NRC/ERB-1075. February 2000. 34 pages. NRC 43654.
Copyright 2000 by
National Research Council of Canada
National Research Council Canada Institute for Information Technology Conseil national de recherches Canada Institut de Technologie de l’information
An Empirical Evaluation of the
ISO/ IEC 1 5 5 0 4 Assessment
M odel
Khaled El-Emam and Ho-Won Jung
February 2000
An Empirical Evaluation of the ISO/IEC 15504
Assessment Model
Khaled El Emam Ho-Won Jung
National Research Council, Canada Institute for Information Technology
Building M-50, Montreal Road Ottawa, Ontario Canada K1A OR6 Khaled.El-Emam@iit.nrc.ca
Dept. of Business Administration Korea University Anam-dong 5Ka Sungbuk-gu, Seoul 136-701 Korea hwjung@kuccnx.korea.ac.kr
Abstract
The emerging International Standard ISO/IEC 15504 (Software Process Assessment) includes an exemplar assessment model (known as Part 5). Thus far, the majority of users of ISO/IEC 15504 employ the exemplar model as the basis for their assessments. This paper describes an empirical evaluation of the exemplar model. Questionnaire data was collected from the lead assessors of 57 assessments world-wide. Our findings are encouraging for the developers and users of ISO/IEC 15504 in that they indicate that the current model can be used successfully in assessments. However, they also point out some weaknesses in the rating scheme that need to be rectified in future revisions of ISO/IEC 15504.
1 Introduction
ISO/IEC 15504 is an emerging International Standard on Software Process Assessment. A prime motivation for developing this standard has been the perceived need for an internationally recognized software process assessment framework that pulls together the existing public and proprietary models and methods. Therefore, it is intended to act as an ‘umbrella’ that defines common requirements for process assessments. The ISO/IEC 15504 document set, however, does contains an exemplar assessment model (known as Part 5). One motivation for developing this model was to make it easier for organizations to use the standard immediately (i.e., without having to look further for an assessment model that they can use). More information about ISO/IEC 15504 may be found in [4].
Unique among software engineering standardization efforts, the developers of ISO/IEC 15504 deliberately initiated an international effort to empirically evaluate ISO/IEC 15504. This effort is known as the SPICE (Software Process Improvement and Capability dEtermination) Trials [3][9][15][16][29]. The SPICE Trials were conceived, partially, to address concerns within the software engineering community with the lack of evidence supporting software engineering standards; that they lack an empirical basis demonstrating that they indeed represent “good” practices. For instance, it has been noted that [19]
flawed research”, and [18] “many corporate, national and international standards are based on conventional wisdom [as opposed to empirical evidence]”. Similar arguments are made in [5][6][7]. From data collected thus far during the SPICE Trials, approximately 81% of the users of ISO/IEC 15504 employ this model as the basis for their assessments. This makes it important to perform systematic empirical evaluations of this model. Such evaluations would provide a substantiated basis for using the model, as well as give the developers of ISO/IEC 15504 information as to the necessary improvements to make. In fact, one of the recurring questions during the development of ISO/IEC 15504 was “how good is the exemplar model ?”1
The purpose of this paper is to provide some answers to this question. Specifically, we report on an international empirical study that evaluated the ISO/IEC 15504 exemplar assessment model. The study was performed during the SPICE Trials. Questionnaire data was collected from the lead assessors of 57 assessments that used the model. Their responses were evaluated in terms of the extent to which they support, or otherwise, the current model.
Briefly, our findings indicate that a majority of the assessors used Part 5 as a source of indicators for conducting their assessments. In general, they found Part 5 both useful and easy to use. Furthermore, they were satisfied with the level of detail of the exemplar model, although a minority indicated that less detail in the collected evidence would not have harmed the accuracy of their judgements. However, the assessors also expressed doubts about the consistency and repeatability of their process attribute ratings. A closer examination indicated a concern with ratings at levels 4 and 5. Finally, they found it easier to rate at the extremes of the rating scale, but had more difficulty rating at the middle of the scale. These findings are encouraging in that they indicate that the current model can be used successfully in assessments. However, they also point out some weaknesses in the rating scheme that need to be rectified in future revisions. Based on the results of this study, further focused investigations of the rating scheme are planned to confirm the identified problems.
The paper is organized as follows. In the following section we provide an overview of the exemplar model that was evaluated. This will help the reader understand the various questions that were asked during the evaluation study. Then in Section 3 we present the research method that we followed. Section 4 contains the details of our results and their interpretation. We conclude the paper in Section 5 with a summary and directions for further work.
1
2 Background
In this section we present the context and an overview of the exemplar assessment model in ISO/IEC 15504. This presentation is intended to help link the items investigated in our study and the study results to the actual assessment model.
2.1 The Document Set
ISO/IEC 15504 is comprised of nine documents (known as parts).2 Figure 1 shows the nine parts, and indicates the relationships between them.
Part 6
Guide to qualification of assessors
Part 7
Guide for use in process improvement
Part 8
Guide for use in determining supplier process capability Part 3 Performing an assessment Part 4 Guide to performing assessments Part 2
A reference model for processes and process
capability
Part 5
An assessment model and indicator guidance
Part 1
Concepts and introductory guide
Part 9
Vocabulary
Part 1 is an entry point into ISO/IEC 15504. It describes how the parts of the document suite fit together,
and provides guidance for their selection and use. It explains the requirements contained within the standard and their applicability to the performance of an assessment.
Part 2 defines a two dimensional reference model for describing the outcomes of process assessment.
The reference model defines a set of processes, defined in terms of their purpose, and a framework for evaluating the capability of the processes through assessment of process attributes structured into capability levels. Requirements for establishing the compatibility of different assessment models with the reference model are defined.
Part 3 defines the requirements for performing an assessment in such a way that the outcomes will be
repeatable, reliable and consistent.
Part 4 provides guidance on performing software process assessments, interpreting the requirements of
Part 3 for different assessment contexts. The guidance covers the selection and use of a compatible assessment model; of a supportive method for assessment; and of an appropriate assessment instrument or tool. This guidance is generic enough to be applicable across all organizations, and also for performing assessments using a variety of different methods and techniques, and supported by a range of tools.
Part 5 provides an exemplar model for performing process assessments that is based upon and directly
compatible with the reference model in Part 2. The assessment model extends the reference model through the inclusion of a comprehensive set of indicators of process performance and capability.
Part 6 describes the competence, education, training and experience of assessors that are relevant to
conducting process assessments. It describes mechanisms that may be used to demonstrate competence and to validate education, training and experience.
Part 7 describes how to define the inputs to and use the results of an assessment for the purposes of
process improvement. The guide includes examples of the application of process improvement in a variety of situations.
Part 8 describes how to define the inputs to and use the results of an assessment for the purpose of
process capability determination. It addresses process capability determination in both straightforward situations and in more complex situations involving, for example, future capability. The guidance on conducting process capability determination is applicable either for use within an organization to determine its own capability, or by a acquirer to determine the capability of a (potential) supplier.
2.2 Assessments Using ISO/IEC 15504
The reference model defined in Part 2 provides a common basis for performing assessments of software process capability, allowing for the reporting of results using a common rating scale [11]. The overall architecture of ISO/IEC 15504 is defined in this reference model.
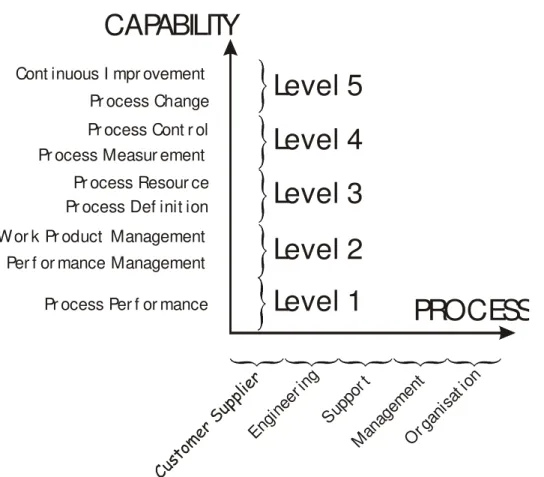
The architecture of ISO/IEC 15504 is two-dimensional as shown in Figure 2. One dimension consists of the processes that are actually assessed (the Process dimension) that are grouped into five categories. These are summarized in Table 1.
The second dimension consists of the capability scale that is used to evaluate the process capability (the Capability dimension). The same capability scale is used across all processes.
During an assessment it is not necessary to assess all the processes in the process dimension. Indeed, an organization can scope an assessment to cover only the subset of processes that are relevant for its business objectives.
Level 1
Level 2
Level 3
Level 4
Level 5
Pr ocess Per f or mance
W or k Pr oduct Management
Per f or mance Management
Pr ocess Def init ion
Pr ocess Resour ce
Pr ocess Measur ement
Pr ocess Cont r ol
Pr ocess Change
Cont inuous I mpr ovement
En
gi
ne
er
in
g
S
up
po
r t
M
an
ag
em
en
t
O
r g
an
is
at
io
n
PROCESS
CAPABILITY
Process Category Description of process category
Customer-Supplier (CUS)
Consists of processes that directly impact the customer, support development and transition of the software to the customer, and provide for its correct operation and use.
Engineering (ENG)
Consists of processes that directly specify, implement, or maintain a system and software product and its user documentation.
Support (SUP)
Consists of processes that may be employed by any of the other processes (including other supporting processes) at various points in the software life cycle.
Management (MAN)
Consists of processes that contain practices of a generic nature which may be used by anyone who manages any sort of project within a software life cycle.
Organization (ORG)
Consists of processes that establish the business goals of the organization and develop process, product, and resource assets that, when used by the projects in the organization, will help the organization achieve its business goals.
Table 1: Summary of the process categories.
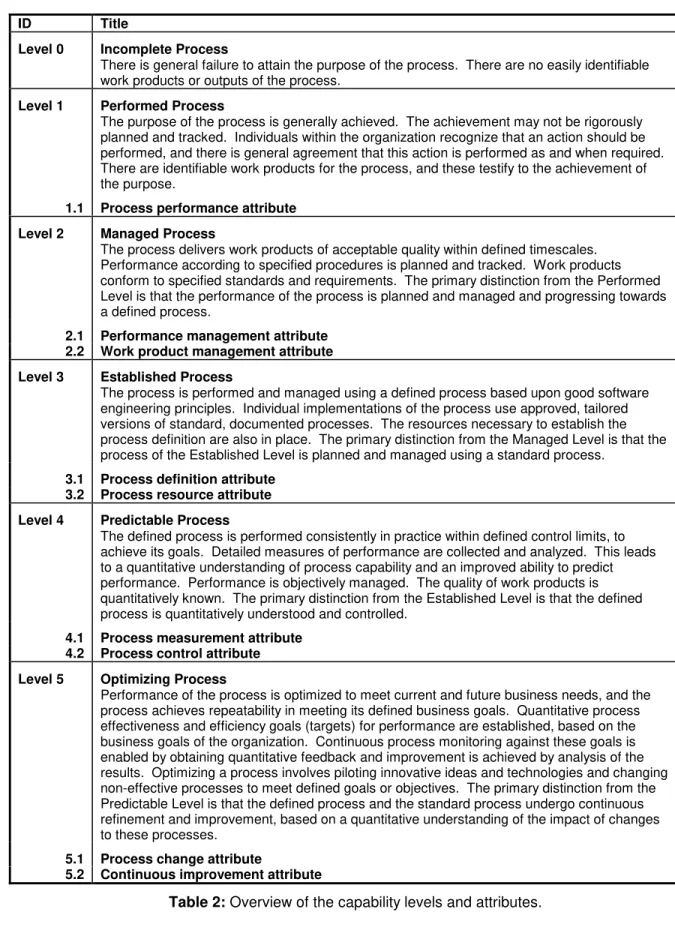
In ISO/IEC 15504, there are 5 levels of capability that can be rated, from Level 1 to Level 5. A Level 0 is also defined, but this is not rated directly. These 6 levels are shown in Table 2. In Level 1, one attribute is directly rated. There are 2 attributes in each of the remaining 4 levels. The attributes are also shown in Table 2 (also see [4]).
The rating scheme consists of a 4-point achievement scale for each attribute. The four points are designated as F, L, P, N for Fully Achieved, Largely Achieved, Partially Achieved, and Not Achieved. A summary of the definition for each of these response categories is given in Table 3.
The output from a process assessment is a set of process profiles, one for each instance of each process within the scope of the assessment. Each process profile consists of one or more process attribute ratings for an assessed process. Each attribute rating represents a judgment by the assessor of the extent to which the attribute is achieved.
The ratings on the attributes can be aggregated to produce a capability level. The aggregation scheme is summarized in Table 4.
The unit of rating in an ISO/IEC 15504 process assessment is the process instance. A process instance is defined as a singular instantiation of a process that is uniquely identifiable and about which information can be gathered in a repeatable manner [4].
ID Title
Level 0 Incomplete Process
There is general failure to attain the purpose of the process. There are no easily identifiable work products or outputs of the process.
Level 1 Performed Process
The purpose of the process is generally achieved. The achievement may not be rigorously planned and tracked. Individuals within the organization recognize that an action should be performed, and there is general agreement that this action is performed as and when required. There are identifiable work products for the process, and these testify to the achievement of the purpose.
1.1 Process performance attribute Level 2 Managed Process
The process delivers work products of acceptable quality within defined timescales. Performance according to specified procedures is planned and tracked. Work products conform to specified standards and requirements. The primary distinction from the Performed Level is that the performance of the process is planned and managed and progressing towards a defined process.
2.1 Performance management attribute 2.2 Work product management attribute Level 3 Established Process
The process is performed and managed using a defined process based upon good software engineering principles. Individual implementations of the process use approved, tailored versions of standard, documented processes. The resources necessary to establish the process definition are also in place. The primary distinction from the Managed Level is that the process of the Established Level is planned and managed using a standard process.
3.1 Process definition attribute 3.2 Process resource attribute Level 4 Predictable Process
The defined process is performed consistently in practice within defined control limits, to achieve its goals. Detailed measures of performance are collected and analyzed. This leads to a quantitative understanding of process capability and an improved ability to predict performance. Performance is objectively managed. The quality of work products is quantitatively known. The primary distinction from the Established Level is that the defined process is quantitatively understood and controlled.
4.1 Process measurement attribute 4.2 Process control attribute Level 5 Optimizing Process
Performance of the process is optimized to meet current and future business needs, and the process achieves repeatability in meeting its defined business goals. Quantitative process effectiveness and efficiency goals (targets) for performance are established, based on the business goals of the organization. Continuous process monitoring against these goals is enabled by obtaining quantitative feedback and improvement is achieved by analysis of the results. Optimizing a process involves piloting innovative ideas and technologies and changing non-effective processes to meet defined goals or objectives. The primary distinction from the Predictable Level is that the defined process and the standard process undergo continuous refinement and improvement, based on a quantitative understanding of the impact of changes to these processes.
5.1 Process change attribute
5.2 Continuous improvement attribute
The scope of an assessment is an Organizational Unit (OU) [4]. An OU deploys one or more processes that have a coherent process context and operates within a coherent set of business goals. The characteristics that determine the coherent scope of activity - the process context - include the application domain, the size, the criticality, the complexity, and the quality characteristics of its products or services. An OU is typically part of a larger organization, although in a small organization the OU may be the whole organization. An OU may be, for example, a specific project or set of (related) projects, a unit within an organization focused on a specific life cycle phase (or phases), or a part of an organization responsible for all aspects of a particular product or product set.
Rating & Designation Description
Not Achieved - N There is no evidence of achievement of the defined attribute.
Partially Achieved - P There is some achievement of the defined attribute.
Largely Achieved - L There is significant achievement of the defined attribute.
Fully Achieved - F There is full achievement of the defined attribute.
Table 3: The four-point attribute rating scale.
The reference model cannot be used alone as the basis for conducting reliable and consistent assessments of process capability since the level of detail provided is not sufficient. The descriptions of process purpose and process attributes in the reference model need to be supported with comprehensive sets of indicators of process performance and capability. These are provided in the exemplar model [12].
Scale Process Attributes Rating
Level 1 Process Performance Largely or Fully
Level 2 Process Performance Performance Management Work Product Management
Fully
Largely or Fully Largely or Fully Level 3 Process Performance
Performance Management Work Product Management Process Definition and Tailoring Process Resource Fully Fully Fully Largely or Fully Largely or Fully Level 4 Process Performance
Performance Management Work Product Management Process Definition and Tailoring Process Resource Process Measurement Process Control Fully Fully Fully Fully Fully Largely or Fully Largely or Fully Level 5 Process Performance
Performance Management Work Product Management Process Definition and Tailoring Process Resource Process Measurement Process Control Process Change Continuous Improvement Fully Fully Fully Fully Fully Fully Fully Largely or Fully Largely or Fully
Table 4: The aggregation scheme for converting ratings on the individual attributes into a capability level.
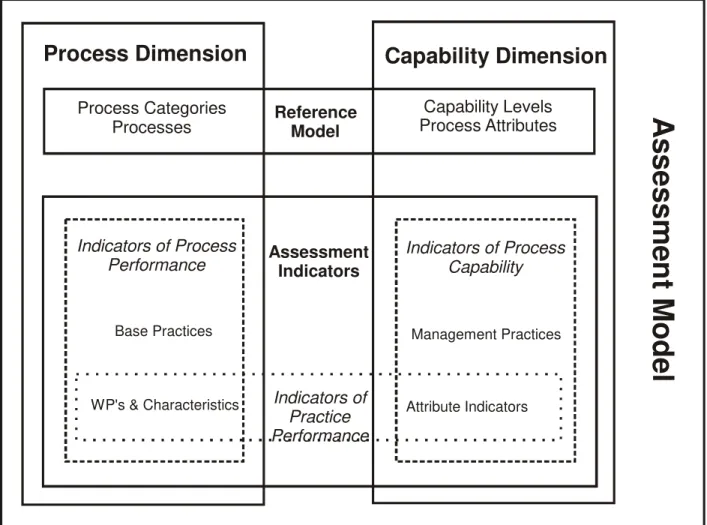
2.3 An Overview of Part 5 (The Exemplar Model)
The basic structure of this assessment model is identical to that of the reference model defined in Part 2. There is a one to one correspondence between the process categories, processes, process purposes, process capability levels and process attributes of the reference model and those of this assessment model.
A
s
s
e
s
s
m
e
n
t M
o
d
e
l
Process Dimension
Capability Dimension
Process Categories
Processes
Capability Levels
Process Attributes
Reference
Model
Assessment
Indicators
Indicators of
Practice
Performance
Indicators of Process
Performance
Indicators of Process
Capability
WP's & Characteristics Management Practices Attribute Indicators Base PracticesFigure 3: Relationship between the reference model and the assessment model.
The exemplar assessment model expands the reference model by adding the definition and use of assessment indicators (see Figure 3). Assessment indicators are objective attributes or characteristics of a practice or work product that support an assessor’s judgment of the performance or capability of an implemented process.
Two different classes of indicators can be identified: indicators of process performance, and indicators of process capability. These indicator types relate respectively to the base practices defined for the process dimension, and the management practices for the capability dimension. The classes and types of indicators, and their relationship to the assessment output, are shown in Figure 4.
Indicators are attributes or characteristics the existence of which confirms that certain practices are performed and for which it is possible to collect objective evidence during an assessment. All such evidence comes either from the examination of work products of the processes assessed, or from statements made by the performers and managers of the processes. The existence of the work products, and their characteristics, provide evidence of the performance of the practices associated with them.
Similarly, the evidence obtained from performers of the process provides evidence regarding the performance of the practices and the manner in which they are performed.
Base practices and work product characteristics relate to the processes defined in the process dimension of the reference model, and are chosen to explicitly address the achievement of the defined process purpose. They are defined to support the judgment of the achievement of the process purpose and outcomes. Processes also use and produce (input and output) work products with specific characteristics.
Management practices relate to the process attributes defined in the process capability dimension of the reference model. Evidence of their effective performance supports the judgment of the degree of achievement of the attribute. Management practices with their associated attribute indicators are the indicators of process capability. Specific management practices are linked to each process attribute. The set of management practices is intended to be applicable to all processes in the process dimension of the model.
Figure 4: The relationship between indicators and process attribute ratings.
Indicators of
Process Performance
Indicators of
Process Capability
Management Practices
Base Practices
Evidence of
Process Capability
Evidence of
Process Performance
PROCESS ATTRIBUTE RATINGS
based on:
provided by:
provided by:
consist of:
consist of:
assessed by:
assessed by:
Work Product Characteristics
Practice
Performance
Characteristics
Resources and
Infrastructure
Characteristics
3 Research Method
3.1 Data Collection
Our study was performed within the context of the SPICE Trials. The SPICE trials are a collaborative empirical research project involving approximately 50 people around the world.
The SPICE Trials have been divided into three broad phases corresponding with the different stages that an ISO standard has to progress through during its development. We are interested in the second phase. This phase started in September 1996 and data collection ceased in June 1998. A well defined infrastructure was set up during this period to collect data and to ensure its quality. This is described below.
During the trials, organizations contribute their assessment ratings data to an international trials database located in Australia, and also fill up a series of questionnaires3 after each assessment. The questionnaires collect information about the organization and about the assessment. From the SPICE Trials perspective, the world is divided into five regions: Europe and South Africa, South Asia Pacific, North Asia Pacific, Canada and Latin America, and USA. For each of these regions there is an organization that is responsible for managing the data collection and providing support. The organizations were: the European Software Institute, Griffith University, Nagoya Municipal Industrial Research Institute, Center de recherche informatique de Montreal, and the Software Engineering Institute respectively. These are termed “Regional Trials Co-ordinators”. Within each of these regions are a number of “Local Trials Co-ordinators” who operate at a more local level, such as within a country or state. There were 26 such co-ordinators world-wide during the second phase of the SPICE Trials. The co-ordinators (local or regional) interact directly with the assessors and the organizations conducting the assessments. This interaction involves ensuring that assessors are qualified, making questionnaires available, answering queries about the questionnaires, and following up to ensure the timely collection of data.
The data that is of concern in this paper was provided by the lead assessors. They filled up a questionnaire evaluating the exemplar model after each assessment. The questionnaire was divided into the following sections:
• Use of the Assessment Model • Usefulness and Ease of Use
• Meaningfulness of Rating Aggregation Scheme • Usability of the Rating Scale
• Usefulness of Indicators
• Understanding of the Process and Capability Dimensions
We analyze the questions in each of these sections.
An initial version of the questionnaire was constructed and reviewed by approximately 20 members of the trials team for understandability and consistency in interpretation. This feedback was used to develop a revision. The revised questionnaire was piloted in two assessments to determine whether there remained ambiguities in its wording. Again, this resulted in further refinements of the questionnaire, which was used in the current study.
3.2 Unit of Analysis
The unit of analysis in our study is the assessment. Even though an individual assessor may perform more than one assessment, they were requested to answer the questionnaire once for each assessment to reflect his/her experiences during that assessment.
3.3 Data Analysis
The objective of our analysis of the questionnaire responses was to identify the proportions of respondents who are supportive (as opposed to critical) of either the assessment model design decisions or the claim that it is usable. A supportive response is one:
• that says something positive about the assessment model, and/or
• that will not require any changes to the assessment model
3.3.1 Aggregation of Responses
We present our results in terms of the proportion of respondents who gave supportive answers. For each question, we identify the response categories that are supportive, and those that are critical. A proportion of supportive responses is then calculated.
For example, assume that a question asked the respondents to express their extent of agreement to the statement “There is sufficient detail in the assessment model to guide process improvement.”, and that it had the following four response categories: “Strongly Agree”, “Agree”, “Disagree”, and “Strongly Disagree”. As shown in Figure 5, the “Strongly Agree” and “Agree” responses would be considered supportive of the model, and the “Disagree” and “Strongly Disagree” responses would be considered to be critical of the assessment model.
Supportive Responses
Critical Responses
Strongly AgreeAgree
Disagree Strongly Disagree Figure 5: Types and examples of response categories.
The calculated proportions are estimates of population proportions. For the estimates, we compute the 90% confidence interval. This means that if we were to repeat the study a large number of times with different samples, and each time calculate the confidence interval, this interval will contain the population proportion 90% of the time. The confidence interval makes explicit the extent of imprecision inherent in the proportion of responses supportive of the assessment model. Computation of the confidence interval is described below.
We present our results in the form of tables that show the supportive and critical response categories for each question, estimated proportions, and the confidence interval.
3.3.2 Confidence Intervals
Suppose that a random sample of size
n
has been drawn from a large population and thatX
observations in this sample show positive response, then the proportion of supportive responses,p
, is estimated byP
=
X n
/
, wherep
andn
are the parameters of a binomial distribution. Since different samples will produce different estimated-values for the proportion of supportive response, we used a confidence interval,l
L≤ ≤
p
u
L, to infer the true (unknown) valuep
of the proportion of supportive responses for each question.For finding a confidence interval of the true mean
p
of sample proportionP
, the estimator of standard deviation ofP
becomesP
(1
−
P
) /
n
. Then a 90% percent confidence interval onp
is given by [17]/ 2 / 2
(1
)
(1
)
P
P
P
P
P
z
p
P
z
n
n
α α−
−
−
≤ ≤ +
,where
z
α/ 2 is the upper 5th percentile of the normal distribution. As we can be seen from the above equation, an increased sample size will narrow the confidence interval.The fact that our sample sizes were small means that the confidence intervals are quite large. Therefore, caution should be exercised when interpreting highly supportive responses; one should take into account the interval to determine the confidence that one can place in the calculated proportion (if the interval is large, the less precise the calculated proportion).
3.3.3 Missing Data
In our analysis we excluded all assessments that did not use the exemplar assessment model. It is compatible with ISO/IEC 15504 to use another assessment model, as long as it meets the stipulated requirements. However, only those assessors who have actually used Part 5 are certain to be able to answer questions directly relevant to the exemplar assessment model within.
However, not all questions were answered all the time even where the assessment model was used. This may be due to the assessor missing the questions while responding, running out of time, or not knowing how to answer it. Therefore we had missing data. It is not uncommon in software engineering to have data sets with missing data [30].
Ignoring the missing data and only analyzing the completed data subset can provide misleading results [14]. Therefore, we employed a method of multiple imputation to fill in the missing data repeatedly [23]. Multiple imputation is a preferred approach to handling missing data problems since it provides proper estimates of parameters and their standard errors.
The basic idea of multiple imputation is that one generates a vector of size
M
for each value that is missing. Therefore ann
mis×
M
matrix is constructed, wheren
mis is the number of missing values. Each column of this matrix is used to construct a complete data set, hence one ends up withM
complete data sets. Each of these data sets can be analyzed using complete-data analysis methods. TheM
analyses are then combined into one final result. Typically a value forM
of 3 is used, and this provides for valid inference [26]. Although, to err on the conservative side, some studies have utilized anM
of 5 [32], which is the value that we use.For our analysis the parameter of interest is the proportion, which we denote as
Qˆ
. Furthermore, we are interested in the standard error ofQˆ
, which we shall denote asU
, in order to construct the confidence interval. After calculating these values for each of the 5 data sets, they can be combined to give an overall value forQˆ
,Q
, and its standard errorT
. Procedures for performing this computation are detailed in [23], and summarized in [26]. In Section 6 we describe the multiple imputation approach in general, its rationale, and how we operationalized it for our specific study.3.3.4 Interpretation of Proportions
Based on feedback from the developers and early users of ISO/IEC 15504, it was established that 80% of the respondents being supportive of the elements of the standard was the evidence threshold for taking action [15]. We therefore use 80% supportive responses as a boundary for interpreting our results. If the estimated proportion is less than 80% then we consider that this is initial evidence that the particular issue
In some cases, the percentage of supportive responses is different from 80% as a consequence of sampling variability. We therefore use the confidence interval to test the hypothesis that there were less than 80% supportive respondents. Since the developers of ISO/IEC 15504 will likely only take action if the extent of supportive responses is less than 80%, we are interested in a one-tailed hypothesis. If the upper tail of the confidence interval includes 80%, then the null hypothesis of 80% support cannot be rejected at the one-tailed α level of 0.05.
4 Results
4.1 Descriptive Statistics
4.1.1 Summary of Assessed OUs
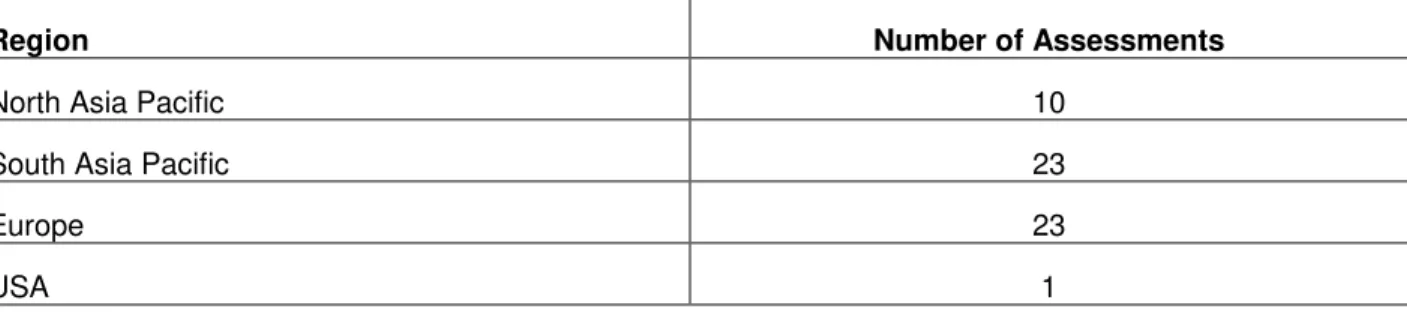
The Organizational Unit data included the SPICE region in which the OU was situated, the industrial sector in which the OU operated, and the number of IT staff in the OU.
Region Number of Assessments
North Asia Pacific 10
South Asia Pacific 23
Europe 23
USA 1
Table 5: Region where the 57 assessments were performed.4
At the time of closing data collection for Phase 2 of the trials, data from 70 assessments world-wide had been collected. As noted earlier, only 57 of these used Part 5 during the assessment. From Table 5 we see that the 57 assessments were spread across four of the five SPICE regions with the distribution shown. Note that the biggest contributors to Phase 2 of the trials were Europe and the South Asia Pacific regions.
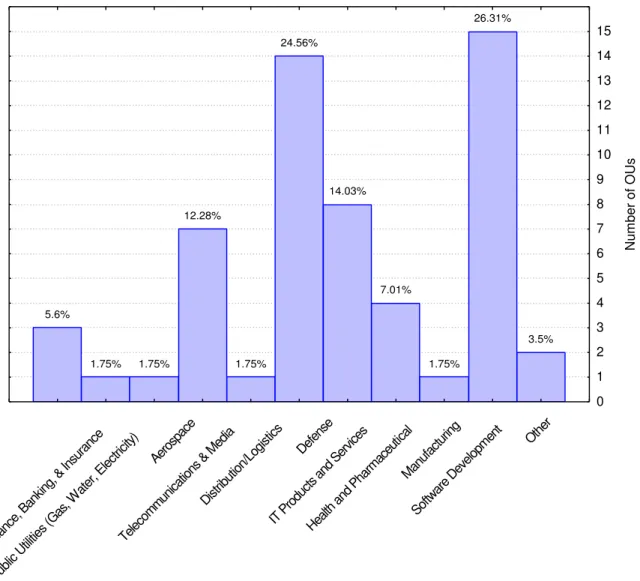
Figure 6 shows that 19 (approximately 33%) of the assessments were performed in organizations in the production of software or other IT products or services. With the next closest being organizations in the distribution and logistics business sector, and defense.
The data for the approximate number of IT staff in the OUs that were assessed are shown in Figure 7. This question asked for approximate numbers of staff, rounded to a suitable number ‘such as’ those shown.
4
One explanation for the low participation from the US during the SPICE Trials is that organizations that were interested in performing process assessment were using the SW-CMM. Therefore, they chose not to participate in evaluating another
As can be seen from this data, there was good variation in the sizes (both small and large) of the OUs that participated in the study. However, the same cannot be said for the business sectors. No organizations in the following primary business sectors participated in the trials (see Figure 6): business services, petroleum, automotive, public administration, consumer goods, retail, leisure and tourism, construction, and travel.
Nu m b e r o f O Us 5.6% 1.75% 1.75% 12.28% 1.75% 24.56% 14.03% 7.01% 1.75% 26.31% 3.5% 0 1 2 3 4 5 6 7 8 9 10 11 12 13 14 15 Fina nce, Ban king, & In sura nce Publ ic Ut ilities (Gas , W ater , Ele ctric ity) Aero spac e Telec omm unica tions & M edia Dist ribut ion/Lo gistics Defe nse IT P rodu cts an d Se rvice s Healt h an d Ph arm aceu tical Man ufac turin g Softw are Deve lopm ent Other
IT STAFF No o f A s s e s s m e n ts 0 1 2 3 4 5 6 7 8 9 10 11 12 13 14 15 10 25 50 75 100 150 200 250 500 1000
Figure 7: Approximate number of IT staff in participating OUs that have used Part 5. 4.1.2 Background and Experience of Assessors
Given that an assessor can participate in more than one assessment, the number of assessors is smaller than the total number of assessments. In total, 40 different lead assessors took part.
Employment Status No o f o b s 0 1 2 3 4 5 6 7 8 9 10 11 12
Exec Manag SenTech Tech Consult Other
The employment status of the assessors is summarized in Figure 8. As can be seen, most assessors consider themselves in management or senior technical positions in their organizations, with a sizeable number of the rest being consultants.
Assessment Method/Model No o f o b s 0 1 2 3 4 5 6 7 8 9 10 11 12 13 14 15 Phase 1 TickIT Trillium Bootstrap CMM PPA ISO 9001 Proprietary
Figure 9: Experience of assessors with assessment models and methods.
The experiences of these assessors in other assessment models and methods is summarized in Figure 9 (the total adds up to more than 40 because an assessor can have experience with more than one model/method). The mode is Phase 1, indicating that a good number of Phase 2 assessors also participated in Phase 1 of the trials. Fifteen of the assessors have experience with certification to ISO 9001, with the majority within the TickIT scheme. Other assessment models used include Bootstrap5, Trillium, the CMM, and Process Professional6.
Non-Outlier Max Non-Outlier Min 75% 25% Median Outliers Extremes Nu m b e r o f Y e a rs 0 5 10 15 20 25 30 35 Software Assessment
Figure 10: Software engineering and assessment experience of the (lead) assessors.
The variation in the number of years of software engineering experience and assessment experience of the assessors is shown in Figure 10. The median experience in software engineering is 12 years, with a maximum of 30 years experience. The median experience in assessments is 3 years, indicating a non-trivial background in assessments.
Figure 11 shows the variation in the number of assessments (in general) that were performed by the assessors, and the number of 15504-based assessments over the previous three years. The median number of assessments performed by the assessors is 6, and the median number of 15504-based assessments is 2. It will be noted that the lower bound is zero previous assessments and zero previous ISO/IEC 15504 assessments. However, this is due to one case. Exclusion of that observation would not have affected our conclusions.
Non-Outlier Max Non-Outlier Min 75% 25% Median Outliers Outliers 0 5 10 15 20 25 30 35 40 # Assessments # 15504 Ass.
Figure 11: The number of assessments where the assessors participated in the past three years.
In total, approximately 83% (33/40) of the assessors have received training on software process assessments in the past, approximately 93% (37/40) received training on 15504 (or a compatible model and method) in the past, and approximately 98% (39/40) received at least one of the above two types of training. Therefore, only one assessor did not receive any training. However, this assessor had more than 20 years of experience in the software industry, three years of assessment experience, and had performed two assessments in the past using a model and method not necessarily compatible with 15504.
4.2 Use of Part 5
Nearly all of the respondents used the assessment model as a source of indicators (95.5%). Approximately 82% of the respondents have used Part 5 intensively. Nearly half of them (45.61%) used the model to define additional indicators.
4.3 Table Format for Results
Our results are summarized in Table 6 to Table 11. The format of Table 6 to Table 11 is explained as follows:
• The first column is the question wording.
• The second column shows the percentage of supportive responses for the corresponding question.
• The third column shows the confidence intervals for supportive responses. For some questions, the confidence interval is omitted due to 100% supportive responses as seen at (1), (2), and (5) in Table 10.
• The proportion of “Does not apply” or “Did not use” are in the last column. It is possible that in some assessments a particular process was not within its scope, that the ratings went up to a certain level only, or that some indicators were not used. This is consistent with the proper use of ISO/IEC 15504.
4.4 Usefulness and Ease of Use
The results of assessors’ evaluations of the usefulness and ease of use of Part 5 are given in Table 6. The assessors did not find that using the assessment model results in too much detailed information (87.72%). In fact, their responses indicated that the level of detail was sufficient to guide subsequent software process improvement - clearly identify where the weaknesses that need to be addressed are, and provide direction for what actions are necessary for improvement, (82.46%). However, a minority expressed some concern that they could have produced accurate judgements with less detailed evidence, suggesting that the effort on collecting evidence as stipulated by the indicators may be reduced (71.93%, but not statistically different from 80%). This pattern of results implies that the detailed evidence collected using the exemplar model was not too much to handle, but could probably be reduced without affecting the accuracy of the ratings. This issue is particularly relevant as the size of the ISO/IEC 15504 document set has been a concern in the past [13], and the exemplar assessment model is the largest of the document set by far (having 38% of the total number of pages). In fact, the large size of the document set, and the exemplar model in particular, has been a recurring theme during the development of ISO/IEC 15504.
There was also some concern by the assessors with mapping the model’s processes to the processes in the OU that was assessed (70.18%). However, this was not statistically less than 80%.
The assessors did indicate a problem with the ratings of the process attributes on the process dimension (68.42% supportive, and statistically different from 80%). They had difficulty in rating achievement. The capability dimension has nine attributes. Results presented below in Sections 4.6 and 4.8 will shed some light on why, and which of these attributes presented the greatest rating difficulty.
Question Supportive response categories and their percentages Confidence interval • Strongly Disagree (17.54%) • Disagree (70.18%) (1) We were overwhelmed by evidence and
detail – there was too much for us to properly understand in a single assessment.
Total: 87.72%
[0.81, 0.95]
• Strongly Agree (17.79%) • Agree (56.14%) (2) We couldn't have made accurate
judgements with less detailed evidence.
Total: 71.93%
[0.62, 0.82]
• Strongly Agree (3.51%) • Agree (78.95%) (3) There is sufficient detail in the assessment
model to guide Process Improvement.
Total: 82.46%
[0.74, 0.91]
• Almost Always (50.88%)
• More Often Than not (19.30%)
(4) It is easy to map the Model's Processes to the Organizational Processes.
Total: 70.18%
[0.60, 0.80]
• Almost Always (36.84%)
• More Often Than Not (31.58%)
(5) It is easy to rate the achievement of the process attributes.
Total: 68.42%
[0.58, 0.79]
Table 6: Usefulness and ease of use7.
4.5 Meaningfulness of Rating and Aggregation Scheme
As shown in Table 7, nearly all assessors (98.25%) found that the rating at the process instance level was meaningful. Approximately 88% thought that aggregation of attribute ratings across process instances was meaningful. The scheme for calculating the capability level was found to be meaningful by a substantial majority, 82.46% of responding assessors.
The aggregation of capability levels into a profile was meaningful to 85.97% of the assessors. Finally, a smaller but still substantial 73.68% felt that the grouping of process categories was meaningful. Although this value is not statistically different from the 80% threshold.
Question Supportive response categories Confidence interval • Almost Always (68.42%)
• More Often Than Not (29.82%)
(1) It is meaningful to rate at the process instance level.
Total: 98.25%
[0.95, 1.00]
• Almost Always (54.39%)
• More Often Than Not (33.33%)
(2) It is meaningful to aggregate process attribute ratings of process instances.
Total: 87.72%
[0.81, 0.95]
• Almost Always (54.39%)
• More Often Than Not (28.07%)
(3) It is meaningful to show process instance ratings as a capability level.
Total: 82.46%
[0.74, 0.91]
• Almost Always (36.84%)
• More Often Than Not (49.12%)
(4) It is meaningful to aggregate capability levels of process instances.
Total: 85.97%
[0.78, 0.94]
• Almost Always (52.63%)
• More Often Than Not (21.05%)
(5) It is meaningful to group processes into process categories.
Total: 73.68%
[0.64, 0.83]
Table 7: Meaningfulness of rating and aggregation scheme8.
4.6 Usability of the Rating Scale
As seen in Table 8, nearly all assessors (98.25%) found that they and their assessment teams could understand the distinctions among the categories of the four point achievement scales. However, when asked a more specific question, some weaknesses in the scale appeared. The biggest difficulty seems to be making the distinction between the ‘L’ and the ‘P’ response categories (by 43.68%), followed by distinctions between the ‘F’ and ‘L’ response categories (by 24.56%), and lastly the ‘P’ and ‘N’ categories (by 21%), where the least difficulty was encountered. Only the ‘L’ and ‘P’ distinction was statistically different from the 80% threshold, suggesting that action should be taken to address this confusion on the scale points. The results suggest that ratings at the extremes of the scale are easier to make. It would be informative in future studies to determine the impact of confusion on the middle response categories to the final process capability levels assigned to process instances.
Question Supportive response categories Confidence interval • Extensive (43.86%) • Moderate (54.39%) (1) How good was your assessment team’s
understanding of the distinction among the rating scale (fully, largely, partially, and not
achieved)? Total: 98.25%
[0.95, 1.00]
• Sometimes (24.56%) • Rarely if Ever
(50.88%) (2) How difficult was it to understand the
boundary between Fully and Largely achieved? Total: 75.44% [0.66, 0.85] • Sometimes (47.37%) • Rarely if Ever (8.77%) (3) How difficult was it to understand the
boundary between Largely and Partially achieved? Total: 56.14% [0.45, 0.67] • Sometimes (31.58%) • Rarely if Ever (47.37%) (4) How difficult was it to understand the
boundary between Partially and Not achieved?
Total: 78.95%
[0.70, 0.88]
Note that the supportive percentages excluded those who did not use that process category.
Table 8: Usability of rating scale9.
4.7 Usefulness of Indicators
Table 9 is concerned with the indicators in Part 5. It can be seen that a sizeable majority did not have difficulty relating the base (96.43%) and management (87.27%) practices to the practices within the OU. In combination with the previous concerns with the mapping of the processes to the OU (Section 4.4), this indicates that the base practices are important to make such a mapping. Ease of relating the practices to the OU supports the conclusion of relevance of these documented practices to software organizations. Also, a large majority (86.28%) found the process capability indicators in general to be supportive of their rating judgements.
There exists moderate support for the use of work products (76.79%) and the work product characteristics (72.55%). In general, the assessors found them less helpful in making judgements and in understanding the processes than the higher level process capability indicators. However, neither of these values were statistically different from the 80% threshold.
Question Supportive response categories
Confidence interval “Did not use”
• Almost Always (66.67%) • More Often Than Not (19.61%) (1) Did the Work Products help
you understand the meaning of the processes in the Reference
Model? Total: 76.79%
[0.68, 0.86] 1.75%
• Almost Always (62.75%) • More Often Than Not (9.80%) (2) Did the Process Capability
Indicators support your judgement of the performance of the
process? Total: 86.28%
[0.78, 0.94] 10.53%
• Almost Always (71.07%) • More Often Than Not (25.36) (3) Did the Work Product
Characteristics help you review process work products to support your judgement of the
performance of the process?
Total: 72.55%
[0.62, 0.83] 10.53%
• Almost Always (71.07%) • More Often Than Not (25.36%) (4)It was easy to relate the Base
Practices to the practices of this
OU. Total: 96.43%
[0.92, 1.00] 1.75%
• Almost Always (55.27%) • More Often Than Not (32%) (5) It was easy to relate the
Management Practices to the
practices of this OU. Total: 87.27%
[0.80, 0.95] 3.51%
Note that the supportive percentages exclude those who did not use that process category.
Table 9: Usefulness of indicators10.
4.8 Understanding the Process and Capability Dimensions
Table 10 indicates that assessors felt confident in their understanding of the process categories well enough to make consistent and repeatable judgments about the practices followed in the OU. The only exception was the ORG process category where 8% felt that this was not the case. For the capability dimension (see Table 11) almost all of the assessors were confident about their understanding up until Level 3 attributes. However, the confidence level dropped for levels 4 and 5 in the perceived consistency and repeatability of their judgements. Even though at levels 4 and 5 the proportion supportive is not different from the threshold, it will be noticed that the confidence interval is quite large. This means that there is a large uncertainty in the estimate of the proportion of supportive responses.
Question11 Supportive response categories
and percentages
Confidence interval “Did Not Use”
• Extensive (50.42%) • Moderate (49.58%) (1) Customer-Supplier process category
Total: 100%
23.51%
• Extensive (59.43%) • Moderate (40.57%) (2) Engineering process category
Total: 100%
12.63%
• Extensive (66.94%) • Moderate (29.83%) (3) Management process category
Total: 96.77%
[0.91, 1.00] 12.98%
• Extensive (42.68%) • Moderate (49.32%) (4) Organization process category
Total: 92%
[0.84, 1.00] 21.05%
• Extensive (46.57%) • Moderate (53.43%) (5) Support process category
Total: 100%
13.33%
Note that the supportive percentages excluded those who did not use that process category.
Table 10: Understanding the process dimension12.
Question13 Supportive response categories and their percentages
Confidence interval “Does not apply” • Fully Confident (76.68%) • Very Confident (23.32%) (1) Process Performance Total: 100% ---• Fully Confident (63.38%) • Very Confident (36.62%) (2) Performance Management Total: 100% 6.68% • Fully Confident (44.73%) • Very Confident (50.75%) (3) Work Product management
Total: 95.48% [0.90, 1.00] 6.68% • Fully Confident (52.80%) • Very Confident (47.20%) (4) Process Definition Total: 100% 6.32% • Fully Confident (48.51%) • Very Confident (44.73%) (5) Process Resource Total: 93.24% [0.87, 0.99] 6.67% • Fully Confident (15.93%) • Very Confident (57.15%) (6) Process Measurement Total: 73.08% [0.60, 0.86] 36.14% • Fully Confident (15.29%) • Very Confident (59.03%) (7) Process Control Total: 74.32% [0.62, 0.86] 35.79% • Fully Confident (11.75%) • Very Confident (57.81%) (8) Process Change Total: 69.57% [0.56, 0.83] 34.39% • Fully Confident (10%) • Very Confident (62.77%) (9) Continuous Improvement Total: 72.77% [0.60, 0.86] 36.84%
Note that the supportive percentages exclude those who did not use that process category.
Table 11: Understanding the capability dimension14.
5 Summary and Conclusions
This study was an evaluation of the exemplar assessment model in ISO/IEC 15504. The objective was to determine how good the model is, whether it was useable, useful, whether the rating and aggregation scheme was meaningful, and whether there were general weaknesses in its architecture. The respondents were lead assessors who used the model in 57 assessments. The assessments were part of the SPICE Trials.
The results indicate that a majority of the assessors used Part 5 as a source of indicators for conducting their assessments (Section 4.2). In general, they found Part 5 useful and easy to use (Sections 4.4 and 4.7), rating scheme was found to be meaningful (Section 4.5), and the process dimension was found to
13
What is your level of confidence that you understand the meaning of assessed process attributes well enough to make consistent and repeatable judgements about the practices that were followed in this OU?
be easy to understand (Section 4.8). Furthermore, they were satisfied with the level of detail of the exemplar model, although a minority indicated that less detail in the collected evidence would not have harmed the accuracy of their judgements (Section 4.4).
For the capability dimension, the assessors expressed some concern with their ability to rate the process attributes. A closer examination showed that nearly all assessors were confident about their understanding up until level 3 attributes. However, for levels 4 and 5 confidence dropped in the perceived consistency and repeatability of their judgements (Section 4.8). The assessors also found that making the distinction on the 4-point ISO/IEC 15504 rating scale between the ‘L’ and ‘P’ responses was the most difficult, followed by distinction between ‘F’ and ‘L’ (Section 4.6). For the process dimension, the assessors noted that the base practices were useful for mapping the processes in the assessment model to the OU’s practices (Section 4.4).
One limitation of the current study is that we relied on only one research method, namely a questionnaire survey. Ideally, one would conduct multiple evaluative studies and then draw conclusions about the strengths and weaknesses of the assessment model. However, it should be recognized that the SPICE Trials are an on-going program of research that employs multiple methods [3]. This is a form of triangulation whereby we "investigate a phenomenon using a combination of empirical research methods. The intention is that a combination of techniques complement each other” [31]. For the evaluation of the assessment model, we have followed an evolutionary multi-method strategy, whereby we start with exploratory studies whose intention is to generate hypotheses. The most important ones are subsequently tested using more focused studies. These follow-on studies would use methods more suited to theory confirmation, such as field experiments. This is the strategy used, for example, in a recent investigation into object-oriented constructs and their impact on maintainability [31].
The current evaluation identified a number of issues that will be subsequently investigated using more focused studies:
• Evaluate the impact of confusion between ‘L’ and ‘P’ ratings on the capability level, since our study found that assessors had the greatest difficulty in making the distinction between these two categories.
• Evaluate the reliability of ratings at higher levels of capability, since our results showed that assessors tend to have more difficulty making ratings at levels 4 and 5.
Another caution when interpreting the results of this study is that the assessors who took part in the trials are more likely to be representative of the early adopters of ISO/IEC 15504 than of all potential users. One can argue that the early adopters are expected to have more favorable attitudes towards ISO/IEC 15504 and to have a vested interest in its success. This means that our results are likely to be more
identified during our study are likely to be much serious than our results suggest. This would strengthen the case for performing further focused studies to investigate them.
However, through our interactions with participants in the SPICE Trials, we noted that they tended to be quite critical of the model. This is to ensure that it is of the highest quality, and therefore they highlight its flaws more often than not. Consequently, it is premature to claim that participants will systematically have a positive bias.
For the users of the assessment model, we would suggest that they exercise caution when rating at higher capability levels since there is some uncertainty about how reliably such ratings can be made. Furthermore, we would suggest performing a sensitivity analysis on the final capability ratings from an assessment to gauge the impact of confusion between the ‘L’ and ‘P’ ratings. This would give the users some indication of how much confidence to place in the results of the assessment. The developers of the standard should also consider the inclusion of sensitivity analysis as a regular part of an assessment until further studies of high capability processes lead to refinements of the capability scale at these higher levels.
Our results suggest that further improvements can be made to the architecture of the exemplar assessment model in ISO/IEC 15504. However, some of the comments apply equally well to the reference model in ISO/IEC 15504 (namely all those related to the rating scheme). Therefore, the feedback from this study is not only localized to the exemplar model, but has wider implications on the normative architecture of the emerging standard.
6 Appendix: Multiple Imputation Method
In this appendix we describe the approach that we used for imputing missing values on the performance variable, and also how we operationalize it in our specific study.
6.1 Notation
We first present some notation to facilitate explaining the imputation method. Let the raw data matrix have
i
rows (indexing the cases) andj
columns (indexing the variables), wherei
=
1
K
n
andq
j
=
1
K
. Some of the cells in this matrix may be unobserved (i.e., missing values). We assume thatthere is only one variable of interest for imputation, and let
y
i denote its value for thei
thcase. Let
)
,
(
Y
misY
obsY
=
, whereY
mis denotes the missing values andY
obs denotes the observed values on that variable. Furthermore, letX
be a scalar or vector of covariates that are fully observed for everyi
. These may be background variables, which in our case were the size of an organization in IT staff and whether the organisation was ISO 9001 registered.Let the parameter of interest in the study be denoted by
Q
. We assume thatQ
is scalar since this is congruent with our context. For example, letQ
be a proportion estimate. We wish to estimateQ
)
with associated variance
U
from our sample.6.2 Ignorable Models
Models underlying the method of imputation can be classified as assuming that the reasons for the missing data are either ignorable or nonignorable. Rubin [23] defines this formally. However, here it will suffice to convey the concepts, following [24].
Ignorable reasons for the missing data imply that a nonrespondent is only randomly different from a respondent with the same value of
X
. Nonignorable reasons for missing data imply that, even though respondents and nonrespondents have the same value ofX
, there will be a systematic difference in their values ofY
. An example of a nonignorable response mechanism in the context of process assessments that use a model such as that of ISO/IEC 15504 is when organizations assess a particular process because it is perceived to be weak and important for their business. In such a case, processes for which there are capability ratings are likely to have lower capability than other processes that are not assessed.In general, most imputation methods assume ignorable nonresponse [28] (although, it is possible to perform, for example, multiple imputation, with a nonignorable nonresponse mechanism). In the analysis presented in this report there is no a priori reason to suspect that respondents and nonrespondents will differ systematically in the values of the variable of interest, and therefore we assume ignorable nonresponse.
6.3 Overall Multiple Imputation Process
The overall multiple imputation process is shown in Figure 12. Each of these tasks is described below. It should be noted that the description of these tasks is done from a Bayesian perspective.
Modeling
Choose model for the data
Estimation
Calculate posterior distribution of
chosen model parameters - pos( )
ϑ
Multiple Imputation:
For k=1 to M
Imputation
Draw from the posterior distribution pos(
ϑ
)and create a Y vector of values to impute
Analysis
Analyse each of the M complete data
sets using complete-data methods
Combination
Combine the M analyses into one
set of analysis results
Figure 12: Schematic showing the tasks involved in multiple imputation.
6.4 Modelling Task
The objective of the modeling task is to specify a model
f
YX(
Y
iX
i,
θ
Y X)
using the observed data only whereθ
YX are the model parameters. For example, consider the situation where we define an ordinary least squares regression model that is constructed using the observed values ofY
and the predictor variables are the covariatesX
, thenθ
Y X=
(
β
,
σ
2)
are the vector of the regression parameters and the variance of the error term respectively. This model is used to impute the missing values. In our case we used an implicit model that is based on the hot-deck method. This is described further below.6.5 Estimation Task
We define the posterior distribution of
θ
asPr
(
θ
X ,
Y
obs)
.15 However, the only function ofθ
that is needed for the imputation task isX Y
θ
. Therefore, during the estimation task, we draw repeated values ofθ
YX from its posterior distributionPr
(
θ
YXX ,
Y
obs)
. Let’s call a drawn valueθ
Y*X .6.6 Imputation Task
The posterior predictive distribution of the missing data given the observed data is defined by the following result:
(
Y
misX
,
Y
obs)
=
∫
Pr
(
Y
misX
,
Y
obs,
θ
) (
Pr
θ
X
,
Y
obs)
d
θ
Pr
Eqn. 1
We therefore draw a value of
Y
mis from its conditional posterior distribution givenθ
Y*X. For example, we can drawθ
*=
(
β
*,
σ
*2)
X
Y and compute the missing
y
i from(
)
*
,
YXi i
x
y
f
θ
. This is the value that is imputed. This process is repeatedM
times.6.7 Analysis Task
For each of the
M
complete data sets, we can calculate the value ofQ
. This provides us with the complete-data posterior distribution ofQ
:Pr
(
Q
X
,
Y
obs,
Y
mis)
.6.8 Combination Task
The basic result provided by Rubin [23] is:
(
Q
X
,
Y
obs)
=
∫
Pr
(
Q
X
,
Y
obs,
Y
mis) (
Pr
Y
misX
,
Y
obs)
dY
misPr
Eqn. 2
This result states that the actual posterior distribution of
Q
is equal to the average over the repeated imputations. Based on this result, a number of inferential procedures are defined.The repeated imputation estimate of
Q
is:∑
=
M
Q
Q
m)
Eqn. 3which is the mean value across the
M
analyses that are performed.The variability associated with this estimate has two components. First there is the within-imputation variance: