Publisher’s version / Version de l'éditeur:
Vous avez des questions? Nous pouvons vous aider. Pour communiquer directement avec un auteur, consultez la première page de la revue dans laquelle son article a été publié afin de trouver ses coordonnées. Si vous n’arrivez pas à les repérer, communiquez avec nous à PublicationsArchive-ArchivesPublications@nrc-cnrc.gc.ca. Questions? Contact the NRC Publications Archive team at
PublicationsArchive-ArchivesPublications@nrc-cnrc.gc.ca. If you wish to email the authors directly, please see the first page of the publication for their contact information.
https://publications-cnrc.canada.ca/fra/droits
L’accès à ce site Web et l’utilisation de son contenu sont assujettis aux conditions présentées dans le site LISEZ CES CONDITIONS ATTENTIVEMENT AVANT D’UTILISER CE SITE WEB.
Proceedings of the First International Conference on Open Source Systems,
2005
READ THESE TERMS AND CONDITIONS CAREFULLY BEFORE USING THIS WEBSITE. https://nrc-publications.canada.ca/eng/copyright
NRC Publications Archive Record / Notice des Archives des publications du CNRC :
https://nrc-publications.canada.ca/eng/view/object/?id=f7ba15f6-166f-48cc-8743-93f09a179fb2
https://publications-cnrc.canada.ca/fra/voir/objet/?id=f7ba15f6-166f-48cc-8743-93f09a179fb2
NRC Publications Archive
Archives des publications du CNRC
This publication could be one of several versions: author’s original, accepted manuscript or the publisher’s version. / La version de cette publication peut être l’une des suivantes : la version prépublication de l’auteur, la version acceptée du manuscrit ou la version de l’éditeur.
Access and use of this website and the material on it are subject to the Terms and Conditions set forth at
Understanding the Open-Source Software Development Process: A
Case Study with CVSChecker
National Research Council Canada Institute for Information Technology Conseil national de recherches Canada Institut de technologie de l'information
Understanding the Open-Source Software
Development Process: A Case Study with
CVSChecker *
Liu, Y., and Erdogmus, H.
July 2005
* published in the Proceedings of the First International Conference on Open Source Systems. Genoa, Italy. July 11-15, 2005. NRC 47453.
Copyright 2005 by
National Research Council of Canada
Permission is granted to quote short excerpts and to reproduce figures and tables from this report, provided that the source of such material is fully acknowledged.
Understanding the Open-Source Software Development Process:
a Case Study with CVSChecker
Ying Liu, Eleni Stroulia
Hakan Erdogmus
University of Alberta National Research Council
Edmonton, Canada Ottawa, Canada
{yingl, stroulia}@cs.ualberta.ca Hakan.Erdogmus@nrc-cnrc.gc.ca
Abstract – The open-source process model is emerging as a new lightweight paradigm for software development and has already produced several successful products. This process is fundamentally different from more traditional analysis- and design-driven processes, which raises a set of interesting research questions: what activities are carried out in open-source projects and by whom? Are there typical or exceptional patterns? CVSChecker is a tool designed to analyze the performance of individual developers and the work-distribution patterns of teams based on historical source-code repository data. In this paper, we report on a case study conducted using CVSChecker to examine a small open-source project. We discuss the insights that the CVSChecker analysis produced regarding this project and compare them to results from previous case studies performed with senior student teams.
I. INTRODUCTION AND MOTIVATION A team is a group of people who share a common objective and need to work together in order to achieve it. It is a primary means for developing products in complex situations. Good teamwork is an essential factor for effective team performance [20]. We have developed a tool, CVSChecker, for analyzing the development process of software projects based on the history recorded by source-management systems. CVSChecker is developed as a plugin for the Eclipse IDE [21], and currently assumes the Concurrent Version System (CVS) as the underlying source-code repository. CVSChecker examines the project-development process from several perspectives, including team collaboration, individual-developer role and source-artifact evolution.
Initial case studies with CVSChecker examined the development process of senior undergraduate student teams and identified several patterns. Some of these patterns can be thought of as indicative of good teamwork and others as symptoms of problematic performance. However, these case studies were conducted in a controlled environment, in the sense that the student teams followed a process largely orchestrated by the instructor. Software teams vary greatly – from small student teams in an academic environment, to teams of various sizes in the software industry, to the expanding open-source communities. More recently, our interest has expanded to the open-source context, focusing on the following questions:
1) Can CVSChecker also be applied to Open-Source Projects (OSPs) to reveal developer collaboration and file evolution patterns?
2) Can one easily and intuitively understand the development trajectory of an OSP only with the help of CVSChecker?
3) Can CVSChecker detect healthy and problematic patterns in OSPs?
4) How similar (or different) are role-specific behaviors and team-collaboration patterns in academic and
OSP teams?
5) What are the characteristic differences, among different project-development processes (e.g. inexperienced student teams in academic environment following a design-driven process and teams in self-regulating open-source communities)? In the case study reported in this paper, we examine some of these questions.
The open-source model is an increasingly popular paradigm for software development and has already produced several successful products. The influential “Cathedral and Bazaar” paper [17] discusses the open-source development process as an almost silver-bullet solution: “the open source movement consists of ideal cooperative people, where conflicts are few and can be resolved within a community.” In this case study, we try to gain some insights on how this model works in practice: to that end, we apply the CVSChecker tool to a typical open-source project towards a better understanding of the nature of teamwork and collaboration in such projects. As an initial step, we are interested in the similarities and differences between this style of development and the more controlled styles observed in controlled academic settings.
The rest of this paper is organized as follows. Section 2 introduces the related work. Section 3 presents CVSChecker with its underlying methodology. Section 4 reviews the results of the previous case studies on student projects. Section 5 elaborates the case study on the chosen open-source project with CVSChecker visualizations. Section 6 gives the summary and future work.
II. RELATED WORK
Several tools and projects have been aimed at extracting interesting information from the data captured in a CVS repository. On the one hand, tools such as CVSMonitor [8], CodeStriker [10], Hipikat [4] have been designed to support goal-oriented navigation of the source code. On the other, softChange [6], Cvsplot [11], Bloof [9], CVSAnalY [18], Beagle [19], ROSE [23], Evolutionary Code Extractor [7], IVA [3], JDEvAn [22] and others [5] have been designed to analyze the evolution history of the source code. These tools have been applied to a variety of software projects to study (a) the volatility (or entropy) of the project as an indication of the overall amount of changes occurring in its modules [3, 7], (b) the various distinct phases of the software evolution history [6, 22], (c) the implicit coupling among software modules that co-evolve [5, 22], and (d) internal code restructurings that may have occurred [19, 22].
With the exception of JDEvAn, which analyzes design entities, almost all of these works use as their primary input the file-modification information of CVS. Although each of the above projects targets its analysis at different levels of granularity, from coarse-grained entities (system, module,
class, and file) to fine-grained entities (function, method, attribute), they mostly start by grouping the CVS change deltas into transactions (or modification requests) assumed to represent all related modifications in response to changes in functionality or bug fixes. An important distinction of our work with CVSChecker is that it examines instead the different CVS operation trails recorded in the repository. We argue that this more elemental information is important because the same operation executed under different conditions will generate different trails. For example, there are four possible consequences for the update operation:
1) C: a collision was detected as a result of more than one developer modifying the same code area in the same file revision;
2) G: a merge was necessary and it succeeded (this happens when multiple developers change different code areas of the same file revision without causing conflicts);
3) U: a working file was copied from the repository;
4) W: the working copy of a file was deleted because it has already been removed from the repository.
Through tracking these CVS operations, CVSChecker can help users to better understand the development history. Another unique feature of CVSChecker is its developer-perspective analysis: in addition to understanding the modification history of software entities, CVSChecker aims at understanding the contributions of individual developers, as well as the nature of the distribution of responsibilities within the development team.
III. METHODOLOGY
CVSChecker is implemented as a plugin to the Eclipse IDE and is one of the components of the JReflex [12] system. The process of analyzing a project with CVSChecker involves four steps, described in detail below.
A. Collection of Historical Data
CVSChecker examines the development-process trails captured by the CVS repository of a project to be analyzed. This is an information-rich data source. Not only does it contain a sequence of revisions for each software module, but also it records information regarding the interaction of each developer with the source code artifacts. CVSChecker has a suite of parsers that extract this information from the source code repository and store it in a relational database that can be easily queried.
B. Visualization
CVSChecker produces the following four types of visualizations of the collected data for a project:
A. Temporal distribution of CVS activity, for each team member
B. Distribution of CVS operation types, for each team member
C. Distribution of CVS operation types, for each file D. Added and deleted Lines of Code (LOC) by each
member, on each file
The first type of visualization (shown in Fig. 1) helps users to grasp the development trends and notice some special phases. The second type of visualization (Fig. 2) shows the contribution of the team members over different
CVS operation types. The third type of visualization (Fig. 5) displays what kinds of operations were committed on each file and helps detect files with atypical histories. Finally, the last type of visualization (Fig. 6) provides relevant information for each file about who modified it and what the impact of each developer was on that file.
These visualizations can be produced for the whole project history, or incrementally to provide a sequence of views corresponding to smaller periods (such as between releases, or on a weekly basis.)
From within Eclipse, users can explore these visualizations through a special CVSChecker perspective. They can focus on particular CVS operations, files, or team members over specific periods of time. An up-to-date set of these visualizations reflecting the complete project history is maintained in the database. Developers also can access them through a wiki-based collaborative environment, WikiWikiDev [12], to get an up-to-date view of their progress.
E. Data Analysis and Knowledge Extraction
In addition to producing visualizations, CVSChecker also includes two different mechanisms for interpreting the collected data. For bottom-up hypothesis generation and knowledge extraction from the data, we have adopted Apriori [1], an association-rule mining algorithm for discovering interesting patterns of how team members use and modify their software assets. As far the data related to an individual team member are concerned, we are interested in patterns that may exist in the types and frequency of CVS operations a developer may perform, or in the software assets that may be accessed and modified. For top-down hypothesis-driven analysis, we have developed a set of queries that correspond to our intuitions about relevant behaviors of teams and individuals. Section 4 summarizes the patterns mined from the initial case studies on student projects as a benchmark for the open-source case study discussed here, while Section 5 discusses how these patterns relate to those discovered in the open-source case study.
In the long run, our intent is to provide context-specific guidance to team managers and developers, based on the actual patterns of behaviors that the team members exhibit as individuals and as a whole. Data mining uncovers correlations in the collected data that may or may not correspond to interesting development behaviors; we would have to assess these correlations in terms of how useful they are as indicators of effective or problematic performance. At the same time, in the academic setting we formulate our own intuitions as educators about what types of teams succeed (and what types of teams fail) as heuristic patterns and validate than empirically. With this approach, we plan to collect a suite of patterns that can be used as “sensors” of when to intervene in a team and how.
F. Reporting
Reports are an alternative means of presenting information, complementary to visualization. CVSChecker produces two types of reports: consultation and summarization reports. Consultation reports include the detailed data on the basis of which the visualizations are generated. These reports are meant as an auxiliary medium for representing the visualization data, enabling the users interpreting the diagrams to access the details behind any
interesting information they may glean from the diagrams. Summarization reports contain selected data of interest and the results of the analysis phase.
IV. ANALYZING SMALL STUDENT TEAMS WITH CVSCHECKER
Our initial case studies with CVSChecker analyzed several undergraduate teams with similar team sizes, project lengths and backgrounds in the same academic environment, i.e., a single-term senior software-engineering course. We examined the projects developed by more than 15 four-member1 student teams, across several sessions of
the same third-year software-engineering course [13]. These projects spanned about 2 months, with 3 or 4 distinct intermediate deliverables. During each term, all team projects involved the same project requirements and used the same development environments. Moreover, the teams were homogeneous in terms of the members’ backgrounds and professional experience (they were mostly junior students who took the same set of prerequisite courses). Projects in different terms were of similar difficulty.
The relative uniformity of the project setting reduced the confounding factors that may skew results because of individual variances, and enhanced our confidence in the analysis results. We categorized the results into two types of patterns: factual patterns and red flags. A factual pattern expresses some characteristic of the development history of no obvious negative or positive implication. A red flag pattern captures a problematic situation whose persistence may warrant a preventive action. They should ideally be detected early and avoided. We summarize some of these interesting patterns from the student case studies:
Factual patterns:
• Leaders vs. component developers. The two most common roles in these case studies were team leader (a core contributor who is de facto in charge of the overall project and steers the development effort for a given period) and component developer (an exclusive contributor to a specific file or module for a given period).
• Leaders are architects. Leaders tended to add a lot of new files in the beginning of the project. Consequently, they had the most influence over the architecture and evolution of the system and the division of labor.
• Component developers work on existing artifacts. Unlike leaders, component developers tended to add few files or no files at all.
• Leaders contribute heavily. Leaders usually also performed a large number of CVS operations, modifications in particular, that exceeded by far the number of operations performed by their teammates. • Leaders contribute steadily. Leader had a better working habit. They started contributing early in the project and had relatively even work curves. • Component developers have limited focus. Not
surprisingly, most of the CVS operations of component developers were modifications to a small set of files, with relatively few collisions with their teammates.
Red Flags:
1
There were a few variations to the team size: 1 or 2 teams had 3 or 5 members.
• Underuse of CVS. Most members used CVS very little in the early phases, and they exhibited an irregular workload curve – long idle times interleaved with sudden peaks before deliverable deadlines. This pattern is problematic because we found that it often is either a symptom of under-contribution or a source of future collisions. • Multi-way collisions. Collisions usually involved
more than two members. This pattern may be indicative of high coupling, poor modularization, or poor division of labor.
• Watch for merges. Most files with collisions had earlier successful merges. This pattern seems to suggest that when successful merges of divergent file revisions are noticed, the team should consider redesigning their responsibilities around the affected files to avoid future collisions.
• Miscellaneous. Several other less pervasive problematic patterns were also identified, including excessively large files, frequent collisions/merges, and repeated alternating file additions and removals. V. ANALYZING OPEN-SOURCE DEVELOPMENT:
A CASE STUDY
Open-source software is developed according to the “bazaar” model of distributed software development, as characterized by Eric Raymond [17], where the source code is allowed to be studied, modified and redistributed. It enjoys considerable patronage as the chosen development model for a number of well-known and widely-adopted projects including the GNU/Linux kernel, Apache and Mozilla [15]. Beyond these long-term, large-scale projects, the open-source process model is adopted by hundreds of smaller, more short-term projects. These projects, created and managed by several volunteers with limited experience, are comparable to the student projects that have been analyzed. Therefore we wanted to investigate to what extent the team behavior was similar or different. Thus, the new case study was designed with two goals in mind:
1) to gauge whether the CVSChecker tool is useful for analyzing open source projects and whether its functionality is sufficient to reveal interesting information in the behavior of teams following this type of process; and
2) to investigate whether the team-collaboration and role-specific patterns identified in the initial case studies are applicable, and identify new patterns that are possibly unique to open-source projects.
To achieve these goals, we identified several open-source projects comparable to the student projects we had studied. Putnam et al. [16] claim that small size is the key to a successful project. We have been following this adage in organizing the student teams, and for our first OSP case study, looked for a similarly small open-source project with no more than nine members (according to Belbin’s [2] “9 team roles” theory). We also decided to constraint ourselves to Java-based projects to be consistent with the earlier student projects. Based on these considerations, we selected an active project, which we will refer to as ProjectA in the rest of the paper, from www.sourceforge.net. ProjectA is a command-line Java application that generates HTML reports from CVS repository. This project has six
developers and its first registration date in www.sourceforge.com is 2002-07-10. We checked out a copy of the project’s CVS repository on 2004-12-24. Coincidentally, it appears that all the project developers were volunteering university students.
The “CVS log” and “CVS history” data of ProjectA was extracted and stored in the CVSChecker database under the same schema as the one used for the previous student projects. There were two sub-modules under the root node, which we refer to as module1 and module2. All the six team members contributed to the development of module1 while member1 was the only developer for module2. Because we focus on team collaboration and module2only includes images or html files instead of program files, we focus on module1 in this paper.
The student case studies lasted for approximately two months, with designing and coding as the two main activities; the requirements were fairly well defined by the instructor. The project deadline could be considered as equivalent to the first product release date with stable, complete end-to-and functionality. Most OSPs usually have an initial release followed by long maintenance periods with
several new releases. It would have been impractical to constraint the OSP length to be similar to the student projects’ length. Therefore, we focused on the initial development phases leading to the first couple of releases. The implication is that we had to figure out when the initial development phase ended and when the maintenance phase began in the OSP. This information can usually be retrieved from the supplementary project records, but it is not always accurately recorded. Fortunately, locating the various milestones, whether or not they coincide with explicit releases or documented in project records, based on CVS data is an important function of CVSChecker.
A. Inferring Development Milestones
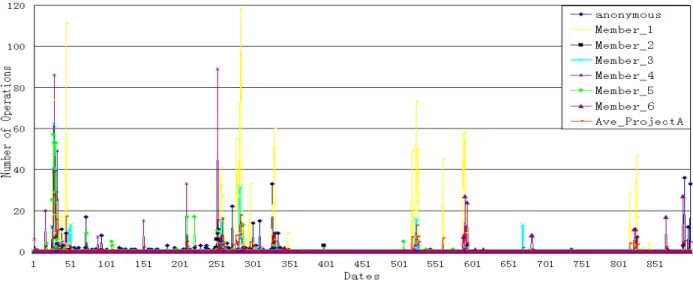
CVSChecker generated visualizations for module1 at the four levels mentioned in Section 2. Fig. 1 shows the temporal distribution of CVS operations for each member while Fig. 2 shows the distribution of CVS operation types for each member for this module.
Fig. 1. ProjectA: temporal distribution of CVS activity from 2002-07-11 to 2004-12-24 for each member
Fig. 2. ProjectA: distribution of operation types from 2002-7-11 to 2004-12-24 for each member
From Fig. 1, we can make two interesting observations. a) There are several peaks near days 48, 260, 520,
600, 830, etc. These dates should be significant
and they should be examined more closely. b) Member1 was very active throughout, especially
day 260, but did almost no work later. Anonymous developers had a long idle phase after day 350, and resumed recently. Member6 and member2 almost did not have any traces before day 260.
From Fig. 2, we observed the following:
a) The total number of CVS operations of member1 was far greater than that of his teammates; similarly the number of his addition and modification operations was larger than those of his teammates.
b) Anonymous developers performed only three operation types: O (checkout), P (patch), W (removal of local file copy because file has been deleted from repository).
c) Member2 almost had no CVS trail at all.
It seems, therefore, that member1 and member4 could be the two core developers and day 260 could be an important milestone. According to the project history, the release date of version v0.1.3 is 2003-03-26. Since we want to focus on the initial development phase, we first separate the history into two main phases by this release date: Phase 1 (from 2002-07-11 to 2003-03-26) and Phase 2 (from 2003-03-26 to 2004-12-24).
B. Focusing on the Initial Development
Zooming in on Phase 1, we made the following observations:
a) Member1 still had the most CVS operations in this phase. More specifically, there were two busy periods for member member1. The first was from
day 25 to day 50. Remarkably around date 48, there was a significant peak. The second peak covers the days just before the release of v0.1.3. b) Member4 had an almost equally large number of
operations according to Fig. 2. There were also two active periods for member4: one was around day 30 and the other was around the days approaching the release of v0.1.3.
c) There was a long, relatively quiet period from around day 75 to day 200. Only member4, member5 and anonymous developers had a few sporadic actions during that time.
d) During Phase 1, no P (Patch) operations were performed, which is not surprising since this is the initial release of the system and outside contributors did not have the opportunity to participate to the project yet.
e) Most successful merges and collisions operations in this project were caused by member5, and almost all of them happened in Phase 1. This may indicate that the responsibilities of this developer are not clear since he appears to be interfering with the development of other members.
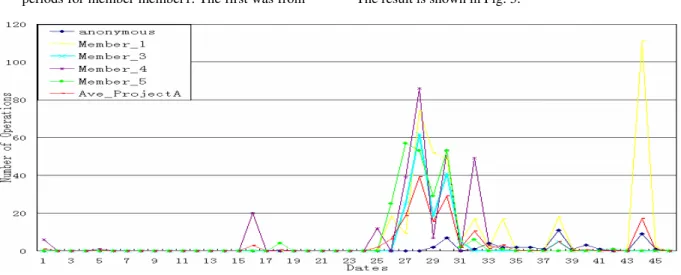
The blown-up CVSChecker charts for Phase 1 (not shown) indicated that just before day 50 could coincide with another project milestone. We consulted the project records and figured out that day 46 (August 25 2002) was the delivery date of v0.1.2.b. In order to see the details before this release, we zoomed in on a smaller period. The result is shown in Fig. 3.
Fig. 3. ProjectA: temporal distribution of CVS activity for each team member from 2002-07-11 to 2002-08-25
From the distribution of operations in this sub-period (not shown), we realized that the contributions of each member was not remarkably different than they were in the enclosing period, Phase 1. However, Fig. 3 quickly revealed that the days between day 25 and 30 constituted another peak period in development activity. Moreover, two core developers (member1 and member4) had an overlap around this period. Could it be that the former was handing over the project leadership to the latter?
Records showed that on day 32 (August 11 2002), a new version, v0.1.1.a, was released. Because this date coincided with the only peak before this release date, we identified the period from 2002-07-11 to 2002-08-11 as the initial development phase for comparison with the
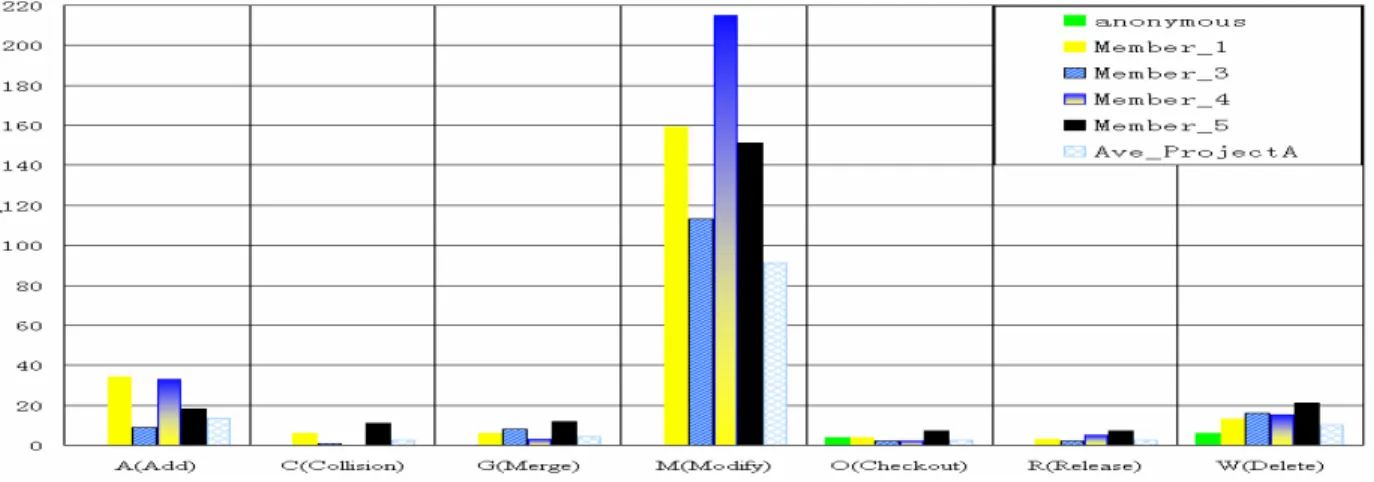
previous student projects. Afterwards, most likely the maintenance and updates started. Therefore, we decided that the team collaboration and individual performance patterns of this new period can be compared to the student case studies, which did not involve maintenance and updates. Figs. 4-6 drill down again to illustrate what really happened in this new period. Fig. 4 shows the operation type distribution for each member while Figs. 5 and 6 show file views for this period. In Fig. 5, each bar indicates a file, with differently colored sections whose lengths are proportional to the number of operations for a specific category of operations. Files removed are plotted below the x-axis for easy identification. In Fig. 6, the differently colored sections of the bars represent team
members and the heights of the bars modified lines of code (LOC). Added LOC are plotted above the horizontal while deleted LOC are plotted below it.
While comparing Fig. 4 with Fig. 2 confirmed our
hypothesis of a handover of leadership, Figs. 5 and 6 also revealed several other patterns that were identified in the academic case studies. We discuss these next.
Fig. 4. ProjectA: distribution of operation types for each member from 2002-07-11 to 2002-08-11
Fig. 5. ProjectA: distribution of operations by type, on each file from 2002-7-11 to 2002-08-11
C. Patterns Extracted
Applying the heuristics developed during the analysis of the student projects, CVSChecker extracted the following patterns for ProjectA.
Factual Patterns:
• Leaders vs. component developers. Member4 and member1 s are team leaders. Comparing the initial development phase with the visualizations from later phases, it appears that member4 was the team leader in the initial development phase, but did not manage the project after v.0.1.2.a was released. After this release, member1 took over the lead role. This result generated by the CVSChecker was confirmed by project records. As for component developers, except for member1, nobody else independently took charge of individual files. This is different from what we have observed in the academic case studies, where multiple team members almost exclusively owned specific files. • Leaders contribute heavily. Leaders performed a large
number of CVS operations (especially modifications) that exceeded that of their teammates in their respective phases. This pattern was also pervasive in the academic case studies.
• Leaders are architects. Similar to those in student projects, the leaders in this project added a lot of new files and therefore had the largest impact on the overall structure and evolution of the project.
Red Flags:
• Multi-way collisions. As in the student case studies, more than two members were involved in collisions. 11 files were modified by at least three members. The numbers of collisions and merges on these files were higher than that of other files. This pattern is apparent in Fig. 6.
• Watch for merges. We did not observe this pattern as is in the open-source case study because we think the project had a small code base before it was moved to sourceforge. However, the sourceforge initial development phase was still responsible for the files that were overall subjected to the highest number of collisions and merges. These files were not removed later, and continued to cause collisions in the later phases. This variation on the original pattern is visible from Fig. 5.
We did not observe the pattern “underuse of CVS” in ProjectA . In addition, since there was only one component developer and only for a limited period, patterns relating to component developers were not present. The pattern “leaders contribute steadily” was not detected either, and perhaps this pattern is unique to the course projects in an academic setting and is not typical of OSPs. However, Michlmayr [14], argues that steady contribution is a factor in an OSP’s success, and perhaps the absence of this pattern constitute an early warning sign.
There appears to be significant overlap between the behavior of the open-source team and that of the student teams studied earlier. Given that students also constitute the main contributors in ProjectA, it may be that the contributors’ background is a more decisive characteristic
of development style than the process model adopted by the team.
An important differentiator between the academic case studies and the OSP case study is that contribution was mandatory in the former while it was voluntary in the latter. The absence of certain patterns in the OSP case study could perhaps be explained by this differentiator.
One pattern that was observed in the OSP project, but not in the academic case studies was “inactive developer”, where members drop in and out of the project in different phases. Whether the tool can extract other, more interesting patterns unique to OSPs is yet to be investigated.
VI. SUMMARY AND CONCLUSIONS
The open-source software development process is being increasingly adopted by teams of various sizes and skills for projects of variable durations and complexity. Although compelling success stories exist, it is still relatively unknown how the open-source lifecycle model applies to projects of various types. The CVSChecker tool is a component of the JRefleX system [21]. It analyzes the nature of the developers’ roles by collecting, visualizing, and analyzing historical project data from a CVS repository. In this paper, we discussed a case study using CVSChecker on an open-source project (OSP). We selected a small-scale project in order to compare it with previous case studies that were conducted with university student teams undertaking projects of similar complexity and duration. Using CVSChecker, we were able to identify the project milestones, the core developers, and their main roles. We discovered that a number of patterns identified in the student case studies also occurred here.
Based on this OSP case study, we believe that CVSChecker could be useful for analyzing small OSPs although it was initially developed as a pedagogical aid. First the tool enabled us to identify evolving contributor roles (leaders and component developers) exclusively from the contributors’ CVS activities. That OSPs exhibit a non-uniform, centralized contribution pattern has been long hypothesized, and documented for well known projects [15]. This analysis suggests that similar patterns can also be inferred for smaller projects using only information about source code repository actions. Second, the tool enabled us to identify significant dates along the project life cycle, suggesting that it is possible to infer project milestones from high-level data even in the absence of accurate project records. Next, recursively zooming in shorter periods of interest and applying the heuristics developed in the context of the academic case studies, we were able to recognize a number of similar patterns in the selected OSP.
With a coherent view of the team collaboration and the evolution of the project’s software assets, we expect that technical leads and educators will be able to better steer their projects and provide relevant, timely, and informative feedback. Furthermore, we believe that teams who are aware of their own collaborative process, reflect upon their progress, and make adjustments as needed are more likely to make the right decisions when new challenges arise. In the open-source context, the identification of patterns of volunteer contributions could enable preventive measures that maintain the project’s health [14].
In the future, we plan to conduct further case studies of sets of OSPs with similar characteristics to evaluate the validity of these results and identify new patterns. We would also like to analyze the data from maintenance phases to see whether different phases exhibit different patterns. Additional visualizations are currently being developed to display process-related information from several new perspectives.
VII. ACKNOWLEDGMENT
This work has been conducted in part while the first author was at the Institute for Information Technology, National Research Council Canada, as a participant in the
SEG Graduate Student Workshop. The authors wish to acknowledge the Software Engineering Group of NRC–IIT for their support.
VIII. REFERENCES
[l] R. Agrawal and T. Imielinski and A. N. Swami, “Mining Association Rules between Sets of Items in Large Databases,” in Proceedings of the 1993 ACM SIGMOD International Conference on Management of Data, Washington, DC, May 26-28, 1993
[2] M. Belbin, Management Teams -- Why they succeed or fail, John Wiley and Sons, New York, 1981.
[3] J. Bevan, IVA, “Instability Visualization and Analysis,” in Proceedings of ISR – NASA Ames Collaborative Software Engineering Tools Workshop, Irvine, August 2002.
[4] D.Cubranic, G. C. Murphy, “Hipikat: Recommending pertinent software development artefacts,” in Proceedings of the 25th International Conference on Software Engineering (ICSE), Portland, Oregon, May 2003, pp. 408 – 418.
[5] H. Gall, M. Jazayeri, J. Krajewski, “CVS release History Data for Detecting Logical Couplings,” in Proceedings of International Workshop on Principles of Software Evolution (IWPSE), Helsinki, Finland, Sept. 2003.
[6] D. German and A. Mockus, “Automating the Measurement of Open Source Projects,” in Proceedings of ICSE '03 Workshop on Open Source Software Engineering, Portland, Oregon, May 3-10 2003.
[7] E. Hassan and R. C. Holt, “Studying The Evolution of Software Systems Using Evolutionary Code
Extractors,” in Proceedings of International Workshop on Principles of Software Evolution, Kyoto,
Japan, September 6-7, 2004. [8] http://ali.as/devel/cvsmonitor [9] http://bloof.sourceforge.net [10] http://codestriker.sourceforge.net [11] http://cvsplot.sourceforge.net
[12] Y. Liu, E. Stroulia, “Reverse Engineering the Process of Small Novice Software Teams,” in Proceedings of the 10th Working Conference on Reverse Engineering (WCRE), IEEE Press. Victoria, Canada, Nov. 2003. [13] Y. Liu, E. Stroulia, K. Wong, D. German, “Using CVS
Historical Information to Understand How Students Develop Software,” in Proceeding of International Workshop on Mining Repositories (MSR), Edinburgh, Scotland, UK, 25th May 2004.
[14] M. Michlmayr, “Managing volunteer Activity in Free Software Projects,” in Proceedings of the FREENIX Track: 2004 USENET Annual Technical Conference, Boston, MA, June-July 2004.
[15] A. Mockus, R. Fielding, J. Herbsleb, “Two Case Studies Of Open Source Software Development: Apache And Mozilla,” ACM Transactions on Software Engineering and Methodology, volume 11, number 3, 2002, pp. 309–346.
[16] L. Putnam, W. Myers, Five Core Metrics: The Intelligence behind Successful Software Management, Dorset House, 2003.
[17] E. Raymond. The Cathedral & the Bazaar, Musings on Linux and Open Source by an Accidental Revolutionary, O'Reilly UK 2001.
[18] G. Robles, S. Koch, J. M. Gonzalez-Barahona, “Remote analysis and measurement of libre software systems by means of the CVSanalY tool,” in Proceedings of the Second International Workshop on Remote Analysis and Measurement of Software Systems (RAMSS '04), ICSE 2004, Edinburgh, Scotland, 2004, pp. 51-55.
[19] Q. Tu and M. W. Godfrey, “Growth, evolution, and structural change in open source software,” in Proceedings of International Conference on Software Engineering. Proceedings of the 4th International Workshop on Principles of Software Evolution, Vienna, Austria, 2001, pp.103 - 106.
[20] M. Winter, Developing a group model for student software engineering teams, Master thesis, Univ. of Saskatchewan, 2004.
[21] K. Wong, W. Blanchet, Y. Liu, C. Schofield, E. Stroulia, Z. Xing, “JRefleX: Towards supporting small student software teams,” in Proceedings of Eclipse Technology exchange workshop, OOPSLA2003, Anaheim CA, Oct. 27 2003.
[22] Z. Xing, E. Stroulia, “Design Mentoring based on Design Evolution Analysis,” in Proceedings of Eclipse Technology eXchange workshop, OOPSLA2004, Vancouver, British Columbia, Canada, October 25, 2004.
[23] T. Zimmermann, S. Diehl, A. Zeller, “How History Justifies System Architecture (or Not),” in Proceedings of the Sixth International Workshop on Principles of Software Evolution (IWPSE'03), Helsinki, Finland, Sept. 2003.