ARTICLE
SENSITIVITY ANALYSIS IN EVOLUTIONARY ROBOTIC SIMULATIONS OF BIPEDAL
DINOSAUR RUNNING
KARL T. BATES,*,1PHILLIP L. MANNING,2,3LEE MARGETTS,2,4and WILLIAM I. SELLERS1 1Faculty of Life Sciences, University of Manchester, Stopford Building, Oxford Road, Manchester M13 9PL, U.K.,
[email protected], [email protected];
2School of Earth, Atmospheric and Environmental Science, University of Manchester, Williamson Building, Oxford Road, Manchester M13 9PL, U.K.;
3The Manchester Museum, University of Manchester, Oxford Road, Manchester M13 9PL, U.K. [email protected];
4Research Computing, University of Manchester, Oxford Road, Manchester, U.K., [email protected]
ABSTRACT—Constructing musculoskeletal models of extinct vertebrates requires subjective assumptions about soft tissue parameters rarely preserved in the fossil record. Despite these necessary assumptions about fundamental input values, pa-leobiologists rarely perform objective tests of best-estimate models before reaching conclusions based on predicted results. The extent to which lack of knowledge on soft tissue anatomy limits the accuracy of running speed estimates of extinct di-nosaurs is therefore poorly understood. In this study, a sensitivity analysis is performed on an evolutionary robotics model of the non-avian theropod dinosaur Allosaurus, used previously to estimate maximum running speed in this extinct animal. A range of muscle parameters were varied over the range observed in extant vertebrates, whereas mass-related parameters were altered across the range of published estimates for Allosaurus. Muscle parameters have a linear relationship with maximum running speed, whereas surprisingly total body mass and torso center of mass have little effect. Muscle force values produced the greatest range in predicted running speeds (4.5–10.7 m/s) and stride lengths (4–5.8 m) in the sensitivity analysis, equating to 65.9% and 30.7% variation about the original ‘best-estimate’ prediction, a relatively high potential margin of error. These results highlight the importance of sensitivity analyses in biomechanical modeling of extinct taxa, particularly where values for soft tissues parameters are not tightly constrained. The current range in plausible values for soft tissue properties makes a robust quantitative assessment of behavioral ecology and species interactions in dinosaurian communities extremely difficult.
INTRODUCTION
Mathematical-computational modeling is an accepted ap-proach to testing form-function relationships in extinct verte-brates. High-performance computing has become increasingly accessible to paleobiologists and provides the facility to rapidly solve the complex chain of equations that describe the mechan-ics and energetmechan-ics of three-dimensional (3D) motion in jointed musculoskeletal systems. Computational methods are now stan-dard for calculating the mass and inertial properties of organisms (Henderson, 1999; Henderson and Snively, 2004; Hutchinson et al., 2007; Bates et al., 2009a, 2009b) and for reconstructing the mechanical behavior (e.g., Rayfield, 2004, 2005; Richmond et al., 2005), range of motion and functional repertoire (e.g., Stevens and Parrish, 1999), and likely kinematics and energetic perfor-mance of biological structures (e.g., Sellers et al., 2004, 2005; Nagano et al., 2005). These numerical analyses have some ad-vantages over the more traditional methods of analogy and theo-retical inference because they are inherently more objective and deterministic, producing explicit quantitative predictions. Mod-eling methods are particularly important when suitable mod-ern analogues are lacking for extinct taxa, because they allow the function of unique morphological structures to be reverse-engineered. Furthermore, the increased level of quantification and visualization inherent in computational methods provides a more complete understanding of the similarities and differences
*Corresponding author.
in form and function among taxa across space and time. Primary interpretations of mechanics and performance drawn from such analyses can subsequently be used to support secondary inter-pretations (or ‘higher-level inferences’; Witmer, 1995) relating to behavioral ecology, clade-clade interaction, and possible selec-tion pressures in extincselec-tion events and evoluselec-tionary radiaselec-tions (Sereno, 1999).
To produce reliable biomechanical predictions, mathematical-computational procedures require a digital or numerical model that replicates the anatomy and physiology of an organism with high fidelity. Advances in computer software and digitizing tech-nology have made the production of complex musculoskele-tal models a relatively straightforward procedure (e.g., Stevens, 2002; Hutchinson et al., 2005). However, taphonomic loss and alteration of biological material means the extraction of values for skeletal and soft tissue properties from fossils is problematic and in many cases impossible. Estimations of the original mate-rial properties of bone and the geometry and physiology of soft tissues are therefore restricted to ranges exhibited by extant out-groups. Even where values are tightly constrained by an Extant Phylogenetic Bracket (EPB), input models necessarily remain best-estimate representations with an unknown level of confi-dence (Witmer, 1995). It is therefore best practice to perform a sensitivity analysis on biomechanical models of extinct taxa, in which uncertain best-estimate values are altered in order to observe their effects on model predictions. Sensitivity analyses have been applied in a number of recent studies (Kramer, 1999; Hutchinson, 2004a, 2004b; Sellers and Crompton, 2004; Ross
et al., 2005; Strait et al., 2005; Hutchinson et al., 2007; Porro, 2008) but have yet to become a routine part of modeling procedure in paleobiology and biomechanics.
Sellers and Manning (2007) used multi-body dynamics and evolutionary robotic optimizations to estimate maximum running speed of the extinct non-avian theropod dinosaur Allosaurus. In multi-body dynamic analyses, a body is treated as a set of rigid segments acted upon by various forces and constrained by the joints between the segments. The movement of each segment is calculated by solving a large matrix of differential equations or ‘equations of movement’ (for a review, see Winter, 1990). To cre-ate stable running in the model, an appropricre-ate muscle activation pattern was developed by a distributed, parallel genetic algorithm (GA) optimization system, similar to those used to spontaneously generate gait in autonomous robots (Nolfi and Floreano, 2000). The GA control system was designed to search for the muscle activation pattern that maximized performance according to spe-cific fitness criteria, in this case maximum running speed. This system alleviates the need to subjectively infer joint kinematics or rely on extant taxa as dubious locomotor analogues. However, the accuracy of the simulated gait still ultimately relies on the bio-fidelity of the anatomical model, which necessarily includes estimation of soft tissue parameters rarely available in the fossil record. The aim of this study is to provide a confidence test of the maximum running speed of 9.4 m/s predicted for Allosaurus by Sellers and Manning (2007). A one-at-a-time (OAAT) sensi-tivity analysis (Campolongo et al., 2000) has been used to iden-tify anatomical and physiological parameters that have greatest effect on the simulated results. In OAAT sensitivity analyses, the numerical values used as inputs to the model are treated as plausible ranges rather than best-estimates values. The model is run repeatedly and input values sampled from those ranges. OAAT sensitivity analyses have the advantage of being relatively quick to run, which is essential in the current context because the GA-based simulator is extremely slow. Monte Carlo approaches would normally be preferred because they allow the analysis of interaction between parameters as well as independent effects, but these are extraordinarily computationally expensive and so currently impractical. Altering the values of a specific parameter individually isolates its effect on gait and performance and allows the modeler to identify the input parameters that have the most significant impact on the results. In this study, a number of muscle parameters were varied over the ranges observed in extant verte-brates, whereas mass-related parameters were altered across the range of published estimates for Allosaurus (Table 1).
METHODS
The model and simulation procedure remained unchanged from the original study of Sellers and Manning (2007) to ensure fair and meaningful comparison of results. Allosaurus is repre-sented by a 2D model with a rigid trunk, and right and left thigh, shank, and composite foot segments combining the metatarsus and foot (Fig. 1). Locomotion is driven by generalized or aggre-gated muscle-tendon units, specifically a single flexor and
exten-sor across each of the three hind limb joints. The full specifica-tion for the model is included as human readable XML files as electronic supplementary material. The Open Dynamics Engine (ODE http://www.ode.org) was again used to provide the physics simulation. The muscle activation pattern was generated from our custom written genetic algorithm optimization programme (Sellers and Manning, 2007).
Simulations are computationally expensive and hence testing every input parameter with multiple re-runs would take consider-able amount of time. Five parameters were selected for this study (Table 1) based on their theoretical relevance to maximum run-ning speed in legged locomotion (Hill, 1950; Rome et al., 1988; Medler, 2002; Roberts and Scales, 2002; Hutchinson, 2004a) and the uncertainty surrounding their values for non-avian dinosaurs. Muscle force parameters used in this model (force per unit area, physiological cross-section area, and muscle mass) were linearly related so changes in any of the parameters would have exactly the same effect on the model outcome. This means that all the effects reported for varying force per unit area (FPUA) would equally apply to muscle mass or physiological cross-section area. FPUA values were tested above and below the extremes reported in the literature (Table 1) to ensure these related muscle parame-ters were accounted for in the analysis. Altering fiber length does not have a simple linear effect because it not only alters FPUA in our formulation but also affected contraction velocity (which is a multiple for fiber length) and the elastic properties of the system by changing tendon length. Body mass and center of mass (CM) have long been of interest to dinosaur paleobiologists and these two parameters have also been tested in the sensitivity analysis. Hind limb muscle mass remained at the original percentage of total body mass throughout the range of total body mass values tested. CM was altered by repositioning the longitudinal position (i.e., horizontal distance from hip joint) of the trunk CM, without changing the vertical position. In each case, the trunk moments of inertia were recalculated to the apprioprate values. Rigorous testing of these input parameters took several months to carry out, with simulations run on a dedicated cluster of 60 processors at the University of Manchester and the supercomputer HEC-ToR (U.K. National Supercomputing Service).
RESULTS
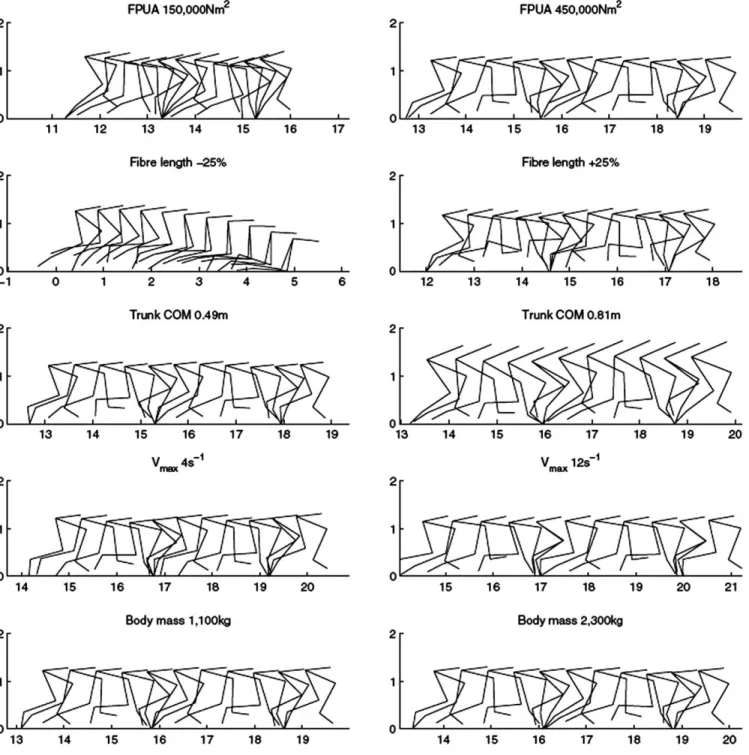
Stable gaits were achieved throughout the input ranges tested for FPUA, maximum contraction velocity (Vmax), body mass, and trunk CM (Fig. 2). These remained true running gaits by kinematic definition (i.e., aerial phase present) for the full range of values for each parameter (Fig. 2). Stable locomotion was achieved with the increased fiber lengths tested, but could not be achieved when fiber lengths were lowered by 20% or more (Fig. 2).
The resulting speeds and stride lengths for each parameter have been collated in Table 2. FPUA, Vmax, and fiber length have an approximately linear effect on running speed (Fig. 3A), with FPUA producing the greatest range in predicted speeds (Fig. 3B).
FIGURE 1. The musculoskeletal model of
Allosaurus (Sellers and Manning, 2007).
Loco-motion is driven by a single aggregate flexor and extensors (grey lines) across each joint in the hind limb (spheres). Conic segments with the appropriate mass and inertial properties were used to represent the limb segments and back-to-back circular cones were used for the trunk.
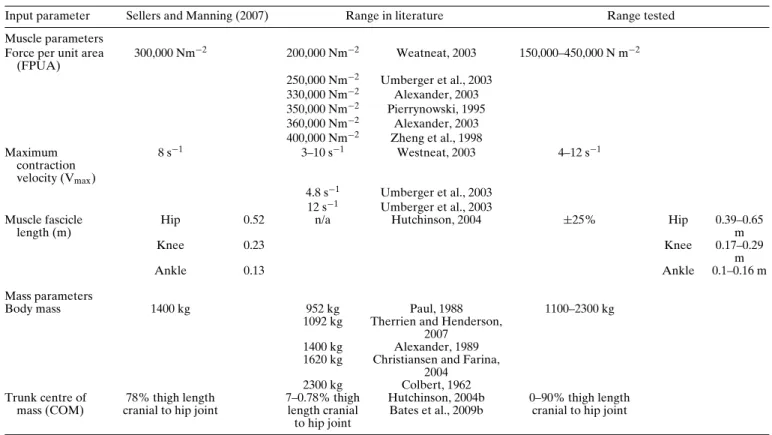
TABLE 1. Numerical inputs values for OAAT sensitivity analysis sourced from literature.
Input parameter Sellers and Manning (2007) Range in literature Range tested Muscle parameters
Force per unit area (FPUA) 300,000 Nm−2 200,000 Nm−2 Weatneat, 2003 150,000–450,000 N m−2 250,000 Nm−2 Umberger et al., 2003 330,000 Nm−2 Alexander, 2003 350,000 Nm−2 Pierrynowski, 1995 360,000 Nm−2 Alexander, 2003 400,000 Nm−2 Zheng et al., 1998 Maximum contraction velocity (Vmax) 8 s−1 3–10 s−1 Westneat, 2003 4–12 s−1 4.8 s−1 Umberger et al., 2003 12 s−1 Umberger et al., 2003 Muscle fascicle length (m)
Hip 0.52 n/a Hutchinson, 2004 ±25% Hip 0.39–0.65
m
Knee 0.23 Knee 0.17–0.29
m
Ankle 0.13 Ankle 0.1–0.16 m
Mass parameters
Body mass 1400 kg 952 kg Paul, 1988 1100–2300 kg
1092 kg Therrien and Henderson, 2007
1400 kg Alexander, 1989 1620 kg Christiansen and Farina,
2004 2300 kg Colbert, 1962 Trunk centre of
mass (COM)
78% thigh length cranial to hip joint
7–0.78% thigh length cranial to hip joint Hutchinson, 2004b Bates et al., 2009b 0–90% thigh length cranial to hip joint
TABLE 2. Summary of results for OAAT sensitivity analysis.
Input parameters Input value Speed (m/s) Stride length (m) Froude number
Muscle parameters
Force per unit area (FPUA) 150,000 Nm−2 4.5 4 1.19
187,500 Nm−2 5.1 4.5 1.54 225,000 Nm−2 6.9 5.1 2.76 262,500 Nm−2 8 5.3 3.78 337,500 Nm−2 9.7 5.8 5.47 375,000 Nm−2 10 5.7 5.82 412,500 Nm−2 10.5 5.8 6.38 450,000 Nm−2 10.7 5.8 6.70
Maximum contraction velocity (Vmax) 4 s−1 6.7 5.2 2.62
6 s−1 7.8 5.4 3.54
10 s−1 9.61 5.9 5.38
12 s−1 10.7 6 6.63
Muscle fascicle length +5% 8.7 5.3 4.37
+15% 8.2 5.3 3.95 +25% 7.9 5.0 3.67 −5% 9.3 5.9 5.03 −15% 9.3 5.7 5.07 −25% 1.1 0.4 — Mass parameters Body mass 1100 kg 9.1 5.5 4.88 1700 kg 9 5.5 4.73 2100 kg 9 5.5 4.69 2300 kg 9 5.5 4.74
Trunk center of mass (% thigh length cranial to hip joint) 0 9.02 4.59 4.75 10 8.56 6.12 4.27 20 8.81 5 4.52 30 8.65 4.59 4.36 40 8.8 4.96 4.51 50 9.14 5.15 4.87 60 8.78 4.99 4.49 70 8.96 5.88 4.68 90 8.84 5.65 4.55
FIGURE 2. Overlay images of the best gait solutions for the minimum and maximum values of A, FPUA, B, fiber length, C, trunk CM, D, Vmax, and
E, body mass for Allosaurus in the OAAT sensitivity analysis. Stable running gaits (Froude number>1.5 with an aerial phase) were achieved for the
full range of Vmax, body mass, and trunk CM values. Stable locomotion was achieved with the increased fiber lengths tested, but could not be achieved when fiber lengths were lowered by 20% or more. All scales are in meters and 11 images are generated per gait cycle.
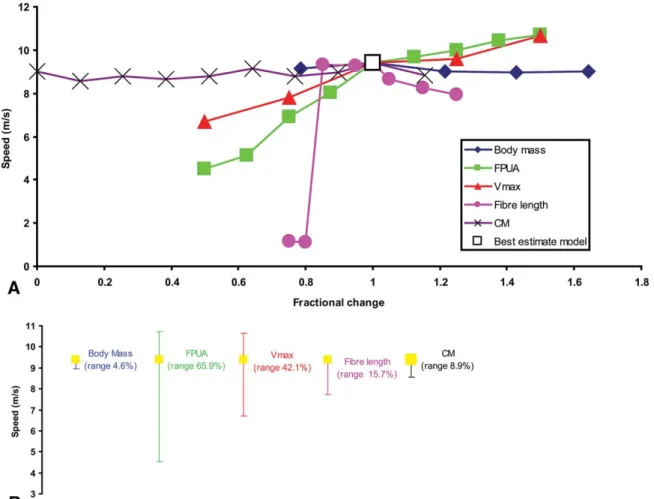
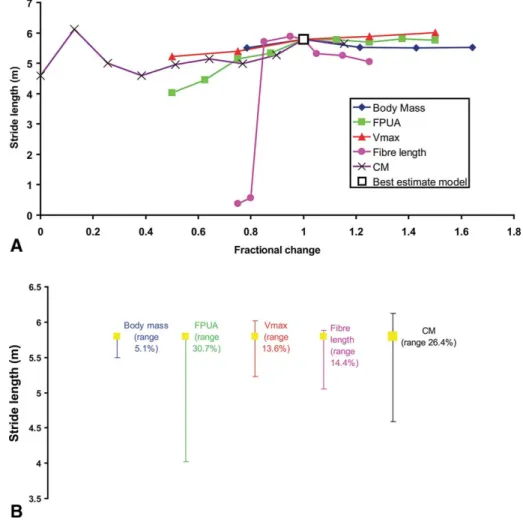
Predicted top speed ranged from 4.5 m/s with FPUA at 150,000 Nm−2to 10.7 m/s at an FPUA of 450,000 Nm−2, equating to 65.9% variation about the best-estimate speed of 9.4 m/s (Sellers and Manning, 2007). Despite the significant range in tested values, body mass and trunk CM have virtually no effect on the predicted top speed (Fig. 3). Predicted stride lengths show a similar pattern of distribution to maximum speed, with FPUA, Vmax, and fiber length having an approximately linear effect (Fig. 4A). FPUA again produces the greatest range in predicted values (Fig. 4B),
yielding a minimum stride length of 4 m at low FPUA values and a maximum of 5.8 m at high values. Body mass and trunk CM have little effect over the range of values tested (Fig. 4).
DISCUSSION
Theoretical Consideration of Input Effects
The relationship between each input parameter and maximum running speed in the OAAT sensitivity analysis corresponds with
FIGURE 3. A, Fractional changes of input parameters plotted against maximum running speed for Allosaurus. B, Total range in maximum running speed about the best-estimate model value for each parameter in OAAT sensitivity analysis.
theoretical predictions (but see discussion of body mass effects below). Increasing FPUA and Vmax and decreasing fiber length directly increases the maximum force and power each contract-ing muscle is able to generate, hence produccontract-ing higher top speeds (Fig. 3). Increasing total body mass produces a larger yet geo-metrically similar model of Allosaurus, with an identical muscle mass:total body mass ratio with skeletal parameters unchanged. Hence predicted maximum running speed remains almost constant (Fig. 3). The minor amount of variation reflects the stochastic nature of the GA optimisation. The lack of effect re-sulting from changes in body mass is actually surprising. Simple geometrical models of top speed scaling (Hill, 1950) predict no effect of body mass, but this assumes concurrent changes in leg length scaling as mass1/3, which is not occurring in the model used in this study. This lack of effect may be because over the limited mass range used, the leg scaling would have been rather small so its effect cannot be seen. It is also likely that the simple geomet-ric model does not accurately predict running speed (Blanco and Gambini, 2007) and this is reflected in these results. In this anal-ysis, no consideration was given to skeletal loading, which may severely restrict the ability to attain high speeds at the largest body masses tested. There is no theoretical reason why, in such a simple model, trunk CM should influence maximum running speed within its appropriate functional range, which is defined as the point at which the foot is no longer able to attain a posi-tion forward of the trunk CM in order to produce the necessary ground reaction force (GRF) vector for forward propulsion. This
limit was not exceeded by the range of trunk CM values tested, hence predicted maximum running speeds remained relatively constant with minor variation again attributable to the stochas-tic nature of the optimization technique.
Implications for the Prediction of Maximum Running Speed in Dinosaurs
FPUA (or its linear equivalents: muscle mass and physio-logical cross-sectional area) and Vmax are shown to have the greatest effect on top speed (Fig. 3) and therefore represent the major source of uncertainty in running speed predictions for extinct dinosaurs. The broad range in FPUA and Vmax values available in the literature reflects the highly variable contractile properties of vertebrate muscle, both within muscle groups and between individual species. Values for FPUA included 200,000 Nm−2 for fish (Weatneat, 2003), 250,000 Nm−2 (Umberger et al., 2003) and 350,000 Nm−2 (Pierrynowski, 1995) for humans, 330,000 Nm−2for cat, and 360,000 Nm−2for frog parallel fibered leg muscles (Alexander, 2003), and a value of 400,000 Nm−2 for human quadriceps (Zheng et al., 1998). There is a similarly large range for Vmax, with values highly dependent both on the fiber-type composition of the muscle and on the temperature. Winter (1990) suggests values from 6 to 10 times the muscle’s resting length per second for humans. Westneat (2003) reported a range of values for fish from 3 to 10 s−1 for different fiber types and Umberger et al. (2003) recommended values of
FIGURE 4. A, Fractional changes of input parameters plotted against stride length for
Al-losaurus. B, Total range in stride length about
the best-estimate model value for each param-eter in OAAT sensitivity analysis.
12 s−1for fast-twitch and 4.8 s−1for slow-twitch fibers. Although these ranges currently appear broad, the majority of data points do cluster around the overall mean value (particularly for the larger terrestrial animals tested), allowing sensible best-estimate values to be chosen for these parameters. However, values for total hind limb muscle mass (linearly equivalent to FPUA in our model) in non-avian dinosaurs are poorly constrained and the cause of significant debate (Hutchinson and Garcia, 2002; Paul, 1988, 2008; Hutchinson et al., 2007; Bates et al., 2009a). The lack of phylogenetic and functional analogues for large (>1000 kg) bipedal dinosaurs is confounded further by a lack of muscle mass data from extant taxa, with only a handful of published values for the ratio of hind limb muscle mass to total body mass in living bipeds. In most studies of extant species, complete limb segments are weighed so that bone mass is included muscle mass measurements, whereas in other cases the body mass of the dissected specimen is not stated and thus ratio of ‘locomotor muscle mass’ to total body mass cannot be determined. However, these former studies do provide a proxy for limb muscle mass to total body mass ratio in extant bipeds. The eight habitual bipeds studied by Hutchinson (2004a) had total hind limb masses (both limbs combined) equivalent to 18.5–54.6% total body mass, whereas data on the black-billed magpie (Pica pica) suggests 18% represents an average for this species (Verstappen et al., 1998). Smith et al. (2006) dissected the complete musculature of the pelvic limbs of 10 ostrich (Struthio camelus) and found the mean total muscle mass (both legs combined) to be 33.7% ± 2.1% total body mass. The best-estimate Allosaurus (Sellers and Manning, 2007) had 47.7% total body mass in both limbs
combined, which falls within this range. The equation for muscle force in the simulator is such that the minimum and maximum muscle FPUA area values tested (150,000 and 450,000 Nm−2) are equivalent to models of Allosaurus with hind limb muscle masses in both limbs at 23.86% and 67.56% of total body mass, respectively. This range exceeds that found in the literature for extant bipeds, including the highest values for extant ratites (Smith et al., 2006). Although some of these measurements are inclusive of bone mass, it is expected that extant ratites have higher hind limb mass to total mass ratios than non-avian dinosaurs given their relatively larger pelvic limbs, more slender thorax, and extensive air sac systems (Hutchinson et al., 2007).
Muscle fascicle lengths and other aspects of muscle architec-ture represent the most uncertain input parameters in models of extinct species and it is significant in terms of confidence that its effects are outweighed by other parameters. The EPB pro-vided by crocodilians and crown-group birds offers a systematic means to estimate fascicle lengths in extinct dinosaurs on the basis of homology and in some cases functional considerations (Hutchinson, 2004b). A linear relationship between fiber length and muscle force (hence top speed) was borne out by our simple model of Allosaurus, but its effect is likely to be more complex in more detailed models with multiple muscles crossing hind limb joints.
Body mass and trunk CM had no effect on performance predic-tions despite the extremely broad range of values tested for both parameters. Sensitivity analysis on a volumetric reconstruction of the most complete specimen of Allosaurus currently known (MOR 693) indicates that the ‘plausible’ range for both total
body mass values lies well within the range tested here for an Al-losaurus with skeletal proportions similar to the model used here (Bates et al., 2009b). This study suggested that the trunk CM was likely to have been between 7% and 64% of femoral length cra-nial of the hip joint in Allosaurus (Bates et al., 2009b). Altering trunk CM across this range resulted in little change to maximum speed, but it did affect the kinematics of limbs and torso in run-ning gaits owing to the sub-horizontal orientation of the torso in bipedal non-avian theropod dinosaurs. Specifically, under more craniad trunk CM positions, the model tended to respond by in-creasing the angle of the trunk with respect to the ground, such that the anterior half of the body becomes raised to limit the ex-cursion of the CM away from the hip joint on the longitudinal axis (Fig. 2C). Clearly a more anatomically realistic trunk model is re-quired to fully constrain the effects of trunk CM position on lo-comotor performance, particularly if meaningful kinematic pre-dictions are to be made.
There is significant scope to extend this sensitivity to investi-gate the effects of other parameters on performance predictions, notably the location of ligament and tendon attachments and the values for elastic parameters. Performance predictions would also benefit from greater bio-fidelity in the anatomical model. The model could be 3D and include more muscles, including two joint muscles and other soft tissues (e.g., ligaments). Improved realism in the trunk may also help constrain or bracket the func-tional range of trunk CM values for bipedal dinosaurs.
Speed Predictions and Higher-Level Interpretations
The significant effect of muscle parameters on predicted top speed clearly has a profound effect on any secondary higher-level interpretations of the behavioral ecology of Allosaurus. Maximum running speed is an important determinant of eco-logical behavior and success in terrestrial vertebrates, and plays a fundamental role in predator-prey interactions (Alexander, 2003). Indeed, as the effects of these parameters almost certainly apply equally to potential prey species and other aspects of their locomotor ability, such as acceleration and turning (e.g., Hutchinson et al., 2007), the current range in plausible values for soft tissue properties makes a robust quantitative assessment of behavioral ecology and species interactions in dinosaurian com-munities extremely difficult. Furthermore, the effects identified here for individual parameters are likely to be exacerbated if multiple factors, particularly FPUA and Vmax, are similarly over-or underestimated. There is almost certainly interaction between these parameters, which could be explored using a full Monte Carlo analysis (Campolongo et al., 2000). In such an analysis, all the muscle parameters (FPUA, muscle mass, fiber length, Vmax) would all be included so their individual uncertainties and interactions could be assessed. However, this is currently impractical due to the computational expense of such an analysis. The present inability to tightly constrain the ranges of soft tis-sue input values raises the question of whether any estimation of maximum running speed is currently reliable enough for higher-level inferences to be based upon. It is important to emphasize that best-estimate values are chosen because they are considered to have the highest probability of matching correct values based on our current knowledge of vertebrate skeletal muscle and di-nosaur soft tissue anatomy (Table 1). Values at the extreme of ranges therefore represent the most unlikely values for each rameter. Although it is likely that precise values for muscle pa-rameters will never be obtained for extinct dinosaurs, more work on locomotor muscle physiology of extant vertebrates, and par-ticularly large animals, will allow these ranges to be constrained further. In addition, it may be possible to constrain muscle pa-rameters based on skeletal safety factors: although it is possible to postulate very large muscle mass or high contractile forces, these are only plausible if the skeleton is strong enough to
with-stand the forces generated. Similarly, muscles must be able to generate the forces required for a minimal locomotor repertoire: walking, standing, getting up from the ground and this provides a functional lower limit. However in spite of the present uncer-tainty about numerous input values, our approach allows us to disprove certain hypotheses regarding locomotor performance in extinct animals. In particular, this sensitivity analysis has shown that even with high hind limb muscle masses or maximized con-tractile properties, large bipedal dinosaurs could not have ob-tained the high speeds (>20 m/s) postulated by some workers (Bakker, 1986; Paul, 1988, 1998). Indeed, this sensitivity analysis suggests that speeds in excess of 12 m/s require not only high rel-ative muscle masses compared to those known for extant bipeds, but also muscle-tendon properties highly optimized for fast run-ning. Higher speeds for Allosaurus (and by inference similarly proportioned theropods) are therefore unlikely based on current simulations. In future studies, the range in speed predictions will be further refined by more anatomically realistic models.
CONCLUSION
Sensitivity analysis provides a means to quantify the effects of poorly understood input parameters in dynamic simulations of locomotion and in biomechanical modeling in general. In partic-ular, certain values for soft tissue parameters are tenuously es-timable in extinct animals and sensitivity analysis offers an un-derstanding of how variation in and between these parameters may interact to produce functional outcomes. This study of Al-losaurus has shown that soft tissue parameters tested (FPUA, Vmax, and fiber length) have an approximately linear effect on performance predictions, in accordance with theoretical predic-tions. FPUA has the greatest effect on the simulated gait across the range observed in extant taxa, equating to 65.9% variation in speed (4.5–10.7 m/s) and 30.7% variation in stride length about the original best-estimate model predictions of 9.4 m/s and 5.8 m (Sellers and Manning, 2007). Body mass and trunk CM had no effect on performance predictions over the range of values tested, suggesting existing values for these parameters are accu-rate enough for performance predictions. However, future anal-yses that aim to reverse engineer the locomotor kinematics of extinct dinosaurs will have to consider the impact of trunk CM, which significantly affected limb kinematics and torso orientation in Allosaurus. Mass reconstructions of dinosaurs should routinely include a sensitivity analysis (e.g., Hutchinson et al., 2007; Bates et al., 2009a) to provide plausible ranges of trunk CM for dy-namic biomechanical simulations. A more complete quantitative understanding of the relationship between body mass and loco-motor capability might be achieved by consideration of skeletal loading in future models. The range in possible gaits produced in this OAAT sensitivity analyses emphasises the current limi-tations in the predictive power of biomechanical techniques that result from an inability to extract soft tissue characteristics from the fossil record. More work on the hind limb muscle physiol-ogy of extant terrestrial vertebrates, particularly larger species, is required to constrain the current range of input values and sub-sequently the array of plausible gaits for extinct species. The un-certainty inherent in current biomechanical predictions must be taken into account when considering paleoecological and evolu-tionary hypotheses. However, the facility to conduct controlled repeatable experiments in the form of sensitivity analyses means that the effects of such uncertainties can be quantitatively tested and in many cases enable higher-level interpretations to be ap-propriately constrained.
ACKNOWLEDGMENTS
This research was funded by grants from BBSRC, National Environmental Research Council, and the Leverhulme Trust to W.I.S., a National Environmental Research Council grant to
K.T.B., and the HECToR project e72, EP/F055595/1, funded through the HECToR Capability Challenge Call to L.M.. The au-thors would like to thank the editors, Mark Wilson, Robert Reisz, and David Weishampel for their patience and hard work on this paper during the submission process, and the two reviewers, Eric Snively and Roger Benson, for helpful suggestions that greatly improved the manuscript.
LITERATURE CITED
Alexander, R. M. 1989. Dynamics of Dinosaurs and Other Extinct Giants. Columbia University Press, New York, 167 pp.
Alexander, R. M. 2003. Principles of Animal Locomotion. Princetown University Press, Princetown, New York, 384 pp.
Bates, K. T., P. L. Manning, D. Hodgetts, and W. I. Sellers. 2009a. Estimating mass properties of dinosaurs using laser imaging and computer modelling. Public Library of Science ONE 4:e4532 doi:10.1371.
Bates K. T., P. L. Falkingham, B. H. Breithaupt, D. Hodgetts, W. I. Sellers, and P. L. Manning. 2009b. How big was ‘Big Al’? Quanti-fying the effect of soft tissue and osteological unknowns on mass predictions for Allosaurus (Dinosauria:Theropoda). Palaeontologi-cal Electronica 12:14A, 33 pp.
Blanco, R. E., and R. Gambini. 2007. Maximum running speed limitations on terrestrial mammals: a theoretical approach. Journal of Biome-chanics 40:2517–2522.
Bakker, R. T. 1986. Dinosaur Heresies. William Morrow, New York, 481 pp.
Campolongo, F., A. Saltelli, T. Sørensen, and S. Taratola. 2000. Hitchhik-ers’ guide to sensitivity analysis; pp. 15–47 in A. Saltelli, K. Chan, and E. M. Scott (eds.), Sensitivity Analysis. Wiley, Chichester, U.K. Colbert, E. H. 1962. The weights of dinosaurs. American Museum
Novi-tates 2181:1–24.
Gans, C., and F. De Vree. 1987. Functional bases of fiber length and an-gulation in muscle. Journal of Morphology 192:63–85.
Henderson, D. M. 1999. Estimating the masses and centers of masses of extinct animals by 3-D mathematical slicing. Paleobiology 25:88–106.
Henderson, D. M., and E. Snively. 2004. Tyrannosaurus en pointe: al-lometry minimized rotational inertia of large carnivorous dinosaurs. Proceedings of the Royal Society of London B (Supplement). Biol-ogy Letters 271:S57–S60.
Hill, A. V. 1938. The heat of shortening and the dynamic constants of muscle. Proceedings of the Royal Society of London B 126:136–195. Hill, A. V. 1950. The dimensions of animals and their muscular dynamics.
Science Progress 150:209–230.
Hutchinson, J. R. 2004a. Biomechanical modeling and sensitivity analysis of bipedal running ability. I. Extant taxa. Journal of Morphology 262:421–440.
Hutchinson, J. R. 2004b. Biomechanical modeling and sensitivity analysis of bipedal running ability. II. Extinct taxa. Journal of Morphology 262:441–461.
Hutchinson, J. R., and M. Garcia. 2002. Tyrannosaurus was not a fast runner. Nature 415:1018–1021.
Hutchinson, J. R., V. Ng-Thow-Hing, and F. C. Anderson. 2007. A 3D interactive method for estimating body segmental parame-ters in animals: application to the turning and running perfor-mance of Tyrannosaurus rex. Journal of Theoretical Biology 246: 660–680.
Hutchinson, J. R., F. C. Anderson, S. S. Blemker, and S. L. Delp. 2005. Analysis of hindlimb muscle moment arms in Tyrannosaurus rex us-ing a three-dimensional musculoskeletal computer model: implica-tions for stance, gait and speed. Paleobiology 31:676–701.
Kramer, P. A. 1999. Modelling the locomotor energetics of extinct ho-minids. Journal of Experimental Biology 202:2807–2818.
Medler, S. 2002. Comparative trends in shortening velocity and force production in skeletal muscle. American Journal of Physiology—Regulatory, Intergrative and Comparative Physi-ology 283:R368–R378.
Minetti, A. E., and R. M. Alexander. 1997 A theory of metabolic costs for bipedal gaits. Journal of Theoretical Biology 186:467–476.
Nagano, A., B. R. Umberger, M. W. Marzke, and K. G. M. Gerritsen. 2005. Neuromusculoskeletal computer modeling and simulation of upright, straight- legged, bipedal locomotion of Australopithecus
afarensis (A.L. 288-1). American Journal of Physical Anthropology
126:2–13.
Newman, B. H. 1970. Stance and gait in the flesh-eating dinosaur
Tyran-nosaurus. Biological Journal of the Linnaean Society 2:119–123.
Nolfi, S., and D, Floreano. 2000. Evolutionary Robotics. MIT Press, Cam-bridge, Massachusetts, 332 pp.
Ostrom, J. H. 1969. Osteology of Deinonychus antirrhopus, an unusual theropod from the Lower Cretaceous of Montana. Bulletin of the Yale Peabody Museum of Natural History 30:1–165.
Paul, G. S. 1988. Predatory Dinosaurs of the World. Simon and Schuster, New York, 464 pp.
Paul, G. S. 1998. Limb design, function and running performance in ostrich-mimics and tyrannosaurs. Gaia 15:257–270.
Paul, G. S. 2008. The extreme lifestyles and habits of the gigantic tyran-nosaurid superpredators of the Late Cretaceous of North America and Asia; pp. 307–354 in P. Larson and K. Carpenter (eds.), Tyran-nosaurus Rex, The Tyrant King. Indiana University Press, Bloom-ington, Indiana.
Pierrynowski, M. R. 1995. Analytical representation of muscle line of ac-tion and geometry; pp 215–256 in P. Allard, I. A. F. Stokes, and J. P. Blanch (eds.), Three-dimensional analysis of human movement. Human Kinetic Publishers, Champaign, Illinois.
Porro, L. 2008. Accuracy in finite element modeling of extinct taxa: sen-sitivity analyses in Heterodontosaurus tucki. Journal of Vertebrate Paleontology 28(3, Supplement)128A.
Rayfield, E. J. 2004. Cranial mechanics and feeding in Tyrannosaurus rex. Proceedings of the Royal Society London B 271:1451–59.
Rayfield, E. J. 2005. Aspects of comparative cranial mechanics in the theropod dinosaurs Coelophysis, Allosaurus and Tyrannosaurus. Zoological Journal of the Linnean Society 144:309–316.
Richmond, B. G., B. W. Wright, I. Grosse, P. C. Dechow, and C. F. Ross. 2005. Finite element analysis in functional morphology. Anatomical Record 283A:259–274.
Roberts, T. J., and J. A. Scales. 2002. Mechanical power output during running accelerations in wild turkeys. Journal of Experimental Biol-ogy 205:1485–1494.
Rome, L. C., R. P. Funke, R. M. Alexander, G. Lutz, H. Aldridge, F. Scott, and M. Freadman. 1988. Why animals have different fibre types. Nature 335:824–827.
Ross, C. F., B. A. Patel, D. E. Slice, D. S. Strait, P. C. Dechow, B. G. Richmond, and M. A. Spencer. 2005. Modeling masticatory mus-cle force in finite element analysis: sensitivity analysis using prin-ciple coordinates analysis. The Anatomical Record Part A 283A: 288–299.
Sellers, W. I., and R. H. Crompton. 2004. Using sensitivity analysis to vali-date the predictions of a biomechanical model of bite forces. Annals of Anatomy 186:89–95.
Sellers, W. I., and P. L. Manning. 2007. Estimating dinosaur maxi-mum running speeds using evolutionary robotics. Proceedings of the Royal Society B 274:2711–2716.
Sellers, W. I., L. A. Dennis, W. Wang, and R. H. Crompton. 2004. Evalu-ating alternative gait strategies using evolutionary robotics. Journal of Anatomy 204:343–351.
Sellers, W. I., G. M. Cain, W. Wang, and R. H. Crompton. 2005. Stride lengths, speed and energy costs in walking of
Australopithe-cus afarensis: using evolutionary robotics to predict locomotion of
early human ancestors. Journal of the Royal Society Interface 5: 431–441.
Sereno, P. 1999. The evolution of the dinosaurs. Science 284: 2137–2147.
Smith, N. C., A. M. Wilson, K. J., Jespers, and R. C. Payne. 2006. Muscle architecture and functional anatomy of the pelvic limb of the ostrich (Struthio camelus). Journal of Anatomy 209:765–779.
Stevens, K. 2002. DinoMorph: parametric modeling of skeletal structures. Senckenbergiana Lethaea 82:23–34.
Stevens, K. A., and J. M. Parrish. 1999. Neck posture and feeding habits of two Jurassic sauropod dinosaurs. Science 284:798–800.
Strait, D. S., Q. Wang, P. C. Dechow, C. F. Ross, B. G. Richmond, M. A. Spencer, and B. A. Patel. 2005. Modeling elastic properties in finite-element analysis: how much precision is needed to pro-duce an accurate model? The Anatomical Record Part A 283A: 275–287.
Umberger, B. R., K. G. M. Gerritsen, and P. E. Martin. 2003. A model of human muscle energy expenditure. Computational Methods in Biomechanics and Biomedical Engineering 6:99–111.
Verstappen, M., P. Aerts, and F. De Vree. 1998. Functional morphology of the hindlimb musculature of the black-billed magpie, Pica pica (Aves, Corvidae). Zoomorphology 118:207–223.
Westneat, M. W. 2003. A biomechanical model for analysis of muscle force, power output and lower jaw motion in fishes. Journal of The-oretical Biology 223:269–281.
Witmer, L. M. 1995. The Extant Phylogenetic Bracket and the impor-tance of reconstructing soft tissues in fossils; pp. 19–33 in J. J. Thomason (ed.), Functional Morphology in Vertebrate Paleontol-ogy. Cambridge University Press, Cambridge, U.K
Winter, D. A. 1990. Biomechanics and motor control of human move-ment. John Wiley and Sons, New York, 277 pp.
Zheng, N., G. S. Fleisig, R. F. Escamila, and S. W. Barrentine. 1998. An analytical model of the knee for estimation of in-ternal forces during exercise. Journal of Biomechanics 31:963– 967.