The Effect of Angiostatin on the Endothelial Cell Cycle
by
Chang-Hwa Mary Chen B.S. Biology
California Institute of Technology, 1994
Submitted to the Department of Biology in Partial Fulfillment of the Requirements for the Degree of
Master of Science in Biology at the
Massachusetts Institute of Technology June 1998
@1998 Massachusetts Institute of Technology All rights reserved
Signature of Author... . . ... ... .:... Department of Biology May 29, 1998 Certified by C ertified ... ... ... /.. ... ... ... ... Robert A. Weinberg Professor of Biology Thesis Supervisor A Accepted by ...
...
Frank Solomon Head of the Graduate Committee001"w 041998
--Table of Contents:
Acknowledgments ... p. 3
Abstract... p. 4
Introduction ... pp. 5-9 Materials and Methods...pp. 10-11 Results ... pp. 12-22 Figures ... pp. 23-40 Discussions ... pp. 41-43 References ... pp. 44-46
Acknowledgments:
For general and technical support and help: Bill Lundberg
Yin Sun
MariCarmen Planas Brian Ellenbaas The Weinberg Lab
For reading this thesis: Eileen Chen
Special thanks to my advisor: Robert Weinberg
THE EFFECT OF ANGIOSTATIN ON THE ENDOTHELIAL CELL CYCLE
by
CHANG-HWA MARY CHEN
Submitted to the Department of Biology on May 29, 1998 in partial fulfillment of
the requirements for the Degree of Master of Science in Biology
ABSTRACT
Angiostatin is an angiogenesis inhibitor that inhibits the growth of primary tumors and induces dormancy of metastases. The method by which angiostatin suppresses tumor formation is based on the model that angiostatin inhibits endothelial cell proliferation, preventing blood vessel formation towards primary tumors and metastases. Without vascularization, tumors die due to the
deprivation of nutrients and oxygen. The mechanism by which angiostatin
inhibits the endothelial cell cycle has not been elucidated. The focus of this thesis is to determine whether angiostatin can arrest the endothelial cell cycle, the cell cycle phase which angiostatin impinges on, and the cell cycle proteins which are affected by angiostatin. Part of this thesis also discusses the isolation of
endostatin, another angiogenesis inhibitor, and testing of endostatin's inhibitory activity.
Thesis Supervisor: Robert A. Weinberg Title: Professor of Biology
Introduction:
Angiogenesis is the growing of new blood vessels from preexisting vessels. New blood vessel formation is important physiologically in wound repair,
development, and reproduction. Angiogenesis also plays important role in tumor formation.
Rapid cancer growth in animals requires the help of host blood vessels. The flow of blood supplies tumors with nutrients and oxygen, removes waste products from tumor sites, and provides gateways for metastatic formation. Tumor growth in the absence of such neovascularization reaches a maximum size of a few
millimeters, while a well vascularized cancerous growth can grow to centimeters in size (Folkman 1989).
One interesting observation is that when patients are treated for cancer by the removal of certain primary tumors such as breast carcinoma and colon
carcinoma, metastatic growths are detected after a couple of weeks (Clark et al., 1989; Woodruff, 1980,1990). In addition, animal studies also show that the removal of primary tumors is often accompanied by rapid tumor growths in distant sites from the removed tumor (Bonfil et al., 1988, Fisher et al., 1983,
1989).
Additional observations on tumor development have led to the current hypothesis that primary tumors secrete both angiogenic and anti-angiogenic factors and that a net balance of these factors determines endothelial cell
proliferation, i.e. angiogenesis (O'Reilly et al. 1994). For example, it was found that basic fibroblast growth factors (bFGF) and vascular endothelial growth factors (VEGF) cause capillary endothelial cells to grow and migrate toward the source of these two angiogenic factors. Conversely, thrombospondin-1, an angiogenic
inhibitor, causes cells to become unresponsive to the mitogenic signals (Good et al. 1990; Rastinjad et al. 1989). Therefore, a primary tumor activates
neovascularization by secreting more angiogenic factors than anti-angiogenic factors, thereby resulting in a higher local concentration of angiogenic stimulant.
Since the half-life of the anti-angiogenic factors is longer than the half-life of the angiogenic factors, the anti-angiogenic factors circulate to the metastases preventing their ability to neovascularize, stunting their growth (Folkman 1995).
Other angiogenic stimulators include acidic fibroblast growth factor, heparin binding epithelial growth factor, tumor necrosis factor-alpha, and angiogenin. In addition to thrombospondin-1, other angiogenic inhibitors, including platelet factor 4, interferon alpha, interferon beta, 16kD prolactin fragment, tissue inhibitors of metalloproteinase, and fumagillin-derivative AGM 1470 (Fidler et al. 1994) have been discovered.
The two most recently discovered anti-angiogenic factors are angiostatin and endostatin. Both were originally isolated in the lab of Judah Folkman.
Angiostatin was first purified as a 38 kdal fragment from the urine of Lewis lung carcinoma -bearing mice. Endostatin was purified as a 20 kdal fragment from the conditioned media of EOMA hemangioendothelioma cells. Sequencing data of angiostatin indicated that angiostatin consists of the first four kringle domains of plasminogen. Endostatin's sequence was shown to be identical to that of the C-terminal domain of collagen 18.
Human prostate carcinoma cells expressed enzymatic activity that converted human plasminogen to angiostatin (Gately et al., 1996). Macrophage-derived metalloelastase was found to generate angiostatin in Lewis lung
carcinoma (Dong et al. 1997).
Sequencing data of angiostatin and endostatin led to the purification of these two proteins by alternative methods. For example, angiostatin was purified from proteolytically cleaved plasminogen (O'Reilly et al. 1994). Recombinant
baculovirus system (Wu et al. 1997). Recombinant endostatin was produced from 293-EBNA cells containing the endostatin expression vector (Hohenester et al. 1998).
The biological function of angiostatin and endostain have also been tested. Both angiostatin and endostatin were found to inhibit endothelial cell proliferation in vitro in a 72-hour proliferation assay with no signs of apoptosis as determined by the number of floating cells (O'Reilly et al. 1994). In addition, angiostatin and endostatin seem to inhibit endothelial cells specifically. Angiostatin's inhibitory activity tested positively against bovine capillary endothelial cells, bovine aortic endothelial cells, and EOMA murine hemangioendothelioma. Angiostatin was not able to inhibit the proliferation of Lewis lung carcinoma, mink lung epithelial cells, mouse 3T3 fibroblasts, and bovine aortic smooth muscle cells. (O'Reilly et al.
1994). Endostatin inhibited only endothelial cells as well, except it was not able to inhibit EOMA hemangioendothelioma cells from which it was originally derived (O'Reilly et al. 1997).
In vivo experiments of angiostatin and endostatin were tested for their abilities to suppress tumor formation. Systemic administration of angiostatin inhibits the growth of primary human and murine tumors in mice. The tumors regressed to microscopic dormant foci (O'Reilly et al. 1996). Cyclic endostatin treatment was applied to mice bearing Lewis lung carcinoma, T241 fibrosarcoma or B16F10 melanoma tumors. Endostatin was applied to the mice until the primary tumor regressed. The regressed tumor was then allowed to regrow to its
original size, and endostatin treatment was resumed. This was repeated until the primary tumor remained dormant (Boehm et al. 1997). No hypothesis has been proposed for such an observation. Both factors, when injected into tumor-bearing mice, were effective in suppressing metastatic growth after the removal of the primary tumor (O'Reilly et al. 1994; O'Reilly et al. 1997).
So far, nothing is known about how angiostatin and endostatin function. Nevertheless, the inhibitory signals generated by angiostatin and endostatin would likely converge on to the cell cycle proteins. The cell cycle proteins regulate
cell cycle progression through its four phases G1, S, G2, and M. The S phase is the DNA synthesis phase. The M phase is the mitotic phase, where cells divide into two. The G1 and G2 phases are gap phases where cells prepare for entry into the S and M phases respectively. The G1 phase is divided into two phases: early/mid G1 and late G1 phase. The restriction point transition occurs in the mid-late G1 phase (Planas-Silva et al. 1997).
In Go (the resting phase) and early G1, the retinoblastoma protein (Rb) is hypophosphorylated. During the onset of G1 and a few hours before the G1 to S-phase transition, cells assess their environment for proliferative versus
nonproliferative signals. Under favorable conditions cells will proceed through the cell cycle and Rb will progressively become more phosphorylated. Rb controls the progression of cells into S phase by its association with the transcription factor E2F. The phosphorylated form of Rb loses its ability to sequester E2F
transcription factors which are important in initiating the synthesis of proteins necessary for cell cycle progression. E2F transactivates a number of genes whose function is necessary for DNA synthesis. This association of Rb to E2F inhibits the transactivation activity of E2F. Thus, when cells receive mitogenic signals, Rb is hyperphosphorylated, releasing E2F, and cells enter into S phase
(Planas-Silva et al. 1997).
The important players involved in the G1 to S-phase transition upstream of Rb are dependent kinase 4/6 (cdk 4/6)-cyclin D complex and
cyclin-dependent kinase 2 (cdk 2)-cyclin E complex. Active cdk 4/6-cyclin D and cdk 2-cyclin E complexes inactivate the retinoblastoma protein through sequential phosphorylation. After passage through the restriction point, Rb becomes fully
phosphorylated and remains in the hyperphosphorylated state throughout the cell cycle. Cyclin E/cdk 2, in conjunction with cyclin A/cdk 2, maintains Rb in the fully phosphorylated state throughout the remaining cell cycle (Sherr 1996)
The catalytic activity of the cyclin-dependent kinases is regulated by protein phosphorylation and association with regulatory subunits, such as the cyclins and the CIP/KIP and INK 4 families of cyclin-dependent kinase inhibitors (Coats et al. 1996). Members of the CIP/KIP family, p21, p27, and p57, inhibit all G1-phase cdk-cyclin complexes. Members of the INK 4 family, p15, p16, p18, p19, inhibit only cdk 4/6-cyclin D complexes (Zavitz et al 1997). p2 7 regulation may be a key step in the pathway that links mitogenic signals to cell cycle
progression. It may also play a critical role in governing the process of cell cycle commitment and passage through the restriction point (Coats et al. 1996).
Because angiostatin and endostatin are very potent and specific in their inhibitory effects on angiogenesis, it will be interesting to determine how these factors prevent endothelial cell proliferation by analyzing the important regulators of the cell cycle machinery. The elucidation of the molecular effects caused by angiostatin and endostatin may be the first step in finding better ways to
terminate cancer in its late stage through the control of angiogenesis. The work in this thesis describes some experiments that begin to address the mechanistic action of angiostatin. Experiments show that angiostatin and endostatin can arrest the endothelial cell cycle and elucidate the cell cycle phase at which angiostatin impinges. The experiments also analyze the cell cycle proteins that are affected by angiostatin. Finally, this thesis discusses attempts to purify endostatin for future cell cycle analyses using endostatin.
Materials and Methods:
Cells:
Plates of passage 9 bovine capillary endothelial cells (BCEC) were kind gifts from Katherine Butterfield, a member of Judah Folkman's Laboratory. BCECs were plated on gelatinized 10-cm dishes, maintained in high glucose DMEM with 10% calf serum/1% pen-strep antibiotics/3 ng/ml bFGF, and kept in a 10% C02, 37C incubator (Folkman et al, 1979). Cells were split at 90% confluency. A minimum of 5 days was allowed between each passage. Passage 9 cells were allowed to expand until passage 11 at which point some cells were frozen down in cryogenic vials for future use. Passages 11-14 cells were used for the experiments.
A plate of 293-endo cells that secrete soluble endostatin (Hohenester et al, 1998) was a kind gift from the lab of Bjorn Olsen. 293-endo cells were maintained in DMEM with 10% fetal calf serum/l1% pen-strep antibiotics/0.5 gg/ml of
puromycin, and kept in a 5% CO2, 37C incubator. 0.5 gg/ml of puromycin was added to the media for cell selection. 293-endo cells were split 1:10 every three days.
Angiostatin:
0.5 ml of 1 ug/ml of angiostatin was obtained from Thomas Boehm a member of Judah Folkman's laboratory. This batch of angiostatin was initially purified from proteolytically cleaved plasminogen by Michael O'Reilly from Judah Folkman's lab.
Synchronizing BCECs:
BCECs were synchronized in Go by serum starvation in high glucose DMEM with 0.5% fetal calf serum/l% pen-strep antibiotics for 48 hours to 54 hours.
Thymidine incorporation of asynchronous cell populations:
Cells were plated onto Falcon 12-well dishes. Cells were allowed to proliferate for 1-2 days to reach 60-80% confluency. Tritiated thymidine was
added at concentrations of 1:1000 to asynchronous cell populations. After 1 hour, thymidine incorporation was stopped by adding 1 M ascorbic acid to a final
concentration of 0.25 M ascorbic acid per sample. Cells were kept overnight in a 4"C refrigerator or in the 37C incubator until further processing. Radioactive medium was aspirated from cells. Cells were then washed once in PBS+ and once in 5% trichloroacetic acid (TCA). 1 ml of 5% TCA was added to each well
containing the cells and the cells were incubated at 4°C for 30 minutes. TCA was aspirated and cells were washed three times with dH20. Cells were incubated in 1 ml of 0.1 M NaOH for five minutes at room temperature. The samples were
transferred to scintillation vials containing 10 mls of scintillation fluid. The amount of tritiated thymidine incorporated into the cells was counted by a scintillation counter.
Thymidine incorporation for synchronized cell population:
Thymidine incorporation was performed by the same method as above, except cells were first synchronized by serum starvation and then cells were
allowed to enter the cell cycle by serum addition. After each desired time points of restimulation, tritiated thymidine was added at concentrations of 1:1000.
SDS/PAGE:
Cell lysates were obtained by lysing cells on 10-cm dishes in 400 jl of 1X loading buffer. 50 gl of cell lysates were loaded per lane. The cell lysates were separated by SDS/PAGE. 12% SDS/PAGE was used to separate angiostatin protein. Coomassie blue staining was used for protein detection.
Western analysis:
Cell lysates were obtained by lysing cells on a 10-cm dish in 400 pl of 1X loading buffer. 50 gl of cell lysates were loaded per lane. The cell lysates were separated on 6%-12% SDS-PAGE. The proteins were transferred onto
nitrocellulose membrane and immunoblotted with specific antibodies as discussed in the text, followed by a horseradish peroxidase-conjugated secondary antibody. The detection was done using the chemiluminescence method.
Isolation of endostatin:
293-endo cells were maintained in DMEM with 10% fetal calf serum/1% pen-strep antibiotics/0.5 gg/ml of puromycin. Cells were then transferred to DMEM with 10% fetal calf/15 pen-strep serum for 24 hours and allowed to reach confluency. PBS+ was used to rinse cells twice before incubating the cells in serum-free DMEM/1% pen-strep. Conditioned media were collected after 48 hours. Cell debris was removed by centrifugation. The remaining supernatant was then added to a heparin sepharose CL-6B column purchased from Pharmacia Biotechnology. The heparin sepharose column was initially equilibrated in 50 mM NaC1 + 10 mM Tris-HC1 pH 7.4. Flow through was collected for further analysis. Equilibration buffer was used to wash the column. Proteins were eluted by step gradients from 50 mM NaCl to 2 M NaC1. The following eluted fractions at the indicated salt concentrations were collected: 0.2 M NaC1, 0.4 M NaC1, 0.6 M NaC1,
0.8 M NaC1, 1.0 M NaC1, 1.5 M NaC1, and 2.0 M NaC1. Before applying endostatin to cells, heparin sepharose column purified endostatin was dialyzed against PBS-and concentrated using centriplus 10 purchased from Amicon. The endostatin eluted was determined by running column fractions on a SDS/PAGE.
Results:
Analysis of angiostatin identity:
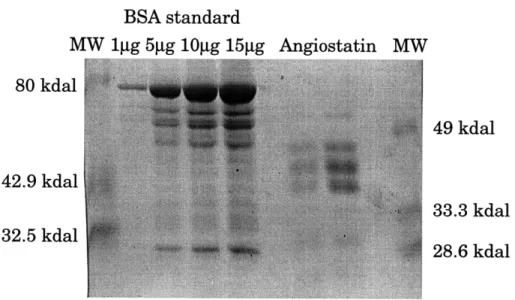
Purified angiostatin from Judah Folkman's lab was analyzed by SDS/PAGE using Coomassie blue staining for protein detection. Angiostatin protein ran as three major bands between 33.3 kdal and 49 kdal (Figure 1). The migration of these three bands was similar to the migration of reported angiostatin, where the bands ran at 40 kdal, 42.5 kdal, and 45 kdal (O'Reilly et al, 1994). This suggests that the inhibitory factor used is most likely angiostatin. In addition, a western immunoblot analysis using a plasminogen antibody against angiostatin showed
the same three bands migrating around 42.9 kdal (Figure 2).
To further confirm the identity of the angiostatin used, another experiment would have been to test the specificity of angiostatin on other cell lines. Because
of the limited amount of active angiostatin available, the bovine smooth muscle cells from Joyce Bishoffs lab and other cell types were not tested for growth inhibition by angiostatin.
Synchronizing bovine capillary endothelial cells (BCECs) and analyzing BCEC cell cycle:
BCECs were tested for arrest in Go by serum starvation. Cells were first starved for 51 hours either in the presence of 0.5% calf serum or 0.5% fetal calf serum. Starved cells were then serum restimulated by calf serum, bFGF, or a combination of calf serum and bFGF. Uptake of tritiated thymidine was used to assay for DNA synthesis. Results showed that cells starved in 0.5% fetal calf serum had a higher level of induction during serum restimulation than cells starved in 0.5% calf serum (Data not shown). The ability to synchronize BCEC was essential for analysis of angiostatin-induced cell cycle effects.
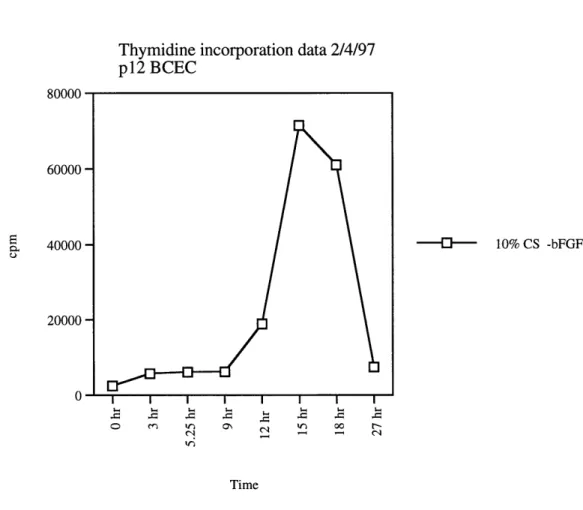
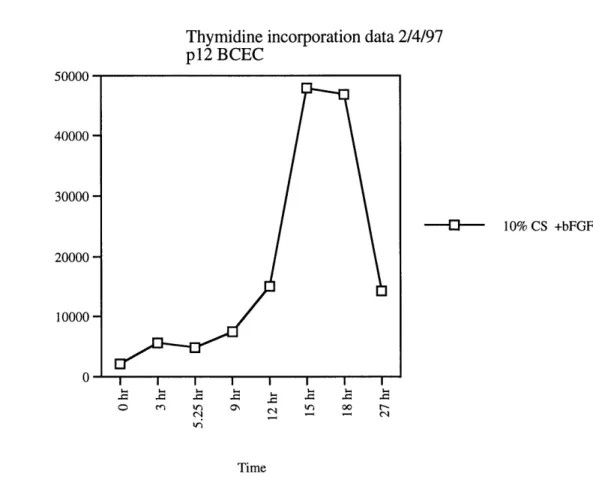
After 51 hours of serum deprivation, a majority of cells were quiescent and DNA synthesis began after 12 hours of serum restimulation. (Figure 3 and 4).
The difference in the induction of DNA synthesis by 10% calf serum alone or 10% calf serum + 3 ng/ml of bFGF seemed minimal, both being an almost 20-fold induction (Figure 3 and 4). In addition, it was found that just 1 ng/ml of bFGF alone could restimulate cells into DNA synthesis (data not shown). Most
experiments testing the ability of 3 ng/ml of bFGF and 10% calf serum to induce cells into DNA synthesis showed an average of a 15-fold induction (data not shown). Both bFGF and VEGF have been described as mitogenic factors for endothelial cells. Because VEGF is a specific mitogen for endothelial cells, VEGF was also tested for its ability to induce DNA synthesis in synchronized BCECs.
The result showed a 6-fold induction of DNA synthesis by 5 ng/ml of VEGF, indicating that VEGF is much weaker than bFGF in inducing DNA synthesis (Data not shown). Consequently, bFGF and 10% calf serum were chosen to induce cells into the cell cycle for subsequent future cell cycle studies on the effect of angiostatin on BCECs.
The effect of angiostatin on asynchronously growing BCECs:
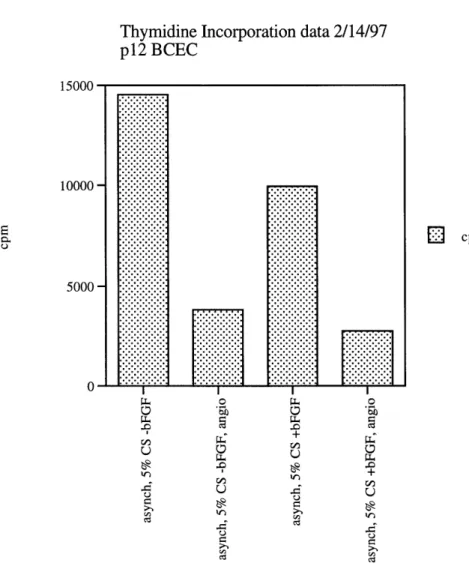
Angiostatin's ability to inhibit BCEC proliferation was tested on asynchronously growing BCECs through a thymidine incorporation assay.
Asynchronously growing BCECs were allowed to proliferate to 60-70% confluency in 5% calf serum or 5% calf serum + 1 ng/ml of bFGF, adding 500 ng/ml of
angiostatin to half the samples. After 30 hours, tritiated thymidine was added to the cells for 1 hour. A scintillation counter was used to determine thymidine uptake amounts. Angiostatin suppressed DNA synthesis by approximately 3.75-fold under both conditions, where cells were either in calf serum alone or calf serum and bFGF (Figure 5).
Determining media conditions in which angiostatin inhibits BCEC most effectively:
Two variables, hours of angiostatin pretreatment and angiostatin dosage effects, were assessed to determine if angiostatin could be more effective in inhibiting BCEC DNA synthesis. bFGF was used to restimulate serum-starved cells into DNA synthesis. Two different concentrations of bFGF, 1 ng/ml and 3 ng/ml, were evaluated for their ability to induce serum-starved cells into DNA synthesis. 3 ng/ml of bFGF was not any more effective than 1 ng/ml of bFGF in inducing cells into DNA synthesis (Figure 6, columns 2 and 3). Determining the least amount of bFGF needed to induce cells into optimal DNA synthesis was
important because angiostatin's ability to inhibit BCEC may be correlated with the amount of angiogenic factor used.
BCECs were then tested to determine whether pretreatment with
angiostatin versus no pretreatment with angiostatin prior to adding stimulating factors would enhance angiostatin's ability to inhibit cells. Cells starved for 42 hours were pretreated with angiostatin for 0 hours, 7 hours, 18 hours, and 26 hours prior to bFGF stimulation. The intent was to use 1 ng/ml of bFGF + 500
ng/ml of angiostatin in the first set, 3 ng/ml of bFGF + 500 ng/ml of angiostatin in
the second set, and 1 ng/ml of bFGF + 5 pg/ml of angiostatin in the third set of time
course experiments. However, miscalculation led to the use of 0.3 ng/ml of bFGF for the first two time points (0 hour and 7 hours) in each of the three sets of experiments. Cells that had been pretreated with angiostatin for at least 7 hours showed a 0.3-0.4 fold greater inhibition than cells that were not pretreated with angiostatin prior to restimulation. Cells pretreated with angiostatin for 7 hours,
18 hours, and 26 hours showed similar amounts of inhibition. Because the
amount of bFGF used for the 18 hour and 26 hour time points were 3-10 times greater than that used for the 7 hour time point, the effects of pretreatment of
angiostatin for 18 and 26 hours may be more pronounced. The amount of inhibition of angiostatin pretreated cells for 26 hours was similar to that of cells
angiostatin pretreated for 18 hours. (Figure 6). Later experiments showed that 6 hours of angiostatin pretreatment was sufficient to create a 0.3-0.4 fold cell inhibit
over cells that were not pretreated in angiostatin (Figure not shown).
Pretreatment of cells in angiostatin for less than 6 hours was not assessed. In addition, the 5 gg/ml of angiostatin tested in the pretreatment experiment versus the 500 ng/ml of angiostatin did not noticeably inhibit the cells further in these sets of experiments (Figure 6).
The optimal concentration of angiostatin in inhibiting BCEC was further assessed without prior pretreatment of the cells in angiostatin. 3 ng/ml of bFGF +
500 ng/ml, 1 gg/ml, 2 gg/ml, and 5 gg/ml of angiostatin were added to serum-starved cells. After 18 hours, thymidine incorporation was assessed for DNA synthesis. 1 gg/ml of angiostatin inhibited BCECs 0.25 fold more than 500 ng/ml of angiostatin. Concentrations of up to 5 gg/ml of angiostatin did not inhibit the BCECs more effectively than 1 gg/ml of angiostatin (Figure 7). Comparison to the results from figure 6 indicated that pretreating the cells for at least 6 hours in angiostatin was much more effective than simply increasing angiostatin
concentrations. The above result is consistent with the pretreatment experiment mentioned earlier; cells first pretreated with angiostatin for 6 hours do not show increased inhibition when concentrations jump from 500 ng/ml to 5 gg/ml of angiostatin.
Determining the optimal cell-matrix interactions for angiostatin's inhibitory activity on BCECs:
Cell-matrix interaction plays an important role in cell cycle progression. Establishing the right combination of cell-matrix interation was crucial to
developing a good assay system under which the inhibitory effect of angiostatin on BCECs would be tested. For all the experiments, gelatinized plates were used to grow BCECs. When cells were tested for growth on nongelatinized plates, BCECs
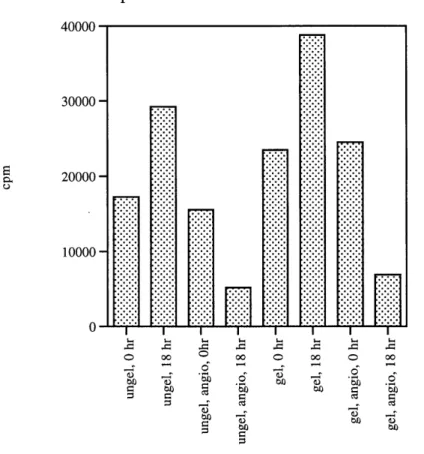
grew normally. The extent to which angiostatin inhibited BCECs growth on gelatinized versus ungelatinized plates was tested. Cells starved for 42 hours in 0.5% fetal calf serum were pretreated for 6 hours. 1 ng/ml of bFGF was used to restimulate the cells. After 18 hours of restimulation, cells were assayed for thymidine uptake. Controls included cells not treated with angiostatin and starved cells without bFGF restimulation. Results show that cells grown on gelatinized plates incorporated 0.4 times more thymidine than cells grown on ungelatinized plates. The amount of inhibition by angiostatin on gelatinized plates and ungelatinized plates was similar (Figure 8).
Joyce Bishoff's lab hypothesized that certain serum factors may be
involved in angiostatin signaling and that cells grown on serum coated plates may enhance angiostatin's inhibitory activity. To test this hypothesis, BCECs were seeded on gelatinized plates coated with calf serum. Cells were allowed to
proliferate to 60-70% confluency. Cells were then synchronized by serum
starvation, pretreated with angiostatin for 6 hours, and restimulated with 1 ng/ml of bFGF. Cells untreated with angiostatin were used as a control. After
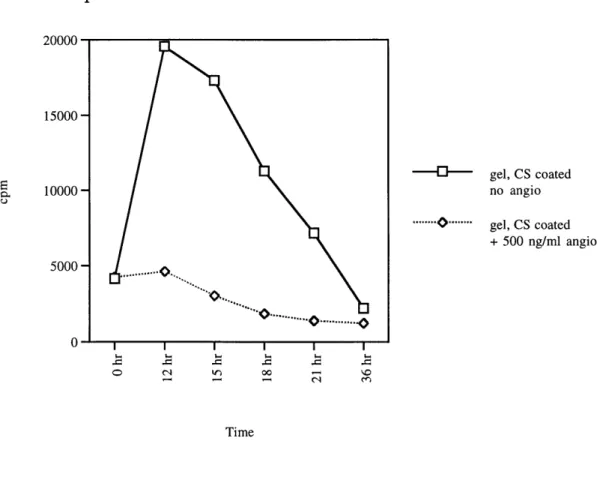
restimulation by bFGF, thymidine incorporation by cells was assessed three hours. In angiostatin-treated cells, thymidine uptake after 12 hours of serum restimulation was only 1.1 times above the 0 hour time point (Figure 9). Cells on non-calf serum-coated plates showed a thymidine uptake of 1.3 times above the 0 hour time point (Data not shown). The difference in the ability of angiostatin to suppress thymidine uptake in BCECs between calf serum-coated versus
uncoated plates was minimal. Therefore, all experiments were performed with cells on gelatinized, non-calf serum-coated plates. More importantly, the
combination of starving the cells in 0.5% fetal calf serum, pretreating the cells for 6 hours with angiostatin, and growing the cells on gelatinized plates showed that
angiostatin was able to suppress DNA synthesis by approximately 80% (Figure
9). The conditions established at which angiostatin can successfully inhibit DNA synthesis is crucial to further decipher how angiostatin is able to arrest cells. Testing antibody specificity against BCEC's cell cycle proteins:
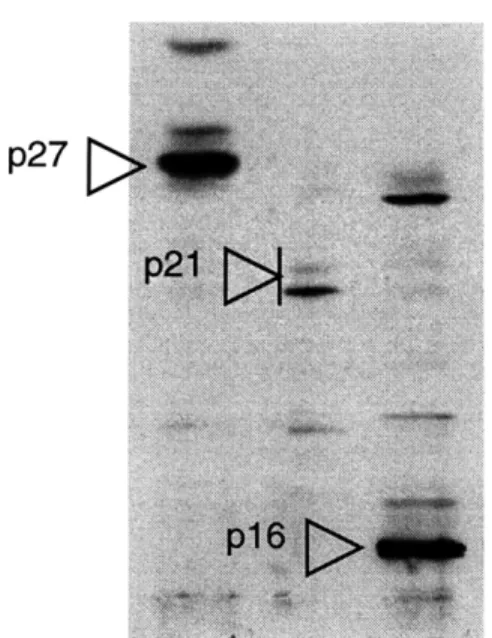
Most commercially available antibodies specific for cell cycle proteins are made against human or mouse proteins. Although cell cycle proteins are well conserved among species, it was necessary to test whether the available cell cycle antibodies could recognize bovine cell cycle proteins. Cell lysates obtained from asynchronously growing BCECs were loaded onto an SDS/PAGE. A western blot was performed to test antibody specificity against BCEC cell lysates. Antibodies
that reacted against the BCEC cell cycle proteins included Rb (anti-human Rb from PharMingen), cyclin E (M20 and C19 from Santa Cruz), cyclin D1 (DCS-6 from Neomarker), cyclin D2 (M20 from Santa Cruz), cyclin D3 (C-16 from Santa Cruz), p16 (C20 from Santa Cruz), p21 (C19 from Santa Cruz), and p27 (C19 from Santa Cruz) (Figure 10, not including Rb and cyclin E). Other cell cycle proteins have not been carefully tested. 3T3 cell lysates were used as a control for antibody detection. Cyclin D1, D2, and D3 were reported to migrate through the SDS/PAGE with slightly different mobilities -cyclin D1 migrating the slowest and cyclin D3 the fastest (Vallance et al. 1994). The detection of the relative
migration of the cyclin D1-D3 confirmed their identity as cyclin D proteins (Figure 10).
Angiostatin affects the G1 phase of the cell cycle:
Thymidine incorporation assay showed that angiostatin can arrest the cell cycle as shown by the inhibition of DNA synthesis. To determine whether
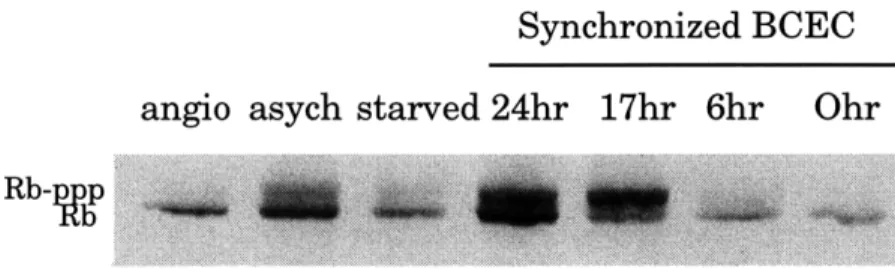
angiostatin inhibits cells in the G1 phase, Rb phosphorylation was assessed in asynchronously growing cells treated with angiostatin. Angiostatin added to asynchronously growing cells for 30 hours was able to cause Rb to be
used as controls for the migration of hyperphosphorylated Rb (p112-p114) and hypophosphorylated Rb (p110) respectively. (Figure 11). Serum restimulated synchonized BCECs were used as additional controls to show that Rb becomes progressively phosphorylated as cells enter the S phase. At 0 hour and 6 hours, Rb is hypophosphorylated. As cells enter the S phase at approximately 12 hours, Rb is hyperphosphorylated, as observed at the 17 hour and 24 hour time points. (Figure 11).
The effect of angiostatin on Rb phosphorylation of synchronized BCEC:
BCEC was serum starved for 48 hours. 500 ng/ml of angiostatin was used to pretreat cells for 6 hours. Untreated cells were used as controls. All the cells were restimulated with 3 ng/ml of bFGF. Total cell lysates were isolated at 0 hours, 6 hours, and 15 hours after restimulation. The lysates were then ran in 6% SDS/PAGE and analyzed by western analysis for Rb. In control cells, Rb
remained in the hypophosphorylated state for time points 0 and 6 hours and became hyperphosphorylated at time point 15 hours. In angiostatin-treated cells, Rb remained in the hypophosphorylated state for all three time points tested, indicating that angiostatin arrests cell proliferation in the G1 phase of the cell cycle (Figure 12).
Analyzing the effect of angiostatin on cyclin E protein level:
Rb is sequentially phosphorylated by cdk 4/6-cyclin D and then by cdk 2-cyclin E. Cyclin E levels were assessed to determine if they were altered by angiostatin, thereby causing Rb to be hypophosphorylated. 200 ng/ml of
angiostatin added to asynchronously growing cells for 30 hours decreased cyclin E protein level (Figure 11). Asynchronously growing BCEC and starved BCEC were used as controls for the level of cyclin E protein. Synchonized BCECs that were serum restimulated were used as an additional control to show that cyclin E expression increases as cells enter the S phase (Figure 11).
The effect of angiostatin on cyclin E levels of synchronized BCEC:
Passage 11 BCEC were serum starved for 44 hours. 500 ng/ml of
angiostatin was used to pretreat cells for 6 hours. Untreated cells were used as controls. All the cells were restimulated with 10% calf serum and 3 ng/ml of bFGF. Total cell lysates were isolated at 0, 3, 8, and 18 hours after stimulation. The lysates were run in 10% SDS/PAGE and analyzed by western analysis for cyclin E. Cyclin E levels remained low for all time points in angiostatin-treated cells. In control cells however, cyclin E levels increased dramatically at 3 hours and
remained elevated until 18 hours (Figure 14).
Analyzing different concentrations of angiostatin on the levels of cyclin E proteins and Rb phosphorylation states:
To further confirm the results obtained for Rb and cyclin E, two
concentrations of angiostatin were used to assess if varying angiostatin amounts would alter Rb phosphorylation states and cyclin E protein levels. Cells starved for 30 hours and asynchronously growing cells were used as controls. 200 ng/ml of angiostatin was not as effective as 500 ng/ml of angiostatin in keeping Rb in the hypophosphorylated state after 30 hours of treatment. Similarly, the cyclin E protein level was slightly higher in cells treated with 200 ng/ml of angiostatin than in cells treated with 500 ng/ml of angiostatin (Figure 15).
Analyzing the effect of angiostatin on cyclin D1, D2, and D3 protein levels: Cyclin D proteins have been reported to be one of the factors directly involved in phosphorylating Rb (Ewen et al. 1993). Because angiostatin caused the Rb proteins in BCECs to remain in the hypophosphorylated state, it was necessary to determine angiostatin's effect on factors that influence Rb phosphorylation.
The effect angiostatin exerted on cyclin D1, D2, and D3 protein levels were analyzed by western blot. Passage 11 BCECs were treated with 500 ng/ml of
angiostatin for 6 hours prior to 3 ng/ml of bFGF restimulation. BCECs untreated with angiostatin were used as controls. Lysates were collected after 0, 6, and 15 hours of restimulation. Angiostatin seemed to have no effect on the protein levels of cyclin D2 (Figure 16), whereas cyclin D3 protein levels seemed to decrease in angiostatin-treated cells at 6 and 15 hours (Figure 17).
No data on cyclin D1 have been obtained because of the difficulty in consistent detection of cyclin D1. Data obtained for cyclin D2 and D3 should be repeated to confirm the obtained results.
Isolating endostatin from endostatin-producing 293 cells:
Endostatin is another angiogenesis inhibitor that was discovered in Judah Folkman's laboratory. Because endostatin had been found to be more potent than angiostatin in suppressing tumor formation (O'Reilly et al. 1997), the effect of endostatin on endothelial cell proliferation was analyzed.
The endostatin used for this work was isolated from endostatin-producing 293 cells (293-endo). 293-endo was allowed to proliferate in 10% fetal calf serum +
5 gg/ml puromycin. Once confluent, the cells were transferred to 10% fetal calf serum for 24 hours, rinsed twice in PBS+, and transferred to conditioned media (0% fetal calf serum in DMEM). After 48 hours, the conditioned media was
collected, centrifuged, and a supernatant sample was run on a gel. Non-endostatin producing 293 (phe-nx) cells were used as a control. 293-endo cells that were not grown in 10% fetal calf serum in the absence of puromycin for 24 hours produced less of the 20 kdal putative endostatin band, possibly because 293-endo cells were not completely resistant to puromycin's inhibitory effect on protein translation (Figure 18). Conditioned media from 293 (phe-nx) cells did not appear to contain endostatin. Antibodies against endostatin were not yet commercially available for testing the validity of the observed 20 kdal band as endostatin. Microsequencing was another alternative to verifying that the 20 kdal band was endostatin.
Purification of endostatin by heparin sepharose column:
Conditioned media from 293-endo was used to purify endostatin by heparin sepharose column. Purification methods were discussed in the Materials and Methods section. Three separate purification procedures were done on three independent batches of 1 liter conditioned media: 3/13-3/15 batch, 3/25-3/27
batch, and 4/3-4/5 batch. Endostatin from the 3/13-3/15 batch eluted in the 0.6 M and 0.8 M NaCi fraction (Figure 19). Endostatin from the 3/25-3/27 batch eluted largely in the second 0.4 M and 0.6 M NaCi fraction, and some in the 0.8 M NaCi fraction (Figure not shown). Endostatin from the 4/3-4/5 batch eluted largely in the 0.6 M NaCl fraction and partially in the 0.8 M NaC1 fraction (Figure not shown).
Testing the activity of endostatin:
The ability of endostatin to inhibit cell proliferation was tested by thymidine incorporation assay. BCECs were starved for 48 hours. Purified endostatin, conditioned 293-endo cell media, and angiostatin were used to pretreat cells for 6 hours. Untreated cells were used as a positive control for DNA synthesis while angiostatin-treated cells were used as a negative control for DNA synthesis. Starved cells were restimulated with 10% calf serum, measuring thymidine
incorporation at specific time points. Cells initiated DNA synthesis after 12 hours of serum restimulation. Purified endostatin was unable to inhibit DNA synthesis, whereas conditioned media were able to inhibit DNA synthesis by 4-fold.
Angiostatin was able to inhibit DNA synthesis by 8-fold. All samples indicated a decline in thymidine uptake between 0 to 6 hours. (Figure 20). One possible explanation may be that this cell batch required more than 48 hours of starvation time to reach quiescence. Cells that were in 10% serum only exhibited similar decline in thymidine uptake between 0 to 6 hours.
Because endostatin was purified from three different batches of conditioned media and eluted from various NaC1 fractions, it was necessary to test whether any of the batches and fractions yielded active endostatin. It may be possible that different NaCi fractions elute different factors besides endostatin, muting the effect of endostatin. The result of the inhibitory effect shown by 293-endo
conditioned media need to be compared with a control to show that conditioned media from 293 cells would not inhibit BCEC.
BSA standard MW 1gg 5gg 10gjg 15gg Angiostatin 80 kdal 42.9 kdal 32.5 kdal MW 49 kdal 33.3 kdal 28.6 kdal
Figure 1: Angiostatin protein analysis by coomassie blue staining. Angiostatin protein was run on 10% SDS/PAGE. BSA protein was used as a control for protein concentration.
Angiostatin appears to constitute three major bands running between 49 kdal and 33.3 kdal.
80 kdal
42.9 kdal
ngiostatin
Figure 2: Angiostatin protein analysis by western blot.
1 gg of angiostatin was loaded onto 10% SDS/PAGE. Plasminogen antibody (Enzyme Research Labs, Human Ab-10-V-1) was used to detect angiostatin.
Thymidine incorporation data 2/4/97 p12 BCEC 80000 60000-40000 -20000 O I I I ~ L o ec~ ') O\ , o If c 10% CS -bFGF Time
Figure 3: Analyzing DNA synthesis of BCEC by thymidine incorporation. Passage 12 BCECs were plated on gelatinized 12-well dish. Cells were starved for 51 hours and then restimulated with 10% CS in the absence of bFGF. Thymidine incorporation was evaluated at the indicated time points.
Thymidine incorporation data 2/4/97 p12 BCEC 50000 40000 30000 20000 -10000 -0 -10% CS +bFGF Time
Figure 4: Analyzing DNA synthesis of BCEC by thymidine incorporation. Passage 12 BCECs were plated on gelatinized 12-well dish. Cells were starved for 51 hours and then restimulated with 10% CS in the presence of 3 ng/ml of bFGF. Thymidine incorporation was evaluated at the indicated time points.
I I I I I I I I
",ci - c- i
M kl n (7) tn 00
C\ i C
Thymidine Incorporation data 2/14/97 p12 BCEC 15000 10000 5000 0 E cpm .3 ct MOM 0 0~ 0 0L -U U Q -c U 0 Q vl ~ -n 0 0d
Figure 5: Angiostatin's effect on asynchronously growing BCECs. Asynchronously growing BCEC were assessed for thymidine
incorporation after 27 hrs of treatment under the indicated conditions on the horizontal axis. Compare cells in the presence of 5% CS (+/- 1 ng/ml bFGF) with and without 500 ng/ml angiostatin.
Thymidine incorporation data 5/28/97 p12 BCEC 25000 20000-
i
]
15000 -1 10000 - 5000-I I -E D 00b 00 00 \0 0 ~0 II~ 0 to 0 to~t o o 0r 000 =0 - M vn M0 I I VS -~ -D o [J. Gb 00 " -sd I I -= --00 11Cq\ tba - (1 + + 00 CE E l cpmFigure 6: The effect of pretreating cells in angisotatin prior to restimulation. Passage 12 BCECs were starved for 48 hours. Thymidine incorporation was assessed for cells treated under the indicated conditions for 18 hours. The first column shows cells starved for 48 hours before assessing for thymidine
incorporation. The second and third columns show cells that have been treated with 1 ng/ml or 3 ng/ml of bFGF respectively for 18 hours prior to thymidine incorporation. The remaining columns show the concentration of bFGF that was added to cells and the concentration of angiostatin and hours of angiostatin pretreatment before adding bFGF.
fll::
::
.-Thymidine incorporation data 5/28/97 p12 BCEC 25000 20000- -15000 10000 5000-EI cpm
Figure 7: Determining the minimal amount of angiostatin needed to achieve the best inhibition. Passage 12 BCECs were starved for 48 hours. Thymidine incorporation was assessed with cells under the indicated conditions for 18 hours, except for the starved cells. The first two columns are controls. The first column shows cells starved for 48 hrs before assessing for thymidine incorporation. The second column shows cells that have been treated with 3 ng/ml of bFGF for 18 hours prior to thymidine incorporation. The remaining columns show the concentration of bFGF and angiostatin that was
simultaneously added to cells.
Thymidine incorporation data 7/15/97 p11 BCEC 4 00 0 0 30000 -20000 10000 -0
Figure 8: Comparing the effect of ungelatinized (ungel) and gelatinized (gel) plates in angiostatin treated and untreated cells. Passage 11 BCECs were either seeded onto ungelatinized 12-well plates or
gelatinized 12-well plates. Cells were starved for 48 hours in 0.5% fetal calf serum. Samples labelled angio were pretreated with 500 gg/ml of angiostatin for 6 hours prior to restimulation by 1 ng/ml of bFGF for the indicated time points (0- hour or 18-hour).
...::: ...., :: ... .. .°-, -.- . ... .. * .....
... ... ....'.'.".
.,,. . ,,,. , -... .. .. .
,-. , . .
.ii!
., ..iii!
.ii!
-.....
.. .....
....
. ... .... ... .. . . .Thymidine incorporation data 7/30/97 pl1 BCEC -gel, CS coated no angio ... ... gel, CS coated + 500 ng/ml angio o (\1 00 -3 3 ci Time
Figure 9: Comparison of the effect angiostatin activity of calf serum coated to plates that were not calf serum coated. All plates were gelatinized. Passage 11 BCECs were starved for 51 hours in 0.5% fetal calf serum. Angiostatin treated cells were pretreated for 6 hours in 500 ng/ml of angiostatin prior to restimulation by 1 ng/ml of bFGF.
20000
15000
10000
5000
p12 BCEC Cyclin D3 BCE 3T3 p27 p13 BCEC Cyclin D2 BCE 3T3 Cyclin D1 BCE 3T3
Figure 10: Testing of antibody specificity for BCEC.
Asynchronously growing p12 and p13 BCECs were lysed and loaded onto 10% SDS/PAGE. 3T3 cell lysates served as a control for cyclin detection.
Antibodies tested were as follows: p27 antibody (C19 from Santa Cruz), p21 antibody (C19 from Santa Cruz), p16 antibody (C20 from Santa Cruz), cyclin D1 (DCS-6 from Neomarker), cyclin D2 (M20 from Santa Cruz), and cyclin D3 (C-16 from Santa Cruz).
Rb protein phosphorylation analysis
Synchronized BCEC angio asych starved 24hr 17hr 6hr
Figure 11: The effect of angiostatin on Rb phosphorylation in asynchonously growing BCEC. In lanes 0 hr to 24 hr, Passage 11 BCECs were starved for 48 hours and then restimulated with 10% CS + 3 ng/ml bFGF. The starved lane is equivalent to the 0 hour lane. The asych lane indicates cells that were growing asynchronously before lysing. The angio lane contains cell lysates from asynchronously growing cells that was treated with 200 ng/ml of
angiostatin for 30 hours. Antibody used to detect Rb was anti-human Rb from PharMingen.
Rb-pp
Angiostatin treated 15hr 6hr Ohr
Untreated control 15hr 6hr Ohr
Figure 12: The effect of angiostatin on Rb phosphorylation with time. Passage 11 BCECs were starved in 0.5% fetal calf serum for 46 hours.
500 ng/ml of angiostatin treated cells were pretreated for 6 hours prior to restimulation with 3 ng/ml of bFGF for the indicated time points. Control cells were restimulated with 3 ng/ml of bFGF for the indicated time points. Lysates were isolated from the cells and loaded onto 6% SDS/PAGE. Rb was detected with anti-human Rb from PharMingen. These lysates were used to generate this data and the data for cyclin D2
and D3 detection in Figures 16 and 17.
Rb-ppp Rb
Cyclin E protein analysis
Synchronized BCEC angio asych starved 24hr 17hr 6hr Ohr
Figure 13: The effect of angiostatin on cyclin E protein level.
In lanes 0 hour to 24 hours, lysates were from cells starved for 48 hours and then restimulated with 10% CS + 3 ng/ml bFGF. The starved lane is
equivalent to the 0 hr lane. The asych lane indicates cells that were growing asynchrously before lysing. The angio lane contains cell lysates from
asynchrously growing cells that was treated with 200 ng/ml of angiostatin for 30 hours. Lysates obtained for this experiment is the same as that from Figure 11. Lysates were loaded onto 10% SDS/PAGE and cyclin E proteins were detected with C19 cyclin E antibody from Santa Cruz.
Cyclin E protein analysis
Angiostatin treated Untreated control
Figure 14: Cyclin E protein analysis at various time points after restimulation with 10% CS + 3ng/ml bFGF. Cell lysates were prepared from passage 11 BCECs that were starved for 44 hours and then restimulated for the various lengths of time indicated. Angiostatin treated cells were pretreated with 500 ng/ml of
angiostatin for 6 hours prior to restimulation. Lysates were loaded onto 10% SDS/PAGE and cyclin E protein was detected with C19 anti-cyclin E from Santa Cruz.
Rb and Cyclin E protein analysis
Cyclin E levels Rb phosphorylation
CA 0 cr3
0 0o
OSL o
5
-PPP Cyclin EFigure 15: The effect of increasing concentrations of angiostatin on the level of cyclin E and Rb phosphorylation. Protein lysates for starved lane were prepared from cells starved in 0.5% fetal calf serum for 30 hours. Other protein lysates were prepared from asynchronously growing cells, some of which were treated with either 200 ng/ml or 500 ng/ml of angiostatin. Cell lysates were loaded onto a 6% SDS/PAGE. Western analyses were used to detect proteins. Santa Cruz C19 cyclin
E antibody was used to detect cyclin E. PharMingen Rb antibody was used to detect Rb.
Angiostatin treated
1lhr 6hr Ohr 15hr 6hr Ohr
Cyclin D2
Figure 16: The effect of angiostatin on cyclin D2 protein expression. The lysates used to analyze cyclin D2 were the same lysates as that in Figure 12 and cyclin D3 below. Passage 11 BCECs were treated or untreated with 500 ng/ml of angiostatin for 6 hours prior to 3 ng/ml of bFGF restimulation for the time period indicated. Cell lysates were collected and ran on a 10% SDS/PAGE. Cyclin D2 antibody (M20 from Santa Cruz) was used to detect cyclin D2.
Angiostatin treated
15hr 6hr Ohr 15hr 6hr Ohr
Figure 17: The effect of angiostatin on cyclin D3 protein level. Same lysates as that of Figure 16. Cyclin D3 antibody (C16 from Santa Cruz) was used to detect cyclin D3.
Phe-nx 293-endo 293-endo c (R,P) c (R) c (R,P) 80 kdal
28.6 kdal
4
4k
EndostatinFigure 18: Analysis of the ability of 293-endo cells to produce endostatin. Pheonix cells served as a control for the non-production of endostatin. 293-endo were grown in 10% fetal calf serum (+) 5 gg/ml of puromycin until confluent. The 293-endo c(R) lane shows cells that were rinsed with PBS+ before incubating for 48 hours in conditioned media (0% fetal calf serum).
The 293-endo c (R,P) lane shows cells that were first grown in 10% (-)
puromycin for 24 hours before rinsing the cells with PBS+ and incubating the cells for 48 hours in conditioned media (0% fetal calf serum).
Conditioned media were collected, centrifuged to remove cell debris, and concentrated with centricon 10. 50 jgg of proteins were loaded in each lane on a 12% gel.
NaCI concentration used
MW P.C. F.T. 50mM 0.2M 0.4M 0.6M 0.8M 1.OM 1.5M
80 kdal
32.5 kdal
18.6 kdal
Figure 19: Purification of endostatin from 3/13-3/15 batch of conditioned media from 293-endo cells. Pre-column (P.C.) was the conditioned media before heparin sepharose column purification. Flow-through (F.T.) was the supernatant that passed through the column when the conditioned media was added to the column. Eluted fractions were collected at the indicated salt concentrations.
Thymidine incorporation data 5/3/98 p13 BCEC 5000 4000-
4
\ I 3000 - \ I I I I I I I - Cl Cl i S10% serum only O ... 10% serum + angio ---- 10% serum + endo -- E - -- 10% serum + condi E TimeFigure 20: The ability of purified endostatin and conditioned media from 293-endo cells to inhibit DNA synthesis. Passage 13 BCECs were
starved for 48 hours in 0.5% fetal calf serum and restimulated using 10% calf serum only. Angiostatin, endostatin, and 293-endo conditioned media treated cells were first pretreated with 500 ng/ml of angiostatin, 2 gg/ml heparin-sepharose purified endostatin, and 100 gl of 293-endo conditioned media, respectively, for 6 hours and then restimulated with 10% calf serum.
2000
-
0-Discussion:
The results from these experiments show that angiostatin was able to inhibit bovine endothelial cell proliferation as determined by thymidine
incorporation. The optimal conditions found in working with bovine capillary endothelial cells (BCEC) were to plate the bovine capillary endothelial cells on gelatizined, calf-serum coated plates. BCECs were synchronized by serum
starvation in 0.5% fetal calf serum and restimulated into DNA synthesis either by 1-3 ng/ml bFGF or 5-10% calf serum. Although the thymidine incorporation data in Figure 3 and 4 showed an approximate 20-fold induction in DNA synthesis after restimulation, in most cases 10-fold induction was commonly reproduced. The difference in the extent fold induction of DNA synthesis may be due to the different batches of BCEC or the possible use of fetal calf serum instead of calf serum in generating the data for Figure 3 and 4. Cells were more effectively inhibited by angiostatin if the cells were pretreated with angiostatin for 6 hours prior to serum restimulation. 1 gg/ml of angiostatin seemed to be the optimal concentration of angiostatin for the experiments. Concentrations higher than 1 gg/ml and less than 5 gg/ml of angiostatin did not yield better results. Because active angiostatin supply was greatly limiting, 500 ng/ml of angiostatin was used for most of the experiments.
The concentration of angiostatin used in these experiments was measured by members in Judah Folkman's laboratory as 1 gg/ml. When the concentration of angiostatin was remeasured, it was found to be 750 ng/ml. 1 gg/l of BSA obtained from two different sources were used as standards. Note that the concentrations reported in these experiments were calculated based on the assumption that the angiostatin stock concentration was 1 gg/ml.
Angiostatin seemed to affect the G1 phase of the cell cycle as determined by western analysis of Rb phosphorylation. Lysates from asynchronously
growing BCEC treated with angiostatin for 30 hours were ran on SDS/PAGE and probed by antibody against Rb. Only the hypophosphorylated form (p110) of Rb was detected, indicating that the cells have halted in the G1 phase.
Other cell cycle proteins were analyzed as well. Western analysis results were successfully obtained for cyclin D2, cyclin D3 and cyclin E. Cyclin E protein levels were lower in cells treated with angiostatin. Cyclin D3 levels appear to have declined as well in cells treated with angiostain, though not as dramatically as cyclin E levels. Cyclin D2 levels appear to remain constant. Although cyclin D1 had been difficult to detect in endothelial cells, DCS-6 antibody from Neomarker was able to detect cyclin D1 in BCECs.
Because cyclin E levels were noticeable reduced from angiostatin-treated cells, it would be interesting to test whether overexpression of cyclin E by
transfection could overcome angiostatin's inhibitory effect on endothelial cells. If overexpression of cyclin E could overcome angiostatin's inhibitory effect, this would lend more proof that cyclin E may be in the pathway by which angiostatin inhibits cell cycle growth.
Further analysis of the effect angiostatin have on the cell cycle proteins need to be evaluated. The cdk 2, 4, and 6 levels need to be determined, as well as those of the cdk inhibitors, such as p15, p16, p21, and p27. Furthermore, cdk-cyclin complexes need to be assessed for activity by kinase assays. Once all the major cell cycle proteins have been determined, it would be necessary to see how angiostatin affects the cell cycle genes at the transcriptional level.
Transcriptional changes could be detected by northern analysis where the level of RNA expression of the cell cycle genes could be assessed using specific cDNA probes. Post-transcriptional changes include testing RNA stability, protein translation, and protein stability. Molecules in major signalling pathways should
also be evaluated before any meaningful hypotheses could be proposed for the workings of angiostatin.
Recently, Judah Folkman's laboratory published a paper proposing that angiostatin caused cells to apoptose (Claesson-Welsh et al. 1998). The conditions they used in their experiment were as follows: BCECs on cover slides were treated with 2.5 gg/ml of angiostatin for 3 days in the presence of 10% newborn calf
serum. They found that angiostatin treatment led to a nearly doubled frequency of stained, pyknotic nuclei. Under these conditions, they reported that angiostatin had no effect on DNA synthesis.
The TUNEL assay to test for apoptosis under the conditions used for the thymidine incorporation assay in this thesis was not evaluated. Angiostatin treated cells, however, did not appear to result in more dead cells than the untreated control., as determined by the number of floating cells in the plates. Perhaps under certain conditions angiostatin arrests endothelial cell proliferation and under another set of conditions angiostatin kills cells.
The limited supply of active angiostatin available to me created an obstacle in experiments to further characterize the mechanism by which angiostatin
inhibits endothelial cells. As a result, attempts to purify endostatin were initiated. Thus far, the conditioned media from 293-endo cells seem to inhibit DNA
synthesis in BCEC. If the inhibition of BCEC by the conditioned media from 293-endo cells prove to be authentic by comparing results with control conditioned media from 293 cells, a more complete evaluation of the cell cycle proteins affected by endostatin could be made.
References:
Boehm, T., Folkman, J., Browder, T., and O'Reilly, M. (1997). Antiangiogenic
theraphy of experimental cancer does not induce acquired drug resistance. Nature 390, 404-407.
Bonfil, R.D., Ruggiero, R.A., Bustuoabad, O.D., Meiss, R.P., and Pasqualini, C.D. (1988). Role of concomitant resistance in the development of murine lung metastases. Int. J. Cancer 41, 415-422.
Claesson-Welsh, L., Welsh, M., Ito, N., Anand-Apte, B., Soker, S., Zetter, B., O'Reilly, M., and Folkman, J. (1998). Proc. Natl. Acad. Sci. USA 95, 5579-5583. Clark, W.H., Jr., Elder, D.E., Guerry, D.I.V., Braitman, L.E., Trock, B.J., Schultz, D., Synnestevdt, M., and Halpern, A.C. (1989). Model predicting survival in stage I melanoma based on tumor progression. J. Natl. Cancer Inst. 81, 1893-1904. Coats, S., Flanagan, W.M., Nourse, J., and Roberts, J.M. (1996). Requirement of p27Kip1 for restriction point control of the fibroblast cell cycle. Science 272, 877-880.
Dong, Z., Kumar, R., Yang, X., and Fidler, I.J. (1997). Macrophage-derived metalloelastase is responsible for the generation of angiostatin in lewis lung carcinoma. Cell 88, 801-810.
Ewen M.E., Sluss, H.K., Sherr, C.J., Matsushime, H., Dato, J., and Livingston, D.M. (1993). Functional interactions of the retinoblastoma protein with mammalian D-type cyclins. Cell 73, 487-497
Fiedler, I.J. and Ellis, L.M. (1994). The implications of angiogenesis for the biology and therapy of cancer metastasis. Cell 79, 185-188.
Fisher, B., Gunduz, N., Coyle, J., Rudock, C., and Saffer, E. (1989). Presence of a growth-stimulating factor in serum following primary tumor removal in mice. Cancer Res. 49, 1996-2001.
Fisher, B., Gunduz, N., and Saffer, E.A. (1983). Influence of the interval between primary tumor removal and chemotherapy on kinetics and growth of metastases. Cancer Res. 43, 1488-1492.
Folkman, J. (1989). What is the evidence that tumors are angiogenesis dependent. J. of the Nat. Cancer Inst. 82, 4-6.
Folkman, J. (1995). Angiogenesis in cancer, vascular, rheumatoid and other disease. Nature Medicine 1, 27-31.
Folkman, J., Haudenschild, C.C., and Zetter, B.R. (1979). Long-term culture of capillary endothelial cells. Proc. Natl. Acad. Sci. USA 76, 5217-5221.
Gately, S., Twardowski, P., Stack, M.S., Patrick, M., Boggio, L., Cundiff, D.L., Schnaper, H.W., Madison, L., Volpert, O., Bouch, N., Enghild, J., Kwaan, H.C., and Soff, G.A. (1996). Human prostate carcinoma cells express enzymatic activity that converts human plasminogen to the angiogenesis inhibitor, angiostatin.
Good, D.J., et al. (1990). A tumor suppressor-dependent inhibitor of angiogenesis is immunologically and functionally indistinguishable from a fragment of
thrombospondin. PNAS, USA 87, 6624-6628.
Hohenester, E., Sasaki, T., Olsen, B.R., and Timpl, Rupert. (1998). Crystal structure of the angiogenesis inhibitor endostatin at 1.5 A resolution. EMBO J.
17, 1656-1664.
O'Reilly, M.S., Boehm, T., Shing, Y., Fukai, N., Vasios, G., Lane, W.S., Flynn, E., Birkhead, J.R., Olsen, B.R., and Folkman, J. (1997). Endostatin: an endogenous inhibitor of angiogenesis and tumor growth. Cell 88, 277-285.
O'Reilly, M.S., Holmgren, L., Chen, C., and Folkman, J. (1996). Angiostatin induces and sustains dormancy of human primary tumors in mice. Nature Medicine 2:6, 689-692.
O'Reilly, M.S., Holmgren, L., Shing, Y, Chen, C., Rosenthal, R.A., Moses, M., Lane, W.S., Cao, Y., Sage, E.H., and Folkman, J. (1994). Angiostatin: a novel
angiogenesis inhibitor that mediates the suppression of metastases by a lewis lung carcinoma. Cell 79, 315-328.
Planas-Silva, M.D. and Weinberg, R.A. (1997). The restriction point and control of cell proliferation. Curr. Opin. Cell Biol. 9, 768-772.
Sherr, C.J. (1996). Cancer cell cycles. Science 274, 1672-1677.
Sim, B.K.L., O'Reilly, M.S., Liang, H., Fortier, A.H., He, W., Madsen, J.W.,
Lapcevich, R., and Nacy, C.A. (1997). A recombinant human angiostatin protein inhibits experimental primary and metastatic cancer. Cancer Research 57,
1329-1334.
Vallance, S.J., Lee, H.M., Rousel, M.F., Shurtleff, S.A. Kato, J.Y., Strom, D.K., and Sherr, C.J. (1994). Monoclonal antibodies to mamalian D-type G1 cyclins.
Hybridoma 13, 37-44.
Woodruff, M. (1980). The interactions of cancer and the host (New York: Grune and Stratton).
Woodruff, M. (1990). Cellular Variation and Adaptation in Cancer (New York: Oxford University Press).
Wu, Z., O'Reilly, M.S., Folkman, J., and Shing, Y. (1997). Suppression of Tumor Growth with Recombinant Murine Angiostatin. Biochem. and Biophy. Res. 236,
651-654.
Zavitz, K.H. and Zipursky, S.L. (1997). Controlling cell proliferation in
differentiating tissues: genetic analysis of negative regulators of G1 to S-phase progression. Curr. Opin. Cell Biol. 9, 773-781.