Massachusetts Institute of Technology
Engineering Systems Division
Working Paper Series
ESD-WP-2003-01.04-
ESD Internal Symposium
THE
EFFECT
OF
E-BUINESS
ON
SUPPLY
CHAIN
STRATEGY
David Simchi-Levi
Professor of Engineering Systems,
MIT, Cambridge MA
Edith Simchi-Levi
VP Operations, LogicTools Inc.
Title: The Effect of e-Business on Supply Chain Strategy1 Authors: David Simchi-Levi2 and Edith Simchi-Levi3 Abstract
Internet technology has forced companies to redefine their business models so as to improve the extended enterprise performance - this is popularly called e-business. The focus has been on improving the extended enterprise transactions including Intra-organizational, Business-to-Consumer (B2C) and Business-to-Business (B2B) transactions. This shift in corporate focus allowed a number of companies to employ a hybrid approach, the Push-Pull supply chain paradigm. In this article we review and analyze the evolution of supply chain strategies from the traditional Push to Pull and finally to the hybrid Push-Pull approach. The analysis motivates the development of a framework that allows companies to identify the appropriate supply chain strategy depending on product characteristics. Finally, we introduce new opportunities that contribute and support this supply chain paradigm.
1 Introduction
The influence of the Internet and E-commerce on the economy in general, and business practice in particular, has been tremendous. Changes are happening extremely fast and the scope is breathtaking! For instance, the Direct-Business-Model employed by industry giants such as Dell Computers and Amazon.com, enables customers to order products over the Internet and thus allows companies to sell their products without relying on third party distributors. Similarly, Business-to-Business E-commerce, which is predicted by Forrester Research to skyrocket from $43 Billion in 1998 to $1.3 trillion in 2003, promises convenience and cost reduction.
In parallel, the Internet and the emerging E-business models have produced expectations that many supply chain problems will be resolved by virtue of these new technology and business models. E-business strategies were supposed to reduce cost, increase service level, increase flexibility and of course profits, albeit sometime in the future. Reality has not been as kind to these hopes as many of the new e-businesses have begun to flounder or, at best, not reach their full promise. In many cases, the downfall of some of the latest high-profile Internet businesses has been attributed to their logistics strategies. Here are a few recent examples:
Example 1: On-line Furniture Industry
The furniture industry seemed ripe for modernization and e-business when executives from living.com purchased Shaw Furniture Gallery, the tenth largest furniture store in North Carolina in March of 1999. The purchase was intended to provide living.com with access to top line furniture manufacturers who had
resisted on-line sales because of manufacturers’ resistance to competition with
1
This article is inspired by our book “Designing and Managing the Supply Chain: Concepts, Strategies and Case Studies” co-authored with Phil Kaminsky and published by McGraw-Hill in August 1999.
2
Professor of Engineering Systems, MIT, Cambridge MA, e-mail: [email protected]
3
show rooms. After an investment of $70 million in capital and a spot as the
exclusive Amazon.com furniture link, Living.com declared bankruptcy on Aug. 29, 2000. The reasons for the failure are varied but they include investment in a new information system that did not function correctly and switching to a carrier that had no experience with furniture delivery that led to an amazing 30% return rate. Another recent example, Furniture.com launched in January 1999, offering thousands of products from many furniture makers, although only few brand names. The company had $22 Million in sales in the first 9 months of 2000 and 1 million visitors a month to its Web site. What brought its recent (Nov. 6, 2000) downfall were the logistics details, and in particular, inefficient delivery
processes. Initially, Furniture.com used carriers to ship its products from a central warehouse to the customers. Since transportation costs were too high, the firm formed an alliance with six regional distributors. They soon found that these relationships were hard to maintain and left many problems unsolved including handling of repairs and returns.
Example 2: On-line Grocery Industry
Founded in 1989, Peapod is based in Skokie, Illinois and is considered one of America’s leading on-line grocers. As a highly experienced on-line grocer, the company serves more than 130,000 customers. In 1999, Peapod had sales of $73 million and generated a loss of $29 million. Peapod’s mounting losses and inability to secure additional funding resulted in a buy-out of a majority of its stock in April 2000 by Royal Ahold, the international food company. Peapod thus
escaped the fate of Shoplink.com, Streamline.com and Priceline’s WebHouse Club who have recently retired from the on-line grocery market. The main reason for the recent collapses in the on-line grocery industry is attributed to high
delivery costs.
Example 3: Amazon.com
What started in 1995 as Earth’s biggest bookstore is rapidly becoming Earth’s biggest anything store. Amazon.com’s main site offers millions of books, CDs, DVDS, videos, toys, tools, and electronics. It also conducts auctions for items ranging from art to real estate. Its services include a scheduler, address book, and a comparison-shopping tool. Expansion is propelling the company in many directions; it owns stakes in online sellers of pet supplies, prescription drugs, cars, groceries, and more. Amazon.com has become a model for Internet companies by placing market share ahead of profits and making acquisitions funded by its meteoric market capitalization. Amazon.com’s four-year history reflects this preference. In 1996 the company had $16M in sales and a $6M loss, in 1999 it had $1.6B in sales and a $720M loss, hardly a financial success story.
Some companies, of course, are extremely successful in developing new business models that allow them to increase profits significantly and capture a sizeable market-share. These companies use the Internet as the driver of the business change.
Example 4: Dell Computers
According to the Stern Stewart EVA™ 1000 database, Dell Computers has out performed the competition in terms of shareholder growth over the eight year period, 1988-1996, by over 3000%. This example is of course important in our discussion since competition in the PC industry is not on new technology. More or less, most PC manufacturers use the same technology, e.g., Microsoft and Intel. Indeed, competition in the PC industry is mainly on price, or cost, and service level. Dell’s success is attributed to its virtual integration a strategy that is achieved by blurring the traditional boundaries between suppliers,
manufacturers, and end users. Dell’s decision to sell computers built from
components produced by other manufacturers has relieved Dell of the burden of owning assets, research and development risks and the burden of managing a large workforce. At the same time, Dell only produces to order and thus keeps no finished goods inventory. These business decisions have allowed Dell to grow much faster than its competition and maintain only eight days of inventory.
Example 5: Cisco’s e-Business model
“Cisco’s Internet based business model has been instrumental in its ability to quadruple in size from 1994 to 1998 ($1.3 billion to over $8 billion), hire
approximately 1,000 new employees per quarter while increasing their
productivity and save $560M annually in business expenses” (Peter Solvik, CIO Cisco). Over 80% of Cisco’s customer business is performed over the Internet and this is only a small part of the picture. Indeed, to differentiate itself from the competition in what is essentially a commodity business, Cisco acquires
companies who have leading technology and integrates them rapidly with its systems. It also sells network solutions to its customers, not just components. This requires coordination of hardware, software and service components in many sales. The ability to provide these services and integrate many new
businesses is enabled by Cisco’s single -enterprise system. This system provides the backbone for all activities in the company and not only connects customers and employees but also chip manufacturers, component distributors, contract manufacturers, logistics companies and systems integrators. These participants can perform like one company because they all rely on the same web-based data sources. All its suppliers see the same demand and do not rely on their own forecasts based on information flowing from multiple points in the supply chain. Cisco also built a dynamic replenishment system to help reduce supplier
inventory. Cisco's average turns in 1999 were 10 compared with an average of 4 for competitors. Inventory turns for commodity items are even more impressive; they reach 25-35 turns a year.
The previous examples raise an important question. Why in some cases do the new business models seem to fail while in other cases, they generate incredible success stories? Alternatively, if Dell and Cisco can use the Internet to develop such an effective business model, what inhibits other firms from adopting similar techniques and
understanding of Internet based supply chain strategies. In the next section, we argue that the Internet motivates and supports a supply chain paradigm shift that can have a major impact on business performance. We will describe how this paradigm evolved in various industries and how new e-business opportunities support this environment.
Another important question is how to align a company’s e-business strategy with its supply chain. This question is discussed in Chopra and Van Miegham (2000) where the focus is on understanding the impact of an e-business plan on revenue on the one hand and supply chain costs such as facilities, inventory, transportation and information on the other. Our approach is different; we focus on product and industry characteristics and their effect on supply chain strategy.
2 A New Supply Chain Paradigm
To better understand the impact of the Internet on supply chains, we start by introducing our definition of e-Business and e-Commerce.
E-business is a collection of business models and processes motivated by Internet technology, and focusing on improvement of extended enterprise performance. E-commerce is the ability to perform major commerce transactions electronically.
This definition leads to several observations. First, commerce is only part of E-business. Second, Internet technology is the force behind the business change. Finally, the focus in E-business is on the extended enterprise, i.e., Intra organizational, Business-to-Consumer (B2C) and Business-to-Business (B2B) transactions. B2C refers to
businesses that are direct to customer especially retail activities over the Internet including products, insurance, banking etc. B2B refers to business conducted over the Internet predominantly among businesses. This includes exchanges but also collaboration with suppliers and vendors to achieve common goals.
Many companies have recognized that the Internet can have a huge impact on supply chain performance. Indeed, these companies observed that the Internet could help them move away from the traditional Push strategy employed by most supply chains. Initially, the move was toward a Pull strategy, but as we demonstrate below, eventually, many companies ended up with a hybrid strategy, namely a Push-Pull supply chain.
Push Supply Chains:
In a Push supply chain, production and distribution decisions are based on long-term forecasts. Typically, the manufacturer uses orders received from the retailer’s warehouses to forecast demand. It therefore takes much longer for a push-based supply chain to react to the changing marketplace. In addition, since long-term forecasts play an important role, it is important to understand the following four principles of all forecasts and their impact on the supply chain.
1. The forecast is always wrong,
2. The longer the forecast horizon, the worse is the forecast 3. Data updates lead to forecast updates, and
4. Aggregate forecasts are more accurate.
Thus, the first principle implies that it is difficult to match supply and demand, and the second one implies that it is even more difficult if one needs to predict customer demand for a long period of time, e.g., the next twelve to eighteen months. The third principle suggests that as the firm receives more demand data, it uses the data to update its forecast, and therefore update inventory levels, safety stock and order quantities.
Figure 1: The bullwhip effect
This implies that traditional inventory management techniques practiced at each level of the supply chain lead to the Bullwhip Effect, which is a phenomenon common in Push supply chains. The Bullwhip Effect suggests that variability of orders received from retailers and warehouses is much larger than variability in customer demand, see Figure 1. This increase in variability is directly related to supply chain lead-time: The longer the lead-time the larger the increase in variability.
Evidently, this increase in variability leads to
1. Excessive inventory due to the need for large safety stock 2. Large and more variable production batches
3. Unacceptable service levels
4. Inability to manage resources effectively since it is not clear whether the firm needs to plan resources based on average demand or based on peak demand.
Pull Supply Chains:
In a Pull supply chain production and distribution are demand driven so that they are coordinated with true customer demand rather than forecast. That is, in a pure Pull system, the firm does not hold any inventory and only produces to order. These systems are intuitively attractive since they allow the firm to eliminate inventory, reduce the Bullwhip Effect, increase service levels, etc.
Unfortunately, it is very difficult to implement a Pull supply chain strategy when lead times are too long that it is impractical to react to demand information. Similarly, in a Pull strategy, it is frequently more difficult to take advantage of economies of scale, since production and distribution decisions are in response to specific customer demand and therefore batch production or efficient transportation modes, such as truckloads, are hard to achieve.
These advantages and disadvantages of Push and Pull supply chains have led companies to look for a new supply chain strategy that takes advantage of the best of both world; enter a hybrid of the two systems, Push-Pull Supply Chain systems.
Push-Pull Supply Chains:
In a Push-Pull strategy, some stages of the supply chain, typically the initial stages, are operated in a push-based manner while the remaining stages are operated in a pull-based strategy. We typically refer to the interface between the push-based stages and the pull-based stages as the push-pull boundary.
Consider a PC manufacturer who builds to stock and thus makes all production and distribution decisions based on forecast. This is a typical Push system. In a Push-Pull strategy, the manufacturer builds to order. This implies that component inventory is managed based on forecast but final assembly is in response to a specific customer request. Hence, the Push part is the part of the manufacturer’s supply chain prior to assembly while the Pull part is the part of the supply chain that starts with assembly and is performed based on actual customer demand.
Observe that in this case the manufacturer takes advantage of the fourth principle of all forecasts, namely, that aggregate forecasts are more accurate. Indeed, demand for a component is an aggregation of demand of all finished products that use this component. Since aggregate forecasts are more accurate, uncertainty in component
demand is much smaller than uncertainty in finished goods demand. This, of course, leads to safety stock reduction. Dell Computers is an excellent example of the impact the Push-Pull system on supply chain performance.
Postponement, or delayed differentia tion, in product design is also an excellent example of a Push-Pull strategy. In postponement, the firm designs the product and the manufacturing process so that decisions about which specific product is being manufactured can be delayed as much as possible. The manufacturing process starts by producing a generic or family product, which is differentiated to a specific end product when demand reveals itself. Therefore, the portion of the supply chain prior to product differentiation is typically a push-based strategy. That is, the generic product is built and transported based on long-term forecasts. Since demand for the generic product is an aggregation of demand for all its corresponding end products, forecasts are more accurate and thus inventory levels are reduced. In contrast, customer demand for a specific end product typically has a high level of uncertainty and thus product differentiation occurs only in response to individual demand. Thus, the portion of the supply chain starting from the time of differentiation is a pull-based supply chain.
The previous two examples reveal two important insights:
Insight 1: In a Push-Pull strategy, the Push part is applied to the portion of the supply
chain where long- term forecasts have small uncertainty and variability. On the other hand, the Pull part is applied to the portion of the supply chain where uncertainty and variability are high and therefore decisions are made only in response to realized demand.
Insight 2: Inventory is a necessary evil. Indeed, a Push-Pull supply chain is designed on
the premise that inventory is essential in an effective supply chain strategy.
3 The Evolution of Supply Chain Strategies
In this section we demonstrate that in the last few years, because of the Internet, a number of industries have moved from Push strategies, initially to Pull strategies, just to find that these strategies lead to significant service and distribution problems, and eventually to Push-Pull supply chains.
The Grocery Industry:
Consider the grocery ind ustry. A typical supermarket operates in a Push based strategy where inventory at the warehouses and stores are based on forecast. When Peapod was founded, eleven years ago, the idea was to establish a pure Pull strategy with no inventory and no facilities. When a customer ordered grocery, Peapod would pick the products at a supermarket nearby. This strategy had significant service problems since stock-out rates were very high, about 8-10%. In the last few years, Peapod changed its business model to a Push-Pull strategy by setting up a number of warehouses; stock-out
rates are now less than two percent. Observe that in this case, the Push part is the portion of the Peapod supply chain prior to satisfying customer demand and the Pull part starts from a customer order. Also note that since a Peapod warehouse covers a large geographical area, clearly larger than the one covered by an individual supermarket, demand is aggregated over many customers and locations, resulting in better forecasts and inventory reduction.
Of course, in the on- line grocery industry there are other challenges, namely reducing transportation costs and responding in a very short period of time, i.e., typically within twelve hours in a tight delivery window. The problem is that currently all on- line grocers do not have the density of customers that will allow them to control transportation cost and therefore compete with traditional supermarkets. This is exactly the reason for the recent inability of on- line grocers to become profitable, or even break-even despite large investments.
The Book Industry:
The book industry is another excellent example of the evolution of supply chain strategies from Push to Pull and then to Push-Pull. Until recently, Barnes and Noble had a typical Push supply chain. When Amazon.com was established about four years ago, their supply chain was a pure Pull system with no warehouses and no stock. Indeed, at that time Ingram Book supplied most of customer demand.
Evidently, Ingram Book can aggregate across many distributors and take advantage of economies of scale. Thus, the Pull model employed by Amazon.com was an appropriate strategy when Amazon.com was building its brand name. As volume and demand increased, two issues became clear. First, Amazon.com’s service level was affected by Ingram Book’s distribution capacity which was shared by many distributors. Indeed, during periods of peak demand, e.g., Christmas time, Amazon.com could not meet its service level goals. Second, using Ingram Book in the first few years allowed Amazon.com to avoid inventory costs but significantly reduced profit margins. As demand increased, it was evident that Ingram Book did not provide any advantage for many of the book categories. This is true since Amazon.com’s ability to aggregate across large geographical areas allows the company to reduce uncertainties and hence inventory costs.
As Amazon.com discovered these problems, the company changed its philosophy and now Amazon.com has several warehouses around the country where they keep stock of most of the titles they sell. Thus, inventory at the warehouses is managed based on a Push strategy, namely based on long-term forecast, while demand is satisfied based on individual request, a Pull strategy.
The Retail Industry:
The retail industry was late to respond to competition from the virtual stores and to recognize the opportunities provided by the Internet. Recently, however, the landscape
has changed with many “Brick and Mortar” companies adding an Internet shopping component to their offering. Enter “Click and Mortar” giants Wal-Mart, K-Mart, Target, Barnes and Noble, to name a few examples. These retailers have recognized the
advantage they have over the pure Internet companies. Indeed, they already have the distribution and warehousing infrastructure in place. Thus, they have established virtual retail stores, serviced by their existing warehousing and distribution structures.
As a result of going on- line, “Click and Mortar” have changed their approach to stocking in their various warehouses. Fast moving products, that is, products whose
demand can be accurately matched with supply based on long term forecasts, are stocked in stores, while slow-moving products are stocked centrally for on-line purchasing. The
latter products ha ve highly uncertain demand levels and thus require high levels of safety stock. Centralized stocking in this case effectively reduces uncertainties by aggregating demand across geographical locations and hence reduces inventory levels.
Of course, the move of “Brick and Mortar” to “Click and Mortar” is not an easy one and may require skills that the “Brick and Mortar” do not necessarily have.
Example 6: Wal-Mart’s e -fulfillment Strategy
Wal-Mart has always prided itself in its in-house distribution operations. Thus, it was a huge surprise when the company announced that it plans to hire an outside firm to handle order fulfillment and warehousing for it’s on-line store Wal-Mart.com, which the retailer launched in the fall of 1999.
Filling orders behind the scenes of Wal-Mart’s cyberstore is Fingerhut Business Services. With a background in handling individual orders, Fingerhut has emerged as a major provider of Third Party distribution services to other retailer and e-tailers interested in home delivery. Fingerhut will provide Internet order fulfillment, warehousing, shipment, payment processing, customer service and merchandise returns.
4 Impact on Transportation and Fulfillment
This review of the evolution of supply chain strategies suggests the following insight:
Insight 3: The Internet and the associated new supply chain paradigm introduce a shift
in fulfillment strategies: From cases and bulk shipments to single items and smaller size shipments; and from shipping to a small number of stores to serving highly geographically dispersed customers. This shift has also increased the importance and the complexity of reverse logistics.
Table 1 summarizes the impact of the Internet on fulfillment strategies.
Specifically, the new developments in supply chain strategies are very good news for the parcel and LTL industries. Both the Pull and the Push-Pull systems rely heavily on individual (e.g., parcel) shipments rather than bulk shipments. This is especially true in the Business-to-Consumer area, where a new term has been coined: e-fulfillment.
Another impact of e- fulfillment on the transportation industry is the significant increase in reverse logistics. Indeed, in the business to consumer arena, e-fulfillment typically means that the supplier needs to ha ndle many returns, each of which consists of a small shipment. This is true, since on- line retailers need to build customer trust through generous return terms. Parcel shipping is already set up to handle these returns, a major issue in B2C and in many cases in B2B commerce. This is a challenge for the LTL industry which traditionally has not been involved as much in Door-to-Door services.
E-Fulfillment logistics requires short lead-time, ability to serve globally dispersed customers, and the ability to reverse the flow easily from B2C to C2B. Only parcel shipping can do all that. Indeed, one important advantage of the parcel industry is the existence of an excellent information infrastructure that enables real-time tracking. Thus, the future looks promising for the parcel shipping industry and, in particular, for those carriers and consolidators who work to modify their own systems in order to integrate it with their customers’ supply chains.
Traditional Fulfillment
e-fulfillment
Supply Chain
Strategy Push Push-Pull
Shipment Bulk Parcel
Reverse Logistics
Small Part of the Business Important and Highly Complex Delivery Destination Small Number of Stores
Large Number of geographically Dispersed Customers
Lead Times Relatively Long Relatively Short
Table 1: Traditional fulfillment vs. e-fulfillment
5 Identifying the Appropriate Supply Chain Strategy
This review of the evolution of supply chain strategies described in Section 3 also suggests:
Insight 4: The appropriate supply chain strategy depends on the industry, the company
and individual products. The higher the uncertainty in customer demand, the more important it is that parts of the supply chain will be managed based on a Pull strategy. Similarly, the higher the delivery cost, relative to the unit price, the more important it is that parts of the supply chain will be managed based on a Push strategy.
Figure 2 below provides a framework to match supply chain strategies with products and industries. The vertical coordinate provides information on uncertainty in
customer demand while the horizontal coordinate represents total delivery cost, including the costs of returns, relative to the unit price.
The region is partitioned into four boxes. The box marked I represents industries (or, more precisely, products) that are characterized by high uncertainty and low delivery cost, e.g., the computer industry. These are the industries and products for which it is important that parts of their supply chain will be managed based on a Pull strategy.
The box marked III represents products that are characterized by low demand uncertainty and high delivery costs, e.g., products in the grocery industry such as beer, pasta, or soup. In this case, our analysis indicates that a Pull strategy is not appropriate. Indeed, in this case, a traditional retail strategy, i.e., a push supply chain strategy, is appropriate, since managing inventory based on long-term forecast does not increase inventory holding costs while delivery costs are reduced due to economies of scale.
The two boxes analyzed so- far represent situations in which it is relatively easy to identify an efficient supply chain strategy. The challenge is to analyze the remaining boxes. Evidently, in the remaining two cases there is a mismatch between the strategies suggested by the two attributes, uncertainty and delivery cost. Indeed, in these boxes uncertainty “pushes” the supply chain to have one structure while delivery cost suggests a completely different structure.
Figure 2: Matching Supply Chain Strategies with Products
Relative delivery cost Demand uncertainty I Computer II Furniture IV Books & CDs III Grocery L H H L Pull Push Pull Push
For instance, the box marked IV represents products characterized by low demand uncertainty, indicating a Push supply chain, and low delivery costs, suggesting a Pull supply chain. For instance, books and CDs fall in this category. In this case, a more careful analysis is required, since both, on-line strategies or traditional retail strategies, are appropriate, depending on the specific costs and uncertainties.
Finally, box II represents products and industries for which uncertainty in demand and delivery costs are high. The furniture industry is an excellent example of this situation. Indeed, a typical furniture retailer offers a large number of similar products distinguished by shape, color, fabric, etc., and as a result demand uncertainty is very high. Unfortunately, delivery costs are also high, and even more so, in an on- line environment where return rates are significant.
Thus, in this case, there is a need to distinguish between the production and the distribution strategy. The production strategy has to follow a pull-based strategy since it is impossible to make production decisions based on long-term forecasts. On the other hand, the distribution strategy needs to take advantage of economies of scale and thus use retail channels. This is exactly the strategy employed by many retailers that do not keep any inventory of furniture. When a customer places an order, it is sent to the manufacturer who orders the fabric and produces to order. Once the product is ready, it is shipped, typically using truckload carriers, together with many other products to the retail store and from there to the customer. For this purpose, the manufacturer typically has a fixed delivery schedule and this is used to aggregate all products that are delivered to stores in the same region. This distribution strategy allows the supply chain to reduce not only transportation costs, due to economies of scale, but also to reduce return rates. This is true, since once the new furniture arrives at the store it can be inspected and, if needed, repaired. Thus, the supply chain strategy followed by furniture manufacturers is, in some sense, a Pull-Push strategy where production is done based on realized demand, a Pull
strategy, while delivery is according to a fixed schedule, a Push strategy.
The automobile industry also belongs to box II. Indeed, a typical car manufacturer offers a large number of similar products distinguished by functionality, motor power, shape, color, number of doors, sports wheels, etc. and as a result demand uncertainty for a particular configuration is very high. Delivery costs are quite high as well. Traditionally, this industry employed a push based supply chain strategy, building inventory for the dealer distribution systems. Thus, the automobile industry does not currently follow the model developed in Figure 2.
Recently, however, GM announced, and Ford is not far behind, that the company is completely changing the way it is designing, building and selling its products and the scope of the plan is breathtaking! The challenge is to allow customers to custom and order cars online and have the car show up at the door in less than ten days. Thus, GM is moving exactly in the direction predicted by our model, toward a build-to-order strategy.
Unfortunately, lead times in the automobile industry are currently very long, fifty to sixty days on average. Thus, GM has to reconsider the entire supply chain including
the way it partners with suppliers, the manufacturing activities and the distribution channels. In particular, reducing lead times to ten days or below requires a significant reduction in the number of options and configurations offered to buyers.
6 Locating the Push-Pull Boundary
The framework developed in the previous section attempts to characterize the level of Pull/Push required for different products. For instance, our framework suggests a high degree of Pull for products that belong to box I. Of course, achieving a high degree of Pull depends on product complexity, manufacturing lead times and supplier-manufacturer relationships, to name some important issues. As evident from Dell Computers’ business model, PCs are perfect products for achieving a high degree of Pull since they are manufactured from standard components available from many competing suppliers while assembly lead-time is relatively short, hence a make-to-order or a Push-Pull strategy.
Evidently, there are many ways to implement a Push-Pull strategy, depending on where the firm is locating the Push-Pull Boundary in its supply chain. To better
understand this issue, consider the supply chain time line , that is, the time that elapses between procurement of raw material (beginning of the time line) and the delivery of an order to the customer (end of the time line). The Push-Pull boundary is located
somewhere along the time line and it indicates the point in time where the firm switches from managing the supply chain using one strategy, typically a Push strategy, to
managing it using a different strategy, typically a Pull strategy.
Figure 3: Potential Locations for the Push-Pull Boundary
Figure 3 presents potential locations for the Push-Pull boundary together with industries that implemented the boundary at the various locations. For instance, furniture manufacturers locate the boundary at the production point while Amazon.com and Peapod locate the boundary at their distribution centers.
Evidently, as products move along the supply chain time line, their value increases, i.e., the value of components at the procurement stage is smaller than after assembly and this is again smaller than the value of the same product at the store. This
implies that it is better to keep inventory in earlier stages of the supply chain rather than in later stages, since the cost of holding one unit inventory increases as the unit moves in the supply chain. However, in a Push-Pull strategy, the closer the boundary to the
beginning of the supply chain time line the longer the delivery lead-time , i.e., the time that elapses from receiving a customer order until the customer receives the product. Thus, locating the boundary at assembly time, as is done by Dell Computers, is not appropriate for products with long assembly or transportation lead-times. In this case it is more appropriate to move the boundary toward the end of the supply chain time line.
Consider for instance the car industry, an industry known for its long
transportation lead-times. Prior to its latest effort to change its business model to the make-to-order strategy, there were previous attempts in the car industry to implement a Push-Pull strategy. In 1994, GM announced that the manufacturer is establishing a regional distribution center in Orlando Florida., with about 1500 Cadillacs. Dealers could order cars they did not have in their lot from the distribution center and the car would be delivered within 24 hours. Thus, GM was attempting to employ a Push-Pull strategy in which inventory at their regional distribution center was managed based on long-term forecasts while delivery to dealers was based on realized demand.
Two major issues contributed to the failure of this strategy. First, the regional warehouse shifts inventory costs from the dealers to GM, since it allowes dealers to reduce inventory levels. Second, the regional distribution center equalizes small and large dealers. That is, if all dealers have access to the regional warehouse, then there is no difference between small and large dealers. Thus, it is difficult to see why large dealers would be interested in participating in such an arrangement.
7 Conflicting Objectives: Cost and Service Level
For companies struggling to improve supply chain performance, the challenge is clear. They need to identify supply chain strategies that allow the enterprise to decrease system wide costs and increase service levels. Unfortunately, these are sometimes conflicting goals. Indeed, high service levels require building inventory that is in direct conflict with the objective of reducing system wide cost. By contrast, a focus on cost reduction in the supply chain forces the firm to cut inventory and thus may lead to low service levels.
We argue that a Push-Pull strategy allows the supply chain partners to achieve both objectives. Indeed, the Push part of the supply chain is applied to the portion of the supply chain where long- term forecasts have small uncertainty and variability. Thus, service level is not a big challenge and the focus is on cost reduction. On the other ha nd, the Pull part is applied to the portion of the supply chain where uncertainty and
variability are high and hence the focus is on matching supply and demand.
Consider, for instance, a supplier of fashion skiwear such as Sport Obermeyer, see Fisher, Hammond, Obermeyer and Raman (1994). Every year the company introduces many new designs, or products, for which forecast demand is highly uncertain. One
strategy used successfully by Sport Obermeyer is to distinguish between high-risk and low-risk designs. Low risk products, i.e., those for which uncertainty and price are low, are produced in advance using long-term forecasts and focusing on cost minimization, a Push based strategy. But, decisions on production quantities for high-risk products are delayed until there is a clear market signal on customer demand for each style, i.e. a Pull strategy. Since fabric lead times are long, the manufacturer typically orders fabric for high-risk products well in advance of receiving information about market demand and based only on long-term forecasts.
Therefore, in this case, the manufacturer takes advantage of the fourth principle of all forecasts, which suggests that aggregate forecasts are more accurate. Since demand for fabrics is an aggregation of demand for all products that use that fabric, demand
uncertainty is low and thus fabric inventory is managed based on Push strategy. The analysis thus implies that Sport Obermayer uses a Push-Pull strategy for all the high-risk products and a Push strategy for all low-risk products.
Insight 5: In the Push portion of a Push-Pull supply chain strategy the focus is on cost
minimization while in the Pull portion of the strategy the focus is on service levels.
Of course, even though the focus in the Pull portion of the supply chain strategy is on service level, cost, specifically delivery cost, is an important issue. After all, someone needs to pay that cost. Amazon.com and Dell Computers transfer the entire cost to the customers. However, on- line grocers cannot transfer this cost in its entirety to the customers. Indeed, unlike the book industry, on- line grocers cannot rely on parcel services and have to develop their own distribution system. With less than 400,000 shoppers in the year 2,000 across all on-line grocers, this industry does not have the density of customers that will allow them to reduce delivery cost to an acceptable level. This has allowed the entry for a new type of home grocer, grocerystreet, that functions as an on- line window for retailers, picks the produce at the store, and allows the customer to either pick up the goods at the store or pay for home delivery, thus transferring the delivery problem and cost to the customer. Our analysis shows that this model, while still a work- in-process, is more cost-efficient and profitable than the full–delivery models.
8 E-Business Opportunities
The previous sections have identified an emerging business model, the Push-Pull strategy, driven by the Internet and allowing companies to increase supply chain performance. This business model requires a much closer relationship between supply chain participants and therefore calls for new practices and new modes of operation. At the same time, the Internet enables cross-enterprise activities because it is ubiquitous and standard. To put this concept in perspective, think about the initial breakthrough application on the Internet: e- mail. This application crosses company boundaries and allows collaboration and problem solving anytime and anywhere, whether inside a company or outside.
Our objective in this section is to describe new business practices motivated by the Internet and the e-Business model. We will discuss the nature and importance of these practices and opportunities as well as some of the tools applied to ensure the success of these new developments.
8.1 Supply Chain Realignment
The Internet and the new business models motivate significant changes in supply chain design. Early on, many believed that the Internet would allow companies to eliminate inventory and distribution centers from their supply chain, see the characteristics of Pull supply chain strategies.
As is illustrated earlier, this is no longer the prevailing practice. Push-Pull
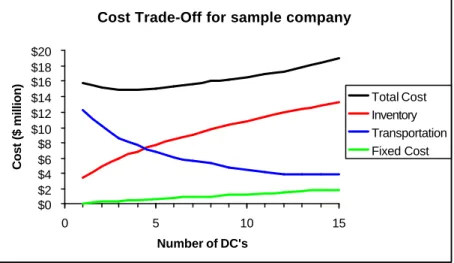
strategies suggest that inventory and distribution centers play an important role in supply chain strategies. Of course, determining the right number of warehouses, the type of inventory, such as components, low volume SKUs, high volume SKUs, and the appropriate inventory levels is a major challenge. For instance, should Amazon.com establish only one warehouse, a small number of warehouses each of which serving a large geographical area, or a large number of warehouses each close to potential customers? The answer to this question depends of course on the trade-off between facility costs, inventory costs, transportation costs and service levels. These trade-offs are nicely illustrated in Figure 2.
Figure 3: Cost trade -off for distribution centers
The Figure suggests that increasing the number of warehouses will entail
•
Increase in fixed costs,•
Decrease in transportation costs since facilities are closer to the customers,Cost Trade-Off for sample company
$0 $2 $4 $6 $8 $10 $12 $14 $16 $18 $20 0 5 10 15 Number of DC's Cost ($ million) Total Cost Inventory Transportation Fixed Cost
•
Increase in inventory costs since inventory is disaggregated and thus achieving an accurate demand forecast is much more difficult, leading to an increase in safety stock, and•
Reduction in response time to customer orders.Thus, the firm must balance the costs of opening new warehouses with the advantages of being close to the customers. Put differently, supply chain realignment is crucial to efficient Push-Pull strategies.
8.2 Supply Chain Visibility
Visibility in the supply chain is one of the main strategies used to reduce the Bullwhip Effect described earlier. Supply chain visibility refers to providing each stage in the supply chain with complete information on customer demand and inventory levels. It also refers to the transfer of information from each stage of the supply chain on inventory and production levels, shipment status and fulfillment needs.
To understand why visibility reduces the Bullwhip Effect, note that if demand information is shared, each stage of the supply chain can use the actual customer demand data to create accurate forecasts rather than relying on orders received from the previous stage. These orders typically have much higher variability than customer demand.
At the same time, information visibility allows supply chain partners to better coordinate production and distribution and thus not only reduce costs, but also reduce lead times in the supply chain. This reduction in lead-time, as observed earlier, results in reduction in inventory levels across the supply chain as well as reduction in the Bullwhip Effect.
Supply chain visibility has a significant impact on supply chain performance. Unfortunately, while companies ha ve plenty of information in their systems, this information may not be accessible to the parties who need it, or it may not be in a format that is conducive to making business decisions. Similarly, there is a need for tools that allow executives and managers to visualize, understand and plan based on large databases.
We identify three main requirements that any supply chain visualization needs to satisfy:
1. Provide summary of key performance measures. These are facility related, product related and supply chain related performance measures. Examples include order fulfillment by product and facility, end-to-end cycle times, supplier effectiveness, etc. 2. Alert when performance measures violate certain, predefined thresholds.
3. Integrate pertinent data for supply chain collaboration and optimization.
Visibility is achieved through integration of the relevant information from existing systems and presenting it to users in a way that assists their ability to make
decisions. The integration technology that is widely becoming standard is XML-based processing. However, EDI and other forms of coordination such as flat file are still popular and are supported by most vendors. Once the data is integrated, the system allows users to tailor the interface to their own needs – so they can see the relevant information through their web browsers.
Logistics data exchanges can also provide visibility. In fact, some of the exchanges are touting visibility as the main benefit. For example, Celarix, a logistics exchange, advertises their offering as “enabling logistics transactions and connecting customers with their internal systems and supply chain partners through the latest messaging technologies, ultimately providing retailers, manufacturers, distributors, carriers, freight forwarders and other trading partners with the information they need to improve customer service and profitability.”
Supply chain visibility systems typically do more than measure and report, they
also attempt to diagnose the problem and dynamically alert different participants to violations of thresholds and constraints. Extending this information directly to supply chain partners, allows them to collaborate on and improve the overall system. Supply Chain Event Management (SCEM) is the name of this application and it is fueled by e-businesses looking to coordinate and control supply chain activities. Real-time
exception-based management is crucial if a company is to succeed in distributing supply processes among trading partners, and that's where SCEM plays a significant role.
8.3 Supply Chain Collaboration
Developing a new business model using Internet technology, the main objective in e-Business, requires companies to transcend traditional models for working with
suppliers and customers. Supply chain collaboration is now key to achieving e-Business success. Evidently, collaboration between enterprises is an enormous challenge from the business aspect much more so than from the technological one. Indeed, the Internet provides accessibility and universal standards that allow for the transmission and
integration of data across supply chain partners. New data integration standards, such as XML and RosettaNet, and the tools developed around them, significantly lower
integration cost and time.
The challenge in supply chain collaboration is to implement the cultural and organizational changes that allow supply chain partners to achieve responsiveness and efficiencies.
We classify supply chain collaboration into three categories:
•
Sharing information•
Coordinating plans, and8.3.1 Sharing information
This is the basic level of collaboration in which supply chain partners share information about demand, inventory levels and promotional activities. For instance, in the retail industry, suppliers receive POS (Point-of-Sale) data from the retailers and use this information to synchronize production and inventory activities with actual sales at the retailer. In this strategy, the retailer still prepares individual orders, but the POS data is used by the supplier to improve forecasting and scheduling and thus to reduce lead-time in the supply chain.
Example 7: Milliken and Company
Among the first companies to utilize this scheme was Milliken and Company, a textile and Chemicals Company. Milliken worked with several clothing suppliers and major department stores, all of which agreed to use POS data from the department stores to synchronize their ordering and manufacturing plans. The lead-time from order receipt at Milliken’s textile plants to fi nal clothing receipt at the department stores was reduced from 18 weeks to 3 weeks.
Observe that lead-time reduction has a major impact both on the retailer and the suppliers. Indeed, lead-time reduction implies that the retailer can reduce its inventory and safety stock. Similarly, it implies a reduction in the Bullwhip Effect and thus it allows the supplier to reduce inventory and better employ resources.
8.3.2 Coordinating plans
The second level of collaboration is motivated by the recognition that sharing information is not enough. That it is important to agree on forecasts and replenishment strategies that will allow the supply chain to achieve a higher level of coordination.
One important example of this level of collaboration is a strategy used by retailers and suppliers called Collaborative Planning, Forecasting and Replenishment (CPFR). CPFR is a process in which supply chain partners coordinate plans to better match supply and demand. This strategy was first developed and implemented successfully by Wal-Mart in collaboration with Warner- Lambert in early 1995. The CPFR process, as implemented by these companies, require buyers and sellers to:
1. Establish a front-end agreement and a joint business plan (Collaborative Planning) 2. Create a sales forecast, identify and resolve exceptions (Collaborative
Forecasting), and
3. Create orders and projected orders (Collaborative Replenishment).
8.3.3 Creating supply chain communities
This is the highest level of collaboration where companies consolidate into true supply chain communities whose members share common goals and objectives across
and among enterprises. The supply chain community streamlines business transactions across partners to maximize growth and profit.
The electronics industry is the most advanced in this respect due to the cutthroat competition. Companies such as Dell, Cisco and Micron practice a form of collaboration that is significantly more intimate than the one practiced in other industries. These companies share not only product development plans, forecasts and replenishment strategies, but also have supplier personnel working in their plants and participating in their planning meetings.
Example 8: Micron and Modus Media
Micron Electronics is a $1.6B computer manufacturer based in Nampa Idaho, it claims to have the most efficient supply chain in the computer industry. The improvements in its supply chain in the last two years are attributed to
collaborative supply chain practices introduced by a new management team. The numbers support this: Micron was producing 2,100 computers a day in Jan 1998 – this year it is 10,000 to 12,000 a day. Product lead times have dropped from as high as 21 days to below 5 days. In 1998, Micron carries $130.7 million in
inventory; today it carries $17 million. Its DSI – days of sales in inventory is 6 compared with Dell’s 6.6 days, Compaq’s 22 days and Gateway’s 11.6.
This has been achieved through close relationships with suppliers, especially Modus Media, which specializes in providing procurement and materials management and various other supply chain services for the
technology industry. The level of collaboration is very high. For instance, Modus employees work in Micron’s plant; attend meetings with Micron’s sourcing, manufacturing and marketing teams. Modus employees replenish Micron’s assembly plant and take part in new product launch meetings. This level of resource sharing allows for quick response and drives down costs for both companies. See Gordon (2000) for more information.
Cisco is an excellent example of a company that has used Internet technology to
create a supply chain community. Hartman and Sifonis (2000) describe how Cisco achieved
this, as well as other business goals, by creating its Manufacturing Connection Online (MCO). MCO is a globally networked manufacturing environment that provides a central-point-of-access for employees, suppliers and logistics partners. It allowed Cisco to reduce lead times and move to a make-to-order environment. For this purpose, Cisco implemented a five-step strategy including:
1. Single Enterprise – created an infrastructure that connects suppliers to Cisco so that Cisco has complete visibility of inventory, product sales and development while all parties works off the same demand signal. A Cisco contract
manufacturer such as Jabil Circuit, sees the order as soon as a customer places them. This allows the manufacturer to assemble the parts and ship directly to the customer. The manufacturer then bills Cisco for the parts used and other costs while Cisco is in charge of billing the customer.
2. New product introduction – prototype building was accelerated through automation of the process of gathering product data information. Prior to
implementing MCO, this was a major bottleneck and setting this information on a network considerably reduced the time and cost of building prototype and
therefore new products. This was achieved by turning sequential procedures into parallel ones that resulted in reduction of the number of exchanges and iterations in the development process.
3. Auto-test - a major outsourcing problem is monitoring the quality of the products. Cisco achieved this by creating test cells on its supplier’s line, automated the test process so it would occur when an order arrived and transferred the final
responsibility to the suppliers. This allows quality issues to be detected at the source but retains Cisco’s control of the intelligence behind the testing.
4. Direct Fulfillment – The single enterprise system allows Cisco to ship directly from suppliers therefore reducing handling and delivery time significantly. 5. Dynamic replenishment - reduction of inventory is enabled through the
availability of real-time information throughout the supply chain. This reduces the uncertainty in the system and allows the system to operate with less overall inventory.
One way to create a supply chain community is by developing a private exchange, also referred to as a private e- marketplace. Initially, exchanges were established as a new way to procure products by forcing suppliers to compete on price. Recently, many of these exchanges have recognized that being only a transaction hub is not sufficient since
• Buyers and suppliers resist paying transaction fees and thus it is hard for these
independent exchanges to build scale.
• Long-term relationships, and not necessarily price, are critical when selecting
suppliers of direct, manufacturing related, products.
These developments have led exchanges to extend their offerings in several ways including providing inventory management, financial or supply chain services. It also led to the development of private exchanges that integrate suppliers, logistics providers and, sometimes, customers. Private e- marketplaces have been established by Dell Computers, Sun Microsystems, Wal-Mart and IBM to name a few. These companies are not using the e-marketplace to force suppliers to compete on price but rather to improve supply chain collaboration by providing demand data for better forecasting and production planning and scheduling.
8.4 Dynamic Pricing Strategies
One important revolution in the retail and manufacturing industries, driven largely by the Internet and altering the way goods are marketed and sold, is the ability to
dynamically change pricing. Many signs of dynamic or flexible pricing can be found on the Internet, mostly in online auctions that allow buyers to bid on everything from spare parts to final goods.
The implementation of flexible pricing strategies in the manufacturing or retail industries has the potential to radically improve supply cha in efficiencies in much the same way as yield management, also referred to as revenue management, has changed airline, hotel and car rental companies. Indeed, in the airline industry, revenue
management provided growth and increased revenue significantly; American Airlines estimates that revenue management provides incremental revenue of one billion dollars annually. In fact, if it were not for the combined contributions of revenue management and airline schedule planning systems, American Airlines would have been profitable only one year in the last decade, see Cook (2000).
Although different industries may implement revenue management in various ways, there are a number of characteristics common to industries where revenue management is traditionally applicable. These characteristics include limited capacity, ability to segment the market, perishable inventory, advance purchase of product, variability in demand, and low marginal costs. Indeed, most industries that implement revenue management differentiate products and segment the market according to factors such as time of purchase and service level.
Of course, when applying revenue management techniques to non-service industries, some of the characteristics may change. For example, in the manufacturing industry, products may not necessarily be perishable, but instead, capacity may be
thought of as a perishable asset. In addition, segmenting customers according to customer lead time may be important since it allows manufacturers to better allocate production and distribution resources. That is, customers who need products, e.g., vehicles or PCs, quickly would pay for that service just as airline passengers who need to travel on short notice pay for the privilege of doing so. On the other hand, those with greater flexibility would pay less for their order. By better matching demand to supply and available capacity throughout the supply chain, overall revenue should increase, with those requiring premium service paying for the benefits of such service.
A recent study, see Chan, Simchi- Levi and Swann (2000), provides the following insights on the impact of dynamic pricing on supply chain performance:
1. Dynamic pricing has a significant impact on profit when capacities are tight and there is variability in either demand or capacity
2. Dynamic pricing is a useful lever to cope with the Bullwhip Effect and reduce variability both in sales and production schedules
3. A significant profit potential may be attained with only a few price changes 4. For a given supply chain, average price in dynamic pricing strategies is typically
below the best fixed-price strategy.
This implies that for companies to compete in the cutthroat environment of the Internet world, they must use more sophisticated pricing models. Indeed, dyna mic pricing, when implemented correctly, allows companies to decrease average price, increase sales and increase profit through supply chain efficiencies.
9 Conclusion
The Internet has created the opportunity to revolutionize old business models and in particular to implement new supply chain strategies. Indeed, the success of giants such as Dell Computers and Cisco and the significant market capitalization of newly established companies such as Amazon.com are mainly attributed to sophisticated Internet based supply chain strategies.
At the same time, the collapse of many dot.com companies sends an alarming message that E-business presents not only opportunities but also great challenges. Key to these challenges is the ability to identify the appropriate supply chain strategy for a particular company and individual products. Indeed, the premise that many of the dot.com companies have been built on that says that in the new e-conomy there is no need for either physical infrastructure or inventory has been disastrous. The new supply chain paradigm, Push-Pull strategy, advocates holding inventory albeit it pushes the inventory up-stream in the supply chain.
Of course, identifying the right structure of the supply chain, the appropriate level of collaboration with suppliers and customers, the effectiveness and the frequency of dynamic pricing strategies, and the appropriate visibility and planning tools, is anything but an easy task. Nevertheless, these are the new opportunities provided by the Internet, opportunities that allow companies to become industry leaders.
Acknowledgement: An extended version of this paper will appear in Volume 3 of the ASCET Project published by Montgomery Research. The first author would like to acknowledge insightful discussions with Mr. Yao Zhao.
References:
1. Chan, L. M. A., D. Simchi-Levi and J. Swann (2000) “Flexible Pricing Strategies to Improve Supply Chain Performance.” Working paper.
2. Chopra S. and J. Van Miegham (2000) “Which e-Business is Right for Your Supply Chain?”, Supply Chain Management Review July/August pp. 32-40
3. Cook, T. (2000) "Creating Competitive Advantage in the Airline Industry." Seminar sponsored by the MIT Global Airline Industry Program and the MIT Operations Research Center.
4. Fisher, M. L., J. Hammond, W. Obermeyer and A. Raman (1994) “Making Supply meet Demand in an Uncertain World." Harvard Business Review, May-June, pp. 83-93.
5. Gordon, F. (2000) “Supply chain collaboration? Behind the buzzword, Micron Electronics and Modus Media find real bottom-line benefits” American Shipper, December, pp. 22-26. 6. Hartman A. and J Sifonis (2000) “Net ready”, McGraw-Hill, pp. 259-263.