HAL Id: insu-00687919
https://hal-insu.archives-ouvertes.fr/insu-00687919
Submitted on 5 Mar 2021
HAL is a multi-disciplinary open access
archive for the deposit and dissemination of
sci-entific research documents, whether they are
pub-lished or not. The documents may come from
teaching and research institutions in France or
abroad, or from public or private research centers.
L’archive ouverte pluridisciplinaire HAL, est
destinée au dépôt et à la diffusion de documents
scientifiques de niveau recherche, publiés ou non,
émanant des établissements d’enseignement et de
recherche français ou étrangers, des laboratoires
publics ou privés.
Defrosting, dark flow features, and dune activity on
Mars: Example in Russell crater
Emilie Gardin, Pascal Allemand, Cathy Quantin, Patrick Thollot
To cite this version:
Emilie Gardin, Pascal Allemand, Cathy Quantin, Patrick Thollot. Defrosting, dark flow features,
and dune activity on Mars: Example in Russell crater. Journal of Geophysical Research. Planets,
Wiley-Blackwell, 2010, 115, pp.E06016. �10.1029/2009JE003515�. �insu-00687919�
for Full Article
Defrosting, dark flow features, and dune activity on Mars:
Example in Russell crater
E. Gardin,
1P. Allemand,
1C. Quantin,
1and P. Thollot
1Received 24 September 2009; revised 8 January 2010; accepted 19 January 2010; published 30 June 2010.
[1]
Defrosting processes observed on Mars are among the most unusual features described
on high
‐resolution images. A defrosting sequence has been observed near the crest of the
megadune located in the Russell crater on new high
‐resolution images obtained from
the HiRISE instrument and on hyperspectral cubes obtained from CRISM instrument, both
on board MRO. Hyperspectral images show that frost overlaps the entire megadune in
middle winter. This frost is composed mainly of CO
2and of a small amount of water ice.
The deepest ice signatures are mainly located near the crest of the megadune. The
defrosting sequence monitored by CRISM reveals spatial heterogeneity and refrosting
processes. On the morphological counterpart, the defrosting sequence starts with the
development of dark spots, similar to those described in the cryptic regions. After few sols,
we observe the emplacement of dark linear flow features that start from the dark spots
downward of the main slope of the dune. These linear flow features are 1 to 2 m wide and
50 to 100 m long. They settle on the small rills visible on the frost cover. They are
interpreted as avalanches of a mixing of sand, dust, and unstable CO
2gas released under
pressure. The avalanches would be triggered by the eruption of the dark spots. The flux
of material transported by the flow features has been estimated to 0.25 to 0.5 m
3by meter
width each year on the megadune. This flux is larger than flux transported by wind.
These dark flow features are thus very efficient to transport material on slopes located in
frosted areas.
Citation: Gardin, E., P. Allemand, C. Quantin, and P. Thollot (2010), Defrosting, dark flow features, and dune activity on Mars: Example in Russell crater, J. Geophys. Res., 115, E06016, doi:10.1029/2009JE003515.
1.
Introduction
[2] Among the various active Martian geomorphologic
processes, those related to defrosting are the most unusual. These defrosting processes have been revealed by high‐ resolution surveys over the past years [Albee et al., 1998; Zuber et al., 1998; Hansen, 1999; Kieffer et al., 2000; Thomas et al., 2000; Smith et al., 2001; Piqueux et al., 2003; Titus et al., 2003; Kieffer, 2007]. Each local winter lead to a sea-sonal polar cap composed by CO2and H2O ices [Titus et al.,
2003; Bibring et al., 2004]. At summer solstice time, the southern Martian pole is covered by a widespread seasonal CO2cap, which extends to 50°S of latitude. At the end of
the spring, this seasonal cap retreats leading to unusual features, which have been highly documented on Mars Orbiter Camera (MOC) images on board Mars Global Sur-veyor (MGS) mission [Malin et al., 1992]. The defrosting of the seasonal CO2cap leads to dark spots [Bridges et al.,
2001], spiders [Piqueux et al., 2003; Hansen et al., 2010],
polygonal structures [Kossacki and Markiewicz, 2002], and vents [Piqueux and Christensen, 2008].
[3] Dark spots are classically interpreted as dust and sand
accumulation around CO2 emitting geysers, which are
driven by solar energy which crosscut the transparent CO2
frost [Kieffer et al., 2000; Piqueux et al., 2003]. The CO2gas
produced at the interface between the frost and the bedrock erodes then the substratum along convergent channels and transports the eroded material to the vents, where it is ejected in the atmosphere, and falls down at a short distance from it [Piqueux et al., 2003; Kieffer et al., 2006; Kieffer, 2007]. After the defrosting, spider structures are visible in the substratum. These spiders consist in a collection of channels of several meter width which converge toward the point where the vent of the dark spot was. A plurimetric hole is located at the convergence of the channels, at the place of the dark spot.
[4] The high‐resolution images, MOC first, and now
High Resolution Imaging Science Experiment (HiRISE) [McEwen, 2007] on board of Mars Reconnaissance Orbiter (MRO), show these uncommon features further north in the southern hemisphere. Indeed, some south up facing scarps in middle latitudes are partly frosted during the local winter and display a defrosting sequence during the spring time retreat. This is the case of Russell crater (54.6°S and 12.4°E),
1Laboratoire de Sciences de la Terre, UMR 5570, Université de Lyon,
Université Lyon 1, Ecole Normale Supérieure, CNRS, Lyon, France. Copyright 2010 by the American Geophysical Union.
a large crater in the southern hemisphere that exposes a large dune field in its center.
[5] The present paper describes the sequence of active
features produced by defrosting on the megadune of Russell crater. We will present first the data set used and the geo-logical context of our observations. We will then expose the defrosting sequence in terms of frost distribution from both Compact Reconnaissance Imaging Spectrometer for Mars (CRISM) data [Murchie et al., 2007] and morphologic features from HiRISE images on board MRO mission. The present study leads to a discussion on both defrosting pro-cesses themselves and current transport mechanisms on dunes.
2.
Data Set
[6] MRO did a large effort on surveying the defrosting
sequences over the Russell megadune with HiRISE and CRISM. HiRISE is a camera which collects images at a resolution ranging from 0.25 to 1 m in a 6 km wide swath [McEwen, 2007]. HiRISE images on the dune field of the Russell crater were acquired at different times during the defrosting period. Some images were acquired only a few Martian days apart (Table 1). We studied 22 available HiRISE images on the Russell crater megadune, which completely covered the first year of HiRISE acquisition and the beginning of the second, from Ls 136° to Ls 191° of the second acquisition year (Table 1). For this study, the 22 HiRISE images were downloaded at full resolution, geoprocessed, and inserted in a Geographic Information System (GIS) in order to compare and measure the changes between each image.
[7] CRISM is the spectral imager on board of MRO that
measures the reflectance in the visible and near‐infrared wavelengths [Murchie et al., 2007]. In hyperspectral mode,
CRISM collects 544 wavelengths from 0.36 to 3.96 mm in ∼10–12 km wide swaths at 18–36 m pixel−1 resolution
[Murchie et al., 2007]. In the present study, we used only the near‐infrared data between 1 and 3.96 mm as diagnostic water and CO2ice features occur in the 1–2.5 mm range The
data were processed for instrumental effects, converted to I/F and the atmosphere was removed using a ratio with a CRISM scene of Olympus Mons, scaled to the same column density of CO2. All these processing were done with CRISM
Analysis Tool (CAT) v6.5, a public available application [Mustard et al., 2008] based on ENVI software. This soft-ware was released by the CRISM team for public to help the data exploitation. We processed the following images: FRT_39DF, HRS_4006, FRT_42AA, HRS_43BC and FRT_5339 that have been acquired from the solar longitude (Ls) 157° to 215°, covering a period from the middle winter to the end of spring (Table 1).
3.
Regional Context
[8] The defrosting features have been observed in Russell
crater which is a 134 km diameter depression located west of Hellas basin (Figure 1). This crater hosts a 1700 km2 dune field with an unusual large dune on its northeastern part of the dune field. This megadune, visible on Mars Observer Laser Altimeter (MOLA) data [Zuber et al., 1992], is about 500 m high, 20 km (with 2.5 km for the southwest facing slope) wide and 40 km long. It has been highly studied as its southwest facing scarp displays gullies [Mangold et al., 2003; Reiss and Jaumann, 2003]. They were interpreted as the result of liquid water bearing debris flows during recent climate changes related to Martian obliquity variations [Laskar et al., 2004]. This southwest facing slope is steep with an average slope of about 10°. The
Table 1. HiRISE Images and CRISM Hyperspectral Data Cube in Function of the Solar Longitude, the Martian Seasons of the Southern Hemisphere, and the Resolution of HiRISE Imagesa
Seasons HiRISE HiRISE Ls (deg) Resolution (cm pixel−1) CRISM CRISM Ls (deg) Dark Spots (low) Dark Spots (up) Dark Flows Polygons Dust Devils First Year of MRO Acquisition
Winter PSP_001440_1255 136.3 50 X PSP_001981_1255 157.7 50 FRT39DF 158 X X PSP_002337_1255 172.6 25 HRS4006 173 X X X PSP_002482_1255 178.9 25 FRT42AA 179 X X X Spring PSP_002548_1255 181.8 25 HRS43BC 182 X X X PSP_002904_1255 197.9 25 X X PSP_003326_1255 217.7 25 FRT5339 215 PSP_003748_1255 238.4 25 X PSP_004038_1255 252.7 25 X PSP_004249_1255 263.1 25 X Summer PSP_005238_1255 310.3 25 X PSP_005383_1255 316.8 25 FRT7F9E 323 X Autumn PSP_006873_1255 17.2 50 FRT966B 17 X PSP_007018_1255 22.5 25 PSP_007229_1255 30.1 50
Second Year of MRO Acquisition
Winter PSP_009879_1255 122.2 100 FRTC55B 122 X PSP_010090_1255 130.1 100 X X PSP_010301_1255 138.1 100 FRTCD8E 138 X PSP_010446_1255 143.7 50 X X PSP_010868_1255 160.6 50 X X Spring PSP_011580_1255 191.5 50 X X X
aHigh‐resolution observation of geomorphologic features are also reported: dark spots (low) for lower part of the megadune, dark spots (up) for upper
part of the megadune, dark flows for dark flow features, polygon for polygonal structure and dust devils.
GARDIN ET AL.: DEFROSTING SEQUENCE ON RUSSELL MEGADUNE E06016
E06016
slope is exposed to seasonal frost and we reported in the present study the defrosting sequence on it (Figure 1). The upper part of the southwest facing slope of the megadune is not resolved on MOLA data. However, shadows and lumi-nance variations on HiRISE images suggest that this slope is steeper just under the crest on a high of some tenths of meters. This part corresponds to heads of the gullies. The northeast facing slope of the megadune has an average slope of 2°. This northeast facing slope is reshaped by longitudinal (linear) dunes with a frontal progress toward the northeast. [9] The megadune can be interpreted as a transverse dune
built first by a wind trend coming from the northeast with a northeast facing slope interpreted as the windward slope and a southwest facing slope interpreted as the avalanche slope. After a first phase of building, the large transverse dune has been modified by a bidirectional regime of winds, coming mainly from SW and WNW, which have built the longitu-dinal dunes.
[10] Over the megadune, many ripples are observed. On
the southwest facing slope, the orientation of the ripples is mainly oblique to the crest of the megadune (NNW–SSE). On the northeast facing slope of the megadune, the orien-tation of the ripples is mainly parallel to the crest of the megadune. The shadow and luminance variations on the HiRISE images give an estimation of the ripple height of about 1.5 m and are typically 5 m apart. On the slipfaces of the longitudinal dunes, many ripples are also observed. The megadune’s ripples have the same wavelength than the aeolian ridges, visible during the summer when the dune is defrosted (Figure 4f). These particular ripples look like the Transversal Aeolian Ridges (TARs), observed by [Balme et al., 2008] above many dark Martian dune fields.
[11] Other geologic features are observed over the
megadune [Gardin et al., 2009a, 2009b] and their time of occurrence is reported in Table 1. During the cold seasons, polygonal structures, dark spots and dark flow features appear. In the warmer seasons, the defrosting features have
totally disappeared and many dust devils tracks are observed all over the megadune [Verba et al., 2009].
4.
Defrosting Sequence From CRISM Data
[12] The defrosting sequence on the Russell crater
megadune is recorded by CRISM data (Figure 2) at Ls 158°, 173°, 178°, and 182°. The spectra at these four successive times show several absorption bands diagnostic of CO2ice
at 1.435 and 2.35mm. The spectra also show also a weak but noticeable absorption band at 1.50mm, diagnostic of water ice. The CO2 ice is the dominant component of the ice
cover. The time evolution of the ice cover is illustrated in Figure 3. The maps represent the band depth of the spectra at 1.435 mm. The absorption band is an indicator of the amount and the purity of the CO2ice.
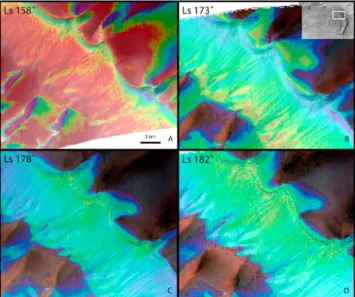
[13] The first CRISM observation has been taken during
the middle southern winter (Ls 158°) and shows that the CO2ice covers the entire megadune. The signature of CO2
ice is stronger on the lower part of the southwest facing slope of the megadune and on the northeast facing slope of the megadune, at the intersection of the southeast facing slope of the longitudinal dunes and the brink of the mega-dune (Figure 3a).
[14] After 20 Martian sols, the strongest CO2 ice
sig-natures are located along the brink of the megadune and at the lower part of the southwest facing slope of the megadune (Figure 3b). The northeast facing slope of the megadune is free of CO2ice excepted where longitudinal dunes connect
with the megadune brink. At Ls 173°, the CO2ice signatures
located just under the brink on the south facing scarp are weaker than the surrounding signatures all area show weaker signatures than at Ls 158°.
[15] At the end of winter (Ls 179°), the CO2ice signature
is generally weaker than at Ls 173°. We inferred that it is due to the defrosting action (Figure 3c). The spatial distri-bution of the CO2 ice is unchanged compared to Ls 158°
(the southwest facing slope of the megadune just under the brink and again on the southeast facing slipface of the longitudinal dunes of the northeast facing slope of the megadune) just at the junction between the longitudinal dunes and the brink of the megadune.
[16] Three sols after Ls 179°, the most intense signature of
CO2 ice is precisely located at the same place than at Ls
179°. The spatial resolution of the CRISM data cube taken at Ls 182° is twice lower than the one taken at Ls 179° thus with a signal/noise ratio doubled. One should therefore compare signatures from these two cubes with caution. Indeed, the CO2ice signature at Ls 182° (Figure 3d) appears
more intense than at Ls 179°. This particular observation could indicate (1) the cleaning of ice in which particles could migrate down (2) the darkening of the ice cover, which could become transparent enough to reveal the underlying rocky surface, and (3) the partial refrosting of the inactive dark flows by late CO2ice condensation from the atmosphere.
5.
Defrosting Sequence From HiRISE Data
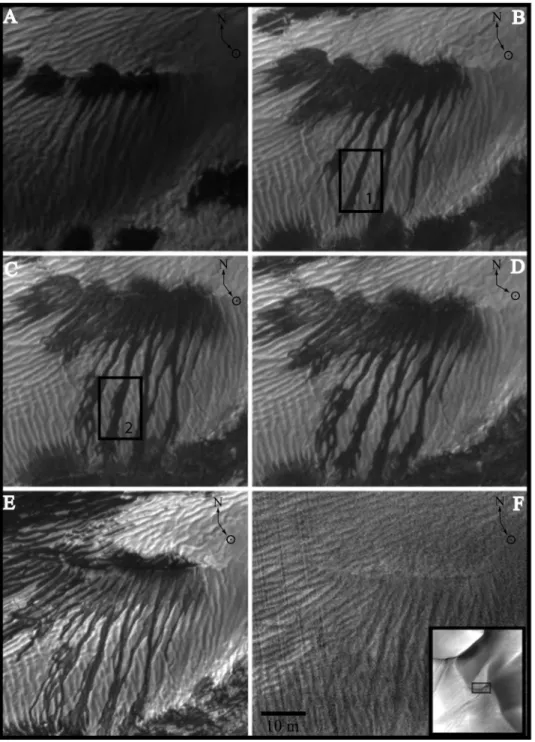
[17] The defrosting sequence over the southwest facing
slope of the megadune is illustrated on Figure 4. Dark spots appear first on the slope, while it is covered by frost, in the middle of the southern winter (Ls 158°) (Figure 4a). These Figure 1. Context of the Russell crater dune field. MOC‐WA
images show the dune field inside the Russell crater of 150 km diameter. It is located in the northeastern part (near the center) of the crater. The megadune can be seen in the northeastern part of the dune field and is composed by a steeper and south-west facing slope and a gentler and northeast facing slope.
5 m diameter dark spots are located on 100 m long linear bright up facing scarps. The surface of the frost is marked by 5 m large ridges which are oblique to the main slope. This implies that either aeolian ridges are visible by transparency under the frost, or that the frost is thin enough to mold the underlying ridge topography. The diameter of dark spots increases with time. After 15 sols (Ls 173°), the dark spots are coalescent and asymmetric (Figure 4b). They have developed downward and form continuous dark cover along the bright up facing scarps. Dark streaks are visible from the base of dark spots and extend downward the slope at about 100 m. These dark streaks are channelized at the surface. The channels of the dark streaks are sometime diverging and sometime converging. The dark material which marks the spots seems to have flowed between and sometimes over the ridges of about 5 m width. These dark streaks could result from the preferential defrosting between ridges or could be real flows of material from the dark spots over the CO2ice.
The hypothesis of local defrosting is not supported by both HiRISE and CRISM observations and physics of defrosting. The defrosting should be maximum on the most insulated part of the ridges and thus on their crest or near of it. The defrosting should be asymmetric at the scale of the ridges as the illumination conditions are. Here, the dark streaks are symmetric and located between ridges crests. This is in favor of the flow hypothesis and in the rest of this paper we will call these features “dark flows.” The image of the
Figure 2. Evolution of the defrosting over the Russell crater megadune observed by CRISM. Four CRISM I/F spectra taken at the base of the megadune at different Ls (offset of 0.5 for clarity). Theses spectra corresponding to Ls 158° until Ls 182° fit the CO2ice spectral signature mixed with a small
amount of water ice. Vertical bars indicate two main characteristics absorption band of CO2ice.
Figure 3. The four maps present the 1.435 mm band depth at different Ls overlapping a color composite (R, 2.5mm; G, 1.5mm; B, 1.25 mm). We used the BD1435 criteria from Pelkey et al. [2007]. The rainbow color ramp is stretched from 0.1 to 0.3, red color for more CO2ice and blue color for
few ices. (a) CRISM data FRT39DF (Ls 158°). (b) CRISM data HRS4006 (Ls 173°). (c) CRISM data FRT42AA (Ls 178°). (d) CRISM data HRS43BC (Ls 182°).
GARDIN ET AL.: DEFROSTING SEQUENCE ON RUSSELL MEGADUNE E06016
E06016
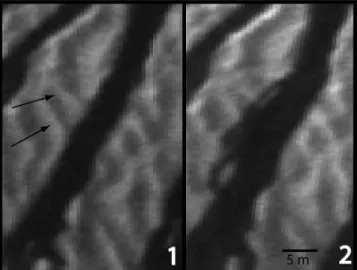
Figure 4c has been taken 6 sols after the previous one (Ls 179°). The geometry of the dark spots has not changed. The length and the number of most of the dark flows have increased. They join the other group of dark spots visible at the bottom of the image (in Figure 4). The dark flows are braided at their bases where they divide in small channels always located between the ridges. In more details (black box in the Figures 4b and 4c), the extremity of some dark flows seems to jump above the ridges which are at the frosty
surface (Figure 5). This is in favor of an inertial discontin-uous flow. The last two images of defrosting (Figures 4d and 4e) have been taken at only 16 Martian sols apart: 4d image in the early spring (Ls 182°) and 4e image in middle spring (Ls 198°). The dark flows are less active than before, in the middle winter. Only few of them have changed in length. In summer, the dune is completely defrosted (Figure 4f). The place of the starting point of dark spots and dark flows, which are visible in the winter frost, is occupied Figure 4. Evolution of the defrosting on the southwest facing slope of the megadune. (a) HiRISE
image PSP_001981_1225 (Ls 158°). (b) HiRISE image PSP_002337_1225 (Ls 173°). (c) HiRISE image PSP_002482_1225 (Ls 179°). (d) HiRISE image PSP_002548_1225 (Ls 182°). (e) HiRISE image PSP_002904_1225 (198°). (f) HiRISE image PSP_004038_1225 (Ls 252°). The insert in Figure 4f indi-cates the position of the observation.
by a horizontal up facing scarp, which could be more resistant than the surrounding rocks.
[18] The defrosting sequence on the northeast facing slope
is briefly illustrated in Figure 6. The dark spots appear in winter and are aligned on bright fractures visible in the frost cover, and mainly perpendicular to the crest of the mega-dune (Figures 6a and 6b). The size of the dark spots increases with time and they become coalescent along these bright
fractures. No flow features are visible. The aeolian ridges molded by the frost, are perpendicular to the main northeast facing slope and contribute to prevent the development of the dark flow features. On images taken during the Martian summer (Figures 6c and 6d), the defrosted surface displays structures which are quiet similar to the“spiders” described by Piqueux et al. [2003]. The position where the dark spots were located, is marked by radial channels which converge toward positive topographies (“bumpy spiders”) not observed on the south seasonal polar cap. These small knobs have a diameter of 3 to 5 m. Their height is difficult to estimate because their shadows were not observed probably due to the spherical bumpy shape and the very small height. They are aligned perpendicularly to the crest of the megadune because they follow the bright fractures. Close to the crest, ramified channels are observed with a global elongation aligned along the knob direction (“linear spiders”).
[19] The defrosting sequence located on the longitudinal
dune slipfaces above the northeast slope of the megadune is illustrated briefly in Figure 7. Numerous and contiguous dark spots appear on the southeast facing slipfaces of a longitudinal dune (Figure 7a) along several alignments perpendicular to the crest of the megadune. These align-ments are separated from about 150 m. Dark flow features similar to those described before appear on the Ls 198° HiRISE image (Figure 7b). However, they are smaller than the previous described ones. In summer (Figure 7c), the place occupied by dark spots consists in more or less con-tinuous up facing scarp. Above these scarps, channels converge toward the scarps. These channels would play a Figure 5. Close‐up of Figures 4b and 4c. Here, 1 is taken
at Ls 173°, and 2 is taken at Ls 179°. The resolution of the HiRISE images have been degraded for looking the evi-dence of ripples overpassed.
Figure 6. Evolution of defrosting on the northeast facing slope of the megadune, just under the brink. The north and subsolar azimuths are reported for each image. (a) HiRISE image PSP_002482_1225(179°), (b) HiRISE image PSP_002904_1225(198°). (c) HiRISE image PSP_004038_1255(252°). Transversal Aeolian Ridges (TARs) are oriented perpendicular to the main slope of the northeast facing slope. (d) Sketch of Figure 6c showing the geometry of the spiders with central bumps. The black circles symbolize the hill of the bumpy spiders. The widest black curves represent the bright fractures (or linear spiders), where dark spots will appear during the wintertime. They are perpendicular to the crest of the megadune. The small black lines are channels, which converge to the bump (black circle). (e) Close‐up of one typical bumpy spider.
GARDIN ET AL.: DEFROSTING SEQUENCE ON RUSSELL MEGADUNE E06016
E06016
similar role than the channel observed under the seasonal polar cap [Piqueux and Christensen, 2008; Hansen et al., 2010] but the overall shape of the structure is asymmetric (“asymmetric spiders”).
6.
Discussion: Model of Formation of the Seasonal
Patterns and Flux of Material on Dune Flanks
[20] On the southwest facing slope of the Russell crater
dune field’s megadune, the dark spots are mainly located on
discontinuous up facing scarps in the upper part and on small hills on the lower part. The reasons of this preferential location can be explained (1) by the thickness of frost which could be thinner on those abrupt zones or mechanically less resistant due to strain stresses or (2) by the CO2gas, which
could accumulate preferentially in these particular points. As the rheology of CO2ice is unknown, it is difficult to test
physically these hypotheses. It is however noticeable that the dark spots are localized by heterogeneities at the dune surface. The spiders described on the Russell megadune are not similar to those already described more at the south pole [Kieffer et al., 2000; Piqueux et al., 2003]. Spiders visible under the seasonal south polar cap have a symmetric shape and a hole in their center, just above the vent of the dark spot. In Russell crater, the spiders never have holes in their centers. The channels converge toward positive topo-graphies, which are linear on the major south facing scarp and punctual bumps on north facing scarps. When the slope is not steep, the geometry of spiders is symmetric (Figure 6a) and the center is occupied by a positive bump. When the slope is steep, the channels are developed above the up facing scarps indicating that most flow features comes from above these heterogeneities (Figures 4b–4e). Another class of asymmetric spiders develops near the crest of the megadune. They converge neither to a hole nor to a hill but end at the crest of the megadune (Figure 6b).
[21] Spectral analyses of the CRISM data confirm the
presence of CO2 ice above the megadune (Figure 3) and
reveal the time evolution of the ice cover between Ls 158° and 197°. Moreover, a thin amount of water ice has also been detected. This implies that the superficial part of the ice slab is composed by a mixing of CO2 ice and a small
amount of H2O ice.
[22] Dark flow formation is not a continuous process but
seem to be episodic and with a velocity sufficient for dark flow features override small topographies. Three hypotheses can be proposed: (1) the occurrence of the dark flows is triggered by the geyser activity, each geyser emission pro-duces one dark flow, (2) the dark flows are independent from geyser activity and occur when enough particle has accumulated at the base of the dark spot, or (3) the dark flows are active each day when the particle temperature is high enough for the underlying CO2ice to sublimate. Some
mechanical properties of the dark flows can be assessed by their geometrical characteristics. The dark flows are clearly channelized by the aeolian ridges molding the surface of the frost. Moreover, the contours of the dark flows are bright and net. The width of the aeolian ridges overpassed by dark flows has been measured between 1 and 2 m. If one assumes that the aeolian ridge is between 0.5 to 1.5 m high, the dark flow velocity can be estimated using the principle of energy conservation in mechanics from the equation
1
2mv2¼ mgh ð1Þ
where m is mass of the dark flow, v is velocity of the dark flow, g is Martian gravity, and h is the height of ridge, overridden by a dark flow. The velocity can thus be approximated by
v ¼pffiffiffiffiffiffiffiffi2gh ð2Þ
Figure 7. Evolution of defrosting on the slope of a longitu-dinal dune located on the northeastern side of the megadune. The north and subsolar azimuths are reported for each image. (a) HiRISE image PSP_002337_1225(173°). (b) HiRISE image PSP_002904_1225(198°). (c) HiRISE image PSP_007018_1255(22.5°). (d) Sketch of Figure 7c showing the geometry of the asymmetric spiders. The black circles symbolized the hills of the bumpy spiders. The bold black lines are the up facing scarps above the slip face of the longitudinal (linear) dunes of the northeast facing slope. The thin black lines represent the channels of the asymmetric spiders.
In the studied case, for a height ranging from 0.5 to 2 m and a gravity of 3.7 m s−2, the velocity ranges from 2 to 4 m s−1. [23] With such a velocity under the Martian low gravity,
the material of the dark flows has to be cohesive to maintain a channelized aspect. This cohesion can be due to (1) electro-static forces between small particles or (2) large diameter of particles.
[24] The amount of material of a single flow feature can
be estimated from its geometric characteristics. The length of one dark flow is generally around 50 m to 100 m for a width of around 2 m. The thickness of the dark flows is unknown. Kieffer et al. [2006] has shown that the CO2frost
becomes unstable under or near a frost cover of some cen-timeters. We assume that the thickness of the dark flows is less than 0.05 m. For instance, if the layer thickness is about 1 cm, the volume of a single flow ranges from 1 to 2 m3. If we consider that the dark flows occupy 50% of the surface of the upper part of the southwest facing slope of the megadune, the average flux along this slope ranges from 0.25 to 0.5 m3by meter width by years. If the density of particles is around 3000 kg m–3, 750 to 1500 kg of particles pass per meter width of dune and by year by this process.
[25] The flux of material transported by wind is difficult to
estimate on Mars. However, Claudin and Andreotti [2006] propose that dunes are active only during large storms a few times a decade. No evidence of dune displacement has been observed from the first missions indicating that the present‐day sand flux driven by wind is very small [Bourke et al., 2004; Livingstone et al., 2007; Hugenholtz, 2008; E. Gardin et al., Dune footprints suggest past dune migration and possible geochemical cementation of aeolian dunes on Mars, submitted to Icarus, 2010]. The observation of dis-placement of material on the dune can argue in favor that the dune is currently eroded at this particular part of the southwest facing slope of the dune.
[26] The occurrence of the dark flows on the track of the
gullies present on the megadune of Russell raises the issue of their genetic relationship. First, from a morphological point of view, gullies are linear and symmetric with levees although the dark flows are channelized and anastomosed. Gullies are also 1 order in magnitude larger than the dark flow reported here. Second, there is a difference in age. Gullies are in the first order unchanged morphologies under current conditions whereas the dark flows are seasonal and therefore active processes under current Martian climate. Previous works on gullies activity estimated their age at around 100,000 years [Reiss and Jaumann, 2003]. Our observations do not allow us to determine if there is a connection between gullies and dark flows as they emplace in same location.
[27] However our study proposes that the dark flows
initiate from the up facing scarps. We interpret the up facing scarps as a more resistant rocky layer that is outcropping on the slope. The presence of such up facing scarps in the upper part of the slope argues for erosionnal processes in oppo-sition to depooppo-sition processes at the base of the slope. The gullies formation would be generated by an erosion event [Costard et al., 2002; Mangold et al., 2003; Reiss and Jaumann, 2003; Hugenholtz, 2008]. This hypothesis is supported by the observation of many alcoves just above the gullies. The unique geological assessment we can propose here is that up facing scarps and gullies require an erosion
area of the upper part of the slope. Future works will be conducted to analyze in more details the relation between gullies and dark flow features.
7.
Conclusion
[28] The defrosting of the Russell crater’s megadune starts
in the middle of winter (Ls 136°) by the development of dark spots, which nucleate on positive topographies of the rocky substratum. These topographies are linear on the southwest facing slope of the megadune or punctual on the northeast facing slope. On the upper part of the southwest facing slope, dark flow features start from the dark spots. Theses dark flow features are channelized between aeolian ridges, which exist over the surface of the megadune. The activity of these dark flow features is episodic and inertial with a minimum velocity of 2 to 4 m s−1. On the images taken during the summer new classes of spiders have been observed, which develop instead of the dark spots. On the northeast facing slope of the megadune the spiders are symmetric with a hill in their center. On the southwest facing slope the spiders are asymmetric with their channels concentrated above the bright up facing scarps indicating that the dark flows came from above up facing scarps. The defrosting history is not a continuous process. CRISM cubes have revealed that refrosting occurs in spring just under the brink of the megadune.
[29] Acknowledgments. We wish to thank S. Piqueux and an anony-mous reviewer for their detailed remarks and very useful discussions. We wish to thank B. Schmidt, S. Douté, and the team of the Laboratoire de plane-tologie de Grenoble, F. Forget, C. Pilorget, Y. Langevin, and M. Vincendon, for helpful discussion. The authors acknowledge the HiRISE and CRISM teams for the public availability of the data. This work was supported by the program“Cibles 2006” of the “Région Rhône Alpes, France.”
References
Albee, A. L., F. D. Palluconi, and R. E. Arvidson (1998), Mars Global Surveyor Mission: Overview and status, Science, 279, 1671–1672, doi:10.1126/science.279.5357.1671.
Balme, M. R., D. Bermann, M. C. Bourke, and J. R. Zimbelman (2008), Transverse Aeolian Ridges (TARs) on Mars, Geomorphology, 101, 703–720, doi:10.1016/j.geomorph.2008.03.011.
Bibring, J.‐P., et al. (2004), Perennial water ice identified in the south polar cap of Mars, Nature, 428, 627–630, doi:10.1038/nature02461. Bourke, M. C., J. E. Bullard, and O. S. Barnouin‐Jha (2004), Aeolian
sediment transport pathways and aerodynamics at troughs on Mars, J. Geophys. Res., 109, E07005, doi:10.1029/2003JE002155. Bridges, N. T., K. E. Herkenhoff, T. N. Titus, and H. H. Kieffer (2001),
Ephemeral dark spots associated with Martian gullies, Lunar Planet. Sci., XXXII, Abstract 2126.
Claudin, P., and B. Andreotti (2006), A scaling law for aeolian dunes on Mars, Venus, Earth, and for subaqueous ripples, Earth Planet. Sci. Lett., 252(1–2), 30–44, doi:10.1016/j.epsl.2006.09.004.
Costard, F., F. Forget, N. Mangold, and J. P. Peulvast (2002), Formation of recent Martian debris flows by melting of near‐surface ground ice at high obliquity, Science, 295, 110–113, doi:10.1126/science.1066698. Gardin, E., C. Quantin, and P. Allemand (2009a), Defrosting sequence on
the Russell megadune, Mars, Lunar Planet. Sci., XL, Abstract 2032. Gardin, E., C. Quantin, P. Allemand, and P. Thollot (2009b), Dark spot and
dark flow development during the seasonal frost retreat on the Russell crater megadune, Mars, paper presented at Third International Workshop on Mars Polar Energy Balance and CO2cycle, Abstract 7013, Lunar
Planet. Inst., Seattle, Washington, 21–24 July.
Hansen, C. J., N. Thomas, G. Portyankina, A. McEwen, T. Becker, S. Byrne, K. Herkenhoff, H. Kieffer, and M. Mellon (2010), HiRISE observations of gas sublimation‐driven activity in Mars’ southern polar regions: I. Ero-sion of the surface, Icarus, 205(1), 283–295, doi:10.1016/j.icarus. 2009.07.021.
GARDIN ET AL.: DEFROSTING SEQUENCE ON RUSSELL MEGADUNE E06016
E06016
Hansen, G. B. (1999), Control of the radiative behavior of the Martian polar caps by surface CO2ice: Evidence from Mars Global Surveyor
measure-m e n t s , J. Geophy s. Res. , 104, 16,471–16,486, doi:10.1029/ 1998JE000626.
Hugenholtz, C. H. (2008), Frosted granular flow: A new hypothesis for mass wasting in Martian gullies, Icarus, 197(1), 65–72, doi:10.1016/j. icarus.2008.04.010.
Kieffer, H. H. (2007), Cold jets in the Martian polar caps, J. Geophys. Res., 112, E08005, doi:10.1029/2006JE002816.
Kieffer, H. H., T. N. Titus, K. F. Mullins, and P. R. Christensen (2000), Mars south polar spring and summer behavior observed by TES: Sea-sonal cap evolution controlled by frost grain size, J. Geophys. Res., 105, 9653–9699, doi:10.1029/1999JE001136.
Kieffer, H. H., P. R. Christensen, and T. N. Titus (2006), CO2jets formed
by sublimation beneath translucent slab ice in Mars’ seasonal south polar ice cap, Nature, 442, 793–796, doi:10.1038/nature04945.
Kossacki, K. J., and W. J. Markiewicz (2002), Martian seasonal CO2ice in
polygonal troughs in southern polar region: Role of the distribution of subsurface H2O ice, Icarus, 160(1), 73–85, doi:10.1006/icar.2002.6936.
Laskar, J., A. C. M. Correia, M. Gastineau, F. Joutel, B. Levrard, and P. Robutel (2004), Long term evolution and chaotic diffusion of the insolation quantities of Mars, Icarus, 170(2), 343–364, doi:10.1016/j. icarus.2004.04.005.
Livingstone, I., G. F. S. Wiggs, and C. M. Weaver (2007), Geomorphology of desert sand dunes: A review of recent progress, Earth Sci. Rev., 80(3–4), 239–257, doi:10.1016/j.earscirev.2006.09.004.
Malin, M. C., G. E. Damielson, A. P. Ingersoll, H. Masursky, J. Veverka, M. A. Ravine, and T. A. Soulanille (1992), Mars Observer Camera, J. Geophys. Res., 97, 7699–7718, doi:10.1029/92JE00340.
Mangold, N., F. Costard, and F. Forget (2003), Debris flows over sand dunes on Mars: Evidence for liquid water, J. Geophys. Res., 108(E4), 5027, doi:10.1029/2002JE001958.
McEwen, A. S. (2007), Mars Reconnaissance Orbiter’s High Resolution Imaging Science Experiment (HiRISE), J. Geophys. Res., 112, E05S02, doi:10.1029/2005JE002605.
Murchie, S., et al. (2007), Compact Reconnaissance Imaging Spectrometer for Mars (CRISM) on Mars Reconnaissance Orbiter (MRO), J. Geophys. Res., 112, E05S03, doi:10.1029/2006JE002682.
Mustard, J. F., et al. (2008), Hydrated silicate minerals on Mars observed by the Mars Reconnaissance Orbiter CRISM instrument, Nature, 454, 305–309, doi:10.1038/nature07097.
Pelkey, S. M., et al. (2007), CRISM multispectral summary products: Parameterizing mineral diversity on Mars from reflectance, J. Geophys. Res., 112, E08S14, doi:10.1029/2006JE002831.
Piqueux, S., and P. R. Christensen (2008), North and south subice gas flow and venting of the seasonal caps of Mars: A major geomorphological agent, J. Geophys. Res., 113, E06005, doi:10.1029/2007JE003009. Piqueux, S., S. Byrne, and M. I. Richardson (2003), Sublimation of Mars’
southern seasonal CO2ice cap and the formation of spiders, J. Geophys.
Res., 108(E8), 5084, doi:10.1029/2002JE002007.
Reiss, D., and R. Jaumann (2003), Recent debris flows on Mars: Seasonal observations of the Russell crater dune field, Geophys. Res. Lett., 30(6), 1321, doi:10.1029/2002GL016704.
Smith, D. E., M. T. Zuber, and G. A. Neumann (2001), Seasonal variations of snow depth on Mars, Science, 294, 2141–2146, doi:10.1126/science. 1066556.
Thomas, P. C., M. C. Malin, K. S. Edgett, M. H. Carr, W. K. Hartmann, A. P. Ingersoll, P. B. James, L. A. Soderblom, J. Veverka, and R. Sullivan (2000), North–south geological differences between the residual polar caps on Mars, Nature, 404, 161–164, doi:10.1038/35004528.
Titus, T. N., H. H. Kieffer, and P. R. Christensen (2003), Exposed water ice discovered near the south pole of Mars, Science, 299, 1048–1051, doi:10.1126/science.1080497.
Verba, C. A., P. E. Geissler, and the HiRise Team (2009), Comparative anaylsis of Martian dust devil track morphologies in Gusev and Russell craters, Lunar Planet. Sci., XL, Abstract 1979.
Zuber, M. T., D. E. Smith, S. C. Solomon, D. O. Muhleman, J. W. Head, J. B. Garvin, J. B. Abshire, and J. L. Bufton (1992), The Mars Observer Laser Altimeter investigation, J. Geophys. Res., 97, 7781–7797, doi:10.1029/92JE00341.
Zuber, M. T., et al. (1998), Observations of the north polar region of Mars from the Mars Orbiter Laser Altimeter, Science, 282, 2053–2060, doi:10.1126/science.282.5396.2053.
P. Allemand, E. Gardin, C. Quantin, and P. Thollot, Laboratoire de Sciences de la Terre, UMR 5570, Université de Lyon, Université Lyon 1, Ecole Normale Supérieure, CNRS, 2 rue Raphaël Dubois, Lyon, F‐69622, Villeurbanne CEDEX, France. (emilie.gardin@ens‐lyon.fr)