HAL Id: hal-00298069
https://hal.archives-ouvertes.fr/hal-00298069
Submitted on 22 Feb 2007
HAL is a multi-disciplinary open access
archive for the deposit and dissemination of
sci-entific research documents, whether they are
pub-lished or not. The documents may come from
teaching and research institutions in France or
abroad, or from public or private research centers.
L’archive ouverte pluridisciplinaire HAL, est
destinée au dépôt et à la diffusion de documents
scientifiques de niveau recherche, publiés ou non,
émanant des établissements d’enseignement et de
recherche français ou étrangers, des laboratoires
publics ou privés.
for the past 400 years
O. Solomina, G. Wiles, T. Shiraiwa, R. d’Arrigo
To cite this version:
O. Solomina, G. Wiles, T. Shiraiwa, R. d’Arrigo. Multiproxy records of climate variability for
Kam-chatka for the past 400 years. Climate of the Past, European Geosciences Union (EGU), 2007, 3 (1),
pp.119-128. �hal-00298069�
Clim. Past, 3, 119–128, 2007 www.clim-past.net/3/119/2007/
© Author(s) 2007. This work is licensed under a Creative Commons License.
Climate
of the Past
Multiproxy records of climate variability for Kamchatka for the
past 400 years
O. Solomina1, G. Wiles2, T. Shiraiwa3, and R. D’Arrigo4
1Institute of Geography RAS, 119017 Staromonetny-29, IGRAS, Moscow, Russia 2The College of Wooster, Wooster, Ohio, USA
3Research Institute for Humanity and Nature, Kyoto, Japan
4Tree Ring Laboratory, Lamont Doherty Earth Observatory, Palisades, New York, USA Received: 4 August 2006 – Published in Clim. Past Discuss.: 1 November 2006 Revised: 7 February 2007 – Accepted: 9 February 2007 – Published: 22 February 2007
Abstract. Tree ring, ice core and glacial geologic histories for the past several centuries offer an opportunity to char-acterize climate variability and to identify the key climate parameters forcing glacier expansion in Kamchatka over the past 400 years. A newly developed larch ring-width chronol-ogy (AD 1632–2004) is presented that is sensitive to past summer temperature variability. Individual low growth years in the larch record are associated with several known and pro-posed volcanic events from the Northern Hemisphere. The comparison of ring width minima and those of Melt Fea-ture Index of Ushkovsky ice core helps confirm a 1–3 year dating accuracy for this ice core series over the late 18th to 20th centuries. Decadal variations of low summer temper-atures (tree-ring record) and high annual precipitation (ice core record) are broadly consistent with intervals of positive mass balances measured and estimated at several glaciers in 20th century, and with moraine building. According to the tree-ring data the 1860s–1880s were the longest coldest in-terval in the last 350 years. The latest part of this period (1880s) coincided with the positive anomaly in accumula-tion. This coincidence led to a positive mass balance, which is most likely responsible for glacier advances and moraine deposition of the end of 19th-early 20th centuries. As well as in some other high latitude regions (Spitsbergen, Polar Urals, Franz Jozef Land etc.) in Kamchatka these advances marked the last millennium glacial maximum. In full agreement with subsequent summer warming trend, inferred both from in-strumental and tree ring data, glacier advances since 1880s have been less extensive. The late 18th century glacier ex-pansion coincides with the inferred summer temperature de-crease recorded by the ring width chronology. However, both the advance and the summer temperature decrease were less prominent that in the end of 19th century. Comparisons of the glacier history in Kamchatka with records from Alaska Correspondence to: O. Solomina
and the Canadian Rockies suggests broadly consistent inter-vals of glacier expansion and inferred summer cooling during solar irradiance minima.
1 Introduction and study area
Modern, near-global retreat of glaciers in response to ris-ing temperatures is a clear demonstration of the relevance of glacier variations as a climate proxy (Oerlemans, 2001; Hoelzle et al., 2003). However the accuracy of moraine dat-ing, the uncertain time lag between the climatic signal and glacier fluctuations, as well as the unknown relative contri-bution of various climate forcings have limited the use of glacial histories in modern quantitative reconstructions. The interpretation of the climatic significance of advance or re-treat has also been a limitation on the use of these glacial geologic data as the signal can be interpreted as a mixture of precipitation and temperature. In Kamchatka this question is particularly relevant as this is a coastal region, similar in climate to coastal Norway and New Zealand where glacier behavior may, in part, be strongly regulated by precipitation as well as temperature (Muraviev et al., 1999; Chinn, 1999; Nesje and Dahl, 2003).
The Kamchatka Peninsula (56◦N 160◦E) is 1600 km long, and up to 500 km wide at its widest (Fig. 1) and supports 29 active and about 300 extinct volcanoes. Most of the glaciers of Kamchatka (446 glaciers covering about 900 km2)are lo-cated in the Sredinny and Eastern Ranges, along the coast of the Peninsula (Fig. 1). The orientation of the mountain ranges protects the inner regions of the Peninsula from the in-fluence of the North Pacific so that the climate in the interior is more continental. The climate along the coastal margins is cool and maritime. Annual precipitation is 600–1100 mm in the high mountains ranges and up to 2500 mm along the coast. Mean annual temperature is about 0◦C in the south at Petropavlovsk-Kamchatsky city. Winters are cool, snowy
Sheveluch Kliuchevkoy Plosky Tolbachik Ushkovsky Avacha Volcanoes
Villages and meteorological stations ESSO
Kliuchy
Petropavlovsk-Kamchatsky
City
ESS, ESN, BY, KEL
KR, KTL BAR SHI,SHE AV KR, KTL Tree-ring sites Glaciers 1 1- Koryto, Avgusty 2- Gorshkova (Ushkovsky) 3- Kropotkina 4- Kozelsky 3 2 4 5 - Grechishkina 5 Sredinny Range Easter n Range Pacific Ocean Okhotsk Sea
Fig. 1. Study area showing the location of tree-ring, glacier, ice core sites and meteorological stations used in this study.
and windy, and summers are wet and cloudy. Glaciers oc-cupy a wide altitudinal range from 300 to 4500 m a.s.l. and equilibrium line altitudes range from 700 m in the Kronotsky Peninsula to 2800 m on Kliuchevskoy volcano (Fig. 1). Four vegetation belts are distinguished on the slopes of the moun-tains facing the Central Kamchatka depression. The dendro-climatically important species, spruce and larch (Larix ca-jandery Mayr.) forests grow generally up to 300–350 m ele-vation and in places larch trees rise up to 1000 m. Stone birch (Betula ermanii Cham.) reach up to 600–800 m and creeping pine, alder, and willow reach altitudes up to 1000 m. Alpine meadows and mountain tundra dominate the elevation near the glaciers.
Historical descriptions of glaciers in Kamchatka go back to the early 20th century with mass balance measurements
at several glaciers begun during the International Geophys-ical Year in 1957 (Vinogradov, 1975; Vinogradov and Mu-raviev, 1992). In order to extend these observations into the past, moraines have been dated using tree-rings, lichenom-etry, tephrochronology and radiocarbon (Solomina, et al., 1995; Solomina, 1999; Golub, 2002). Solomina and Calkin (2003) summarized these results and determined the main pe-riods of glacier advance for the last 400 years.
This study adds to the growing development and analy-sis of proxy records from the western North Pacific Rim in-cluding the Kurile Islands (Jacoby et al., 2004; Solomina et al., 2005), and Hokkaido, Japan (Davi et al., 2002). Much of the motivation in exploring the variability across the Pa-cific basin was spurred by the 1976 transition in PaPa-cific cli-mate and the subsequent interest in Pacific Decadal Variabil-ity (Mantua et al., 1997).
In this paper we compare the glacial histories in Kam-chatka with two climatic proxies: a ring-width based warm-season temperature record, and an ice-core based annual precipitation record (Shiraiwa et al., 1997, 1999, 2001). This comparison helps to identify the climatic signals re-lated to glacier advances in Kamchatka as solid precipita-tion and summer temperature are the two primary drivers of glacier mass balance (Patterson, 1994). Glaciers act as a low-pass filter responding to decadal and century-scale cli-mate changes by length changes. Due to the low frequency nature of the glacier record, we use smoothed values of the annually-dated tree-ring and ice core proxies to empha-size the decadal fluctuations for comparison with the glacier record. We also use the inferred temperature histories based on ring-width data and the Melt Feature Index (MFI) from the Ushkovky ice core to provide an assessment of the dating accuracy of the ice core records.
2 Climate and proxy records
2.1 Climate
Meteorological records, tree-ring chronologies, ice cores and glacier moraines used in this paper (Fig. 1) were primar-ily chosen with the goal of understanding regional climate change and glacier response to this change.
Regular meteorological observations in Kamchatka began in the 1880s in Petropavlovsk, which is located at the Pa-cific coast in southern Kamchatka. The climate of the in-ner Kamchatka is substantially different from the southern maritime regions therefore we used the shorter observations for Kliuchy and Esso meteorological stations which are lo-cated in the vicinity of most of our proxy records (Fig. 1). The climate data were obtained from http://climate.mecom. ru/climate/bulletins/bul03v02.pdf.
Recent (1920s–2000) trends in temperature and precipi-tation in inner Kamchatka are best represented from Kli-uchy (Fig. 2a, b). Temperature records from KliKli-uchy station
O. Solomina et al.: Climate variability for Kamchatka for the past 400 years 121 DJF y = 0.0075x - 29.47 R2= 0.1179 -24 -20 -16 -12 -8 1900 1920 1940 1960 1980 2000 Years T emperatrure, C MAM y = 0.0132x - 28.551 R2= 0.338 -10 -8 -6 -4 -2 0 2 1900 1920 1940 1960 1980 2000 Years T emperatrure, C JJA y = 0.0057x + 1.1779 R2= 0.1849 10 11 12 13 14 15 16 1900 1920 1940 1960 1980 2000 Years T emperatrure, C SON y = 0.0113x - 21.06 R2= 0.3244 -2 0 2 4 6 1900 1920 1940 1960 1980 2000 Years T emperatrure, C HYDROLOGICAL YEAR y = 0.2698x + 94.492 R2= 0.0143 200 400 600 800 1000 1920 1940 1960 1980 2000 Years DJF y = 0.6218x - 1031.4 = 0.1951 0 100 200 300 400 1920 1940 1960 1980 2000 Years
A
B
R2 P recipitation, mm P recipitation, mmPRECIPITATION
TEMPERATURE
O O O OFig. 2. Temperature (A) and precipitation (B) record from Kliuchy meteorological station in Kamchatka.
(Fig. 2a) reflect the influence of the Siberian anticyclone and cold current along the coast. There are significant positive trends in the fall, spring and summer with warming becoming more pronounced in 1970s. The instrumental record at Kli-uchy also shows an increase in winter (DJF) precipitation in central Kamchatka since the 1930s (Fig. 2b). A coherence of temperature variations with PDO is evident in the smoothed records (e.g. 11-years running mean, Fig. 3b), however one can also see that the relationship is not stable through time, and there is a substantial difference between southern mar-itime and northern “continental” records.
2.2 Tree ring records
Few tree-ring records are available for Kamchatka and most chronologies have been developed from the interior of the Peninsula where the extensive larch forests thrive. In one of the first dendroclimatic studies Gostev et al. (1996) used a larch ring width chronology from 12 living trees at the Bystraya site (BY; Table 1; Fig. 1), to estimate early summer temperature. This preliminary reconstruction explained 38% of the variance of May-June temperature. More chronolo-gies have subsequently been developed (Table 1) including larch ring-width series from three locations near the upper tree limit in the vicinity of the Village of Esso (ESS, ESN, KEL), two sites from the upper tree line at Tolbachik (KR, KTL), a chronology from the Shiveluch active volcanoes
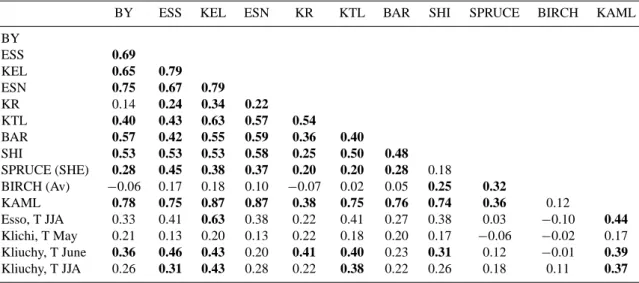
Table 1. Correlation matrix for tree-ring records from the Kamchatka Peninsula. In addition to the comparisons between sites correlations of May, June and summer (May-August) temperatures for Esso and Kliuchy meteorological stations are also shown. Correlations significant at the 99% level are in bold.
BY ESS KEL ESN KR KTL BAR SHI SPRUCE BIRCH KAML
BY ESS 0.69 KEL 0.65 0.79 ESN 0.75 0.67 0.79 KR 0.14 0.24 0.34 0.22 KTL 0.40 0.43 0.63 0.57 0.54 BAR 0.57 0.42 0.55 0.59 0.36 0.40 SHI 0.53 0.53 0.53 0.58 0.25 0.50 0.48 SPRUCE (SHE) 0.28 0.45 0.38 0.37 0.20 0.20 0.28 0.18 BIRCH (Av) −0.06 0.17 0.18 0.10 −0.07 0.02 0.05 0.25 0.32 KAML 0.78 0.75 0.87 0.87 0.38 0.75 0.76 0.74 0.36 0.12 Esso, T JJA 0.33 0.41 0.63 0.38 0.22 0.41 0.27 0.38 0.03 −0.10 0.44 Klichi, T May 0.21 0.13 0.20 0.13 0.22 0.18 0.20 0.17 −0.06 −0.02 0.17 Kliuchy, T June 0.36 0.46 0.43 0.20 0.41 0.40 0.23 0.31 0.12 −0.01 0.39 Kliuchy, T JJA 0.26 0.31 0.43 0.28 0.22 0.38 0.22 0.26 0.18 0.11 0.37 0.92 0.94 0.96 0.98 1 1.02 1.04 1.06 1880 1900 1920 1940 1960 1980 2000 -15 -10 -5 0 5 10 15 20 Years JJA T (deviation from mean) JJA PDO (deviation from mean) Kliuchy Petropavlovsk
Fig. 3. JJA PDO (Mantua et al., 1997), JJA mean temperature mea-sured at Petropavlovsk and Kliuchy meteorological stations (devia-tions from mean).
(SHI) and one from Kronotsky Peninsula (BAR) (Table 1, Fig. 1). In addition, a preliminary spruce (SHE) and birch (AV) ring-width series are also available from the Shiveluch and Avacha volcanoes, respectively.
Larch chronologies from Kamchatka correlate well (Ta-ble 1) with each other, except for the KR site from the active Tolbachik volcano, which may be influenced by local volcan-ism. One might have expected differences in climate signals between the inland larch sites and the more maritime BAR site on the Kronotsky Peninsula. However differences ap-pear to be minor as BAR correlates well with the other larch chronologies (Table 1). The spruce chronology also com-pares well with the larch series, but with a weaker correlation (Table 1).
COFECHA was used (Holmes, 1983) for crossdating and quality control, and ARSTAN (Cook, 1985) for chronology development adopting a conservative detrending of negative exponential and straight line curve fits. We combined the larch series (individual samples) into a regional chronology (KAML; Fig. 4) using standard dendroclimatological pro-cedures (Cook and Kairiukstis, 1990). The final chronol-ogy includes 144 cores for the period AD 1632–2003 with a mean series intercorrelation of 0.65 and an average mean sensitivity of 0.32. The chronology has 22 missing rings in the years 1778, 1857, 1864, 1865, 1867, 1877, 1926, 1927 and 1947. This regional chronology compares well with the BY chronology (Gostev et al., 1996) on both annual and decadal timescales (Fig. 4), except for early in the record, when the sample size is small, and towards the end when an-thropogenic disturbances are likely at the BY site after 1940. Most tree-ring chronologies from Kamchatka are temper-ature sensitive and have significant correlations with May, June, and summer (JJA) temperatures (Table 1). These larch chronologies (Table 1) are better correlated with the inte-rior Kliuchy and Esso stations than the coastal station at Petropavlovsk. The correlation of larch chronologies with summer temperature is significant and consistent, but for most of them it is not strong enough for a formal reconstruc-tion. Therefore we use a regional larch chronology (KAML) as a better replicated and more representative of regional cli-mate to infer summer temperature variations (see also Fig. 4). 2.3 Ice core records
In addition to tree-ring records from Kamchatka, ice cores reveal considerable information about past temperature and
O. Solomina et al.: Climate variability for Kamchatka for the past 400 years 123 0.5 1.0 1.5 2.0 0.5 1.0 1.5 Years Indices 0 50 100 150 KAML sample depth Indices 1600 1650 1700 1750 1800 1850 1900 1950 2000 KAML BY BY KAML EPS>0.85
Fig. 4. Comparison of the KAML and BY ring-width standard chronologies. These records are considered to be proxies of (early) summer temperature.
precipitation variability (Shiraiwa et al., 1999). These data include a Melt Feature Index (MFI; Fig. 5a, b) linked with temperature variability, and snow accumulation data from the Ushkovsky volcano ice core in Gorshkov Crater (Shraiwa et al., 1999). This Ushkovsky ice core was recovered in 1998 to 212 m depth, which is approximately 28 m above bedrock. The average annual accumulation rate in the central part of the Gorshkov crater is estimated to be at 0.54 m a−1 in water equivalent and is dated on the basis of an ash layer erupted from the Bezymianny volcano in 1956. The annual average temperature at 10 m depth in the core is −15.8◦C (Shiraiwa et al., 1999). According to annual layer counts of the Ushkovsky ice core an accuracy of the upper part of the core of +/−2 years is estimated to AD 1829 (Shiraiwa et al., 1999). The basal age is estimated to be between AD 1395 and 1487 according to age-depth models (Shiraiwa et al, 1999). Annual accumulation records are reconstructed from AD 1828 (Fig. 8), and the MFI extend back to AD 1503 (Fig. 5a, b).
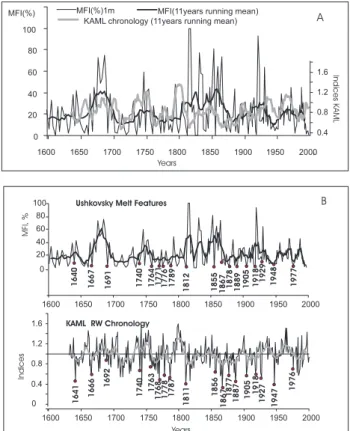
The MFI is derived from ice inclusions of refrozen water within annual layers. In general their volume is considered as an estimate of summer temperature, although the quan-tification of this proxy is complicated (Koerner, 1977). Ja-coby et al. (1983) previously demonstrated a correspondence between the smoothed values of MFI from Devon Ice Cap (Koerner, 1977) with reconstructed degree days above 10◦C for June–July from a ring-width chronology from the Yukon Territory. Similarly, Solomina et al. (2000) compared a local tree ring chronology from Kamchatka with the MFI from the Ushkovsky ice core. Here we note a general agreement be-tween the smoothed values of the MFI and KAML chronol-ogy, although the correlation is low both between the annual and smoothed values (Fig. 5a). The discrepancies may be due to the dating of the MFI series or to the different seasonality of the records. 0 20 40 60 80 100 1600 1650 1700 1750 1800 1850 1900 1950 2000 MFI(%)1m MFI(11years running mean)
MFI(%)
Years
KAML chronology (11years running mean)
20 40 60 80 100 1600 1650 1700 1750 1800 1850 1900 1950 2000 0 0.4 0.8 1.2 1.6
Ushkovsky Melt Features
KAML RW Chronology Years MFI , % Indices 1977 1976 1947 1948 1929 1927 1918 1918 1905 1905 1887 1889 1878 1877 1867 1867 1600 1650 1700 1750 1800 1850 1900 1950 2000 1855 1856 1811 1812 1789 1787 1778 1768 1776 1771 1764 1763 1740 1740 1691 1692 1667 1666 1641 1640 0 0.4 0.8 1.2 1.6 Indices KAML A B
Fig. 5. (A) Smoothed values (11 year running mean) of the Melt Feature Index (MFI) of the glacier of Ushkovsky Volcano and the KAML ring-width chronology. (B) Unsmoothed values of the same parameters and dates of corresponding minima.
The strong agreement of individual minima evident in the comparison between the unsmoothed MFI and KAML chronology suggest an accuracy of the ice core dating of +/-1-3 years back to AD 1750 (Fig. 5b). The earlier portions of the record do not show such agreement, most probably due to the low dating accuracy of the ice core. The maxima in both records (warm years), which are more prominent in the MFI curve, are not coherent with the ring-width chronol-ogy (Fig. 4). We suggest that this discrepancy may be due to the lower sensitivity of tree growth to unusual warmth, the more sensitive nature of the MFI to short melt intervals, and the potential of heating during the volcanic eruptions re-flected in the ice cores, which may be unrelated to climatic warming (Shiraiwa et al., 2001). The 11-year running mean of Ushkovsky net accumulation rates correlate with the local Kluchy station winter (r=0.75) and hydrological year precip-itation (r=0.69) (both significant at 99% level). This strong relationship occurs even though the station is located about 4000 m lower than the ice core site. The accumulation has a clear multidecadal variability pattern and correlates with the Pacific Decadal Oscillation (PDO; Shiraiwa et al., 2001). As in the temperature records, the positive accumulation trend begins before the start of the meteorological records in the 1870s.
-300 -200 -100 0 100 200 300 1880 1900 1920 1940 1960 1980 2000 Kozelsky glacier Mass balance, g/cm2 -200 -100 0 100 200 300 1880 1900 1920 1940 1960 1980 2000 Grechishkina glacier Mass balance, g/cm2 -300 -200 -100 0 100 200 300 1880 1900 1920 1940 1960 1980 2000 Mass balance, g/cm2 Koryto glacier Years
Fig. 6. Mass balance of Kamchatka glaciers reconstructed using meteorological records: Kozelsky glacier (Vinogradov, Muraviev, 1992), Grechisknia glacier (Vinogradov and Muraviev, 1985), Ko-ryto glacier (Muraviev et al., 1999).
2.4 Glacier variations
The glacier record includes mass balance data both mea-sured, and reconstructed using meteorological data (Vino-gradov, 1975; Vinogradov and Muraviev, 1985, 1992; Mu-raviev et al., 1999) and moraine chronologies based on his-torical, lichenometric, tephrochronological, tree-ring, and 14C dates (Solomina et al., 1995; Solomina and Calkin, 2003; Golub, 2002).
The mass balance reconstructions based on the mete-orological records (Fig. 6) show that maximum positive mass balances occurred in 1960s–1970s in all three regions of Kamchatka. In response to this positive mass balance anomaly several glaciers in various regions of Kamchatka advanced. There is direct evidence of advance in the 1970s in the Kozelsky and Zavaritskogo glaciers in Avacha volcano area, at the Dvoinoy Glacier in Kliuchevskoy volcano area and for Grechishkina in the Sredinny Range. At Kapel’ka (near the Kliuchevskoy volcano, Fig. 1) and Koryto Glaciers (Kronotsky Peninsula) advanced in the 1950s–1960s. End
1500 1600 1700 1800 1900 2000 Years AD Number of moraines (K amchatk a) Maunder Sp rer Ö Dalton KAML ring width indices -0.5 0 0.5 1 1.5 -1 0.9 1 1.1 1.2 0.8 “Glacier index ”, Alask a 1 2 3
Fig. 7. Number of moraines dated by lichenometry (averaged for 20 years) in comparison with the number of advancing glaciers (nor-malized) in Alaska (Wiles et al., 2004), KAML ring width chronol-ogy (31-years smoothed), and solar minima.
moraines formed as result of the 1950s–1960s and 1970s ad-vances were identified at Kozel’sky and Koryto Glaciers and were used as control points for a lichenometric growth curve (Solomina and Calkin, 2003).
In the 1940s, the balance in the south of Kamchatka was strongly negative whereas in the center and north of the peninsula it was close to zero (Vinogradov and Muraviev,
1992) (Fig. 6). In 1910s the mass balance of Kozel’sky
glacier was slightly positive according to the
reconstruc-tion (Fig. 6). Eight moraines in Kamchatka are dated
to the early 20th century at Novograblenogo, Elysovsky, Lavinshikov, Kozel’sky (Avacha), Koryto (Kronotsky), and Kropotkina (B.Semyachik volcano) Glaciers (Solomina et al., 1995; Solomina and Calkin, 2003) (Fig. 7) and may have been forced by these decades favorable to positive mass bal-ance. Twelve moraines dated in Kamchatka by lichenometry, 14C, tephrochronology, historical data and tree-ring counts (Solomina and Calkin, 2003) suggest ice advances and stand-stills during the 19th century. In most cases these moraines are most prominent and sometimes the only moraines pre-served (Fig. 7).
Moraines older than the 19th century are rare. Two
moraines deposited in 1690s–1700s are dated by lichenom-etry at the Avgusty Glacier on the Kronotsky Peninsula and Kozelsky Glacier in Avacha area. This dating is also supported by a tephrochronology: the moraine of Kozel-sky Glacier includes the Avacha ash dated at AD 1737, but does not include an earlier reference horizon14C dated
to 320+/−40 yr. BP (GIN-6893) (1430–1650 cal yr. AD;
Solomina et al., 1995). Possible earlier advance is reported by Golub (2002) based on a moraine at Kropotkina Glacier (Bolshoy Semyachik volcano) with a lichen Rhizocarpon
ge-O. Solomina et al.: Climate variability for Kamchatka for the past 400 years 125 ographicum of 80 mm diameter growing on its surface. This
lichen size corresponds to an age of ca. AD 1500, and is pre-liminary due to the poor control of the growth curve during this interval.
3 Climate signal inferred from tree-ring and ice core
proxies and glacier variations
A combination of the Ushkovsky accumulation record (mea-sured annual layer thicknesses) and the KAML tree-ring se-ries as a record of summer temperature provides a basis with which to assess the potential forcing in the glacial geologi-cal records. In the regions where the moraines were dated (Avacha, Bolshoy Semyachik volcanoes, Kronotsy penin-sula) the glaciers are very small (mostly less than 1 km2)
and temperate, so they react to climate change almost imme-diately. For instance, many glaciers advanced or stabilized their retreat in 1970s–1980s in response to the cooling of this period. The error of the moraine dating using lichenometry, tree colonization and tephrochronology is comparable with the reaction time of the glacier tongue. Therefore, within this accuracy, and using the smoothed time series for tem-perature and precipitation climatic proxies we see that these comparisons are consistent with a short (<10 year) time lag between the climatic forcing and the glacier response recon-structed from the moraine series.
Summer temperature and winter precipitation for Kam-chatka have tended to be opposite in sign in the 20th cen-tury (Fig. 8a) and therefore they either contribute together to a positive or negative glacier mass balance. Compar-ison of the KAML chronology with increased accumula-tion from Ushkovsky (Fig. 8b) shows inferred cooler in-tervals broadly corresponding with increased precipitation that began in the 1870s. After the removal of the linear trend between AD 1876–1989 the 20 years running means of KAML and Ushkovsky accumulation series correlate at
R=−0.49, (99% significance level). In the earlier portion of the record (1838–1875) the Ushkovsky accumulation rates and KAML ring width index (both 20 years smoothed) cor-relate positively R=0.78 (95% significance level) but neither have significant trends. In 20th century three periods favor-able for glaciers (Fig. 8b) broadly coincide with those in-ferred from meteorological records (Fig. 8a) as well as from reconstructed mass balance (see Fig. 6) and glacial advances (see text above and Fig. 7).
The 1860s–1880s were the longest coldest interval in the last 350 years (Fig. 7). According to Gostev et al. (1996) the early summer cooling was about 1.5◦C at that time com-pared with the warmest during the mid 20th century. The latest part of this period (1880s) coincided with the positive anomaly in accumulation. This coincidence led to a positive mass balance, which is most likely responsible for glacier ad-vances and moraine deposition of the end of 19th-early 20th centuries. In many cases the advances of the end of 19th
Years AD 0 0.2 0.4 0.6 0.8 1 1.2 1.4 1820 1840 1860 1880 1900 1920 1940 1960 1980 2000 KAML ring wid th indices Accumulation , mm 0 0.2 0.4 0.6 0.8 1 1.2 1.4 0.9 1 1.1 1900 1920 1940 1960 1980 2000 0.6 0.8 1 1.2 1.4 1.6 TJJA(deviations) P annual (deviations) Tree Rings Ice Core A B
Fig. 8. (A) June–August temperature and precipitation of hydro-logical year (11-years smoothed) (Kliuchy met.station) (B) KAML ring width chronology (proxy for summer temperature) and accu-mulation for Ushkovsky ice core. All series are 11-years smoothed. Shaded stripes show periods of low summer temperature broadly corresponding to high precipitation (A – recorded, B – inferred from proxy data), i.e. favorable to glacier mass balance.
century marked the Little Ice Age (LIA) maximum, when glaciers were on the average 500–600 m longer and termi-nated about 100 m lower than at the end of 20th century (Solomina, 2000). In full agreement with subsequent sum-mer warming trend, inferred both from instrumental and tree ring data (see Figs. 2, 7, and 8), glacier advances since 1880s have been less extensive. Climatic conditions in the 1840s– 1850s were generally less favorable for glaciers due to rather high temperature and low accumulation. However the low summer temperature in 1860s might have led to moderate glacier advances.
The available accumulation series from the ice core record ends in 1820s and therefore earlier comparisons are based on the KAML temperature record alone (Fig. 7).
Moraines have not been found equivalent to the two in-ferred summer temperature minima during the mid 19th and early 18th century (Fig. 7) although these moraines may have been destroyed by the later advances of the late 19th cen-tury. The late 18th century expansion coincides with the inferred summer temperature decrease recorded by the ring width chronology, however, the AD 1500 advance is too old to be compared with the ring width records.
4 Discussion
The AD 1500, late 18th century and late 19th century expan-sions are broadly consistent with the Alaskan moraine record
(Wiles et al., 2004) (Fig. 7). A similar LIA glacial history is reported by Koch et al. (2004) for the Garibaldi Provin-cial Park, Southern Coast Mountains, British Columbia. The most extensive advance of the Little Ice Age occurred there in the early 18th century, but the moraines of late 19th cen-tury are close to this Little Ice Age maximum. The glacier retreat began about 150 years ago, but occurred mostly dur-ing two intervals, between 1930 and 1960 and between the late 1970s and present. The two retreat phases were sepa-rated by a stillstand or minor re-advance in the late 1960s and early 1970s. Luckman (2000) reported the history of glacier fluctuations during Little Ice Age in the Canadian Rockies and identified the episodes of glacier advances dur-ing the “high” LIA that occurred in the early 18th, through the 19th centuries, with glacier retreat in the 20th century. Both periods of glacier advances follow periods of reduced summer temperatures in 1690s and in the 1800s. According to the tree-ring reconstruction in the Canadian Rockies the precipitation were higher than average in the 1880s, precisely at the same time as in Kamchatka according to the ice core records. Glacier advances in the early 1700s, the late 1800s and, in the 1950–1970s, reflect both increased precipitation, and reduced summer temperatures. The similarity of this pat-tern with Kamchatka records for the last two advances is also striking. However while in the Rockies Mountains the neg-ative glacier mass balances from 1976 to 1995 were caused by decreased winter precipitation, in Kamchatka it was due both to increased summer temperature and decreased winter precipitation.
At the first glance the reconstruction of mass balance in-dex for the Jackson and Agassiz glaciers in the Glacier Na-tional Park, Montana, USA, by Pederson et al. (2004) based on PDO (winter balance) and tree-ring width density (sum-mer balance) do not show a similarity to Kamchatka records. According to this reconstruction the maximum LIA advances coincided with cool summers and high winter precipitation in 1770s–1790s and in 1800s–1830s. In 1860s–1890s the mass balance in Glacier National Park was negative due to both high ablation and low accumulation and the glaciers start to retreat. In Kamchatka the major cooling and glacial advance occurred exactly at the time of this retreat. However the pe-riods of coolings in the late 18th and early 19th centuries are recorded in Kamchatka as well as in Glacier National Park, though their amplitude is different and smaller than in the end of 19th century. The absence of moraines coinciding with these coolings is explained by the most extensive glacier advance in the late 19th century (see above).
The similarity of the last half-millennium glacial history in Kamchatka and Alaska/Rockies Mountains may partly ex-plain the absence of moraines that predate the 15th century in Kamchatka. A millennium-long tree ring summer temper-ature record in Alaska (Wilson et al., 2007) shows the gen-erally warmer summers in the area in 11th–14th centuries, when the glaciers were smaller than in the 15th–19th cen-turies.
The strong advances in the late 1800s, late 1600s and pos-sible expansion ca. AD 1500 correspond with and may have been partially forced by a decrease in solar radiation during the Dalton, Maunder and Sporer solar minima as reported in Alaska (Wiles et al., 2004) (see Fig. 7) and in the Canadian Rockies (Luckman and Wilson, 2005). The broadly coher-ent glacier variations at these times across the North Pacific suggest similar forcing from both regions, which is generally consistent with solar forcing, but could also reflect changes in the PDO which is also common to these areas.
Similar to Kamchatka, the late LIA maximum (in the late 19th-early 20th century) occurred in several other high lat-itude regions, such as Western Greenland (Ten Brink and Weidick, 1974), Iceland (Gudmundsson, 1997), Spitsbergen (Werner, 1990), the Polar Urals (Solomina, 2003), Franz Jozef Land (Lubinsky et al., 1999), in the east Brooks Range (Calkin and Wiles, 1991). This study shows that in Kam-chatka this advance was triggered by a long deep summer temperature minimum in 1860s–1880 and a accumulation maximum in 1880s.
Collectively the proxy records suggest that there was prob-ably a change in character of circulation in the region in 1870s. This variation is first detected in the change from positive to negative correlation of the KAML and Ushkovsky data about 1875. After 1875 cooler summer temperatures are associated with increased winter precipitation together forc-ing the major late 1800s moraine buildforc-ing maximum. Similar variations in proxy records have been detected for the North Pacific and the Pacific basin in general. Earlier comparisons of tree-ring records from Hokkaido Japan and Kamchatka showed that temperatusensitive series, from the two re-gions were coherent from the early 15th century through the mid 1800s after which the relationship noticeably weakened (Davi et al., 2002). Villalba et al. (2001) also identified a breakdown in the decadal mode of variability after AD 1850, based on a larger inter-hemispheric comparison of Gulf of Alaska and Patagonia tree-ring records, and suggested that it may be attributed to a more energetic ENSO tropical forcing. Glaciers in Kamchatka are decreasing in size as most mountain glaciers in the World (Grove, 2004). The advance of 1970s was by far less prominent than the LIA advances and those of the beginning of 20th century, while docu-mented increases in precipitation have not counterbalanced the mass loss due to the ablation. Its timing approximately coincides with the PDO shift in the North Pacific in the mar-itime southern Kamchatka, whereas in more northern regions and in central Kamchatka the positive shift took place earlier, in the 1960’s.
Not only the decadal variations, but also individual sum-mer temperature minima in Kamchatka inferred from the KAML ring width chronology are common for the North Pa-cific region and more broadly for the Nothern Hemisphere. Thus, several known volcanic eruptions recognized in the KAML tree-rings (e.g. in 1641, 1695, 1810, 1816, 1831) are marked as by narrow rings both in the Wrangell Mountains of
O. Solomina et al.: Climate variability for Kamchatka for the past 400 years 127 southern Alaska (Davi et al., 2002) and the Northern
Hemi-sphere records (D’Arrigo et al., 2001).
5 Conclusions
Tree rings, ice cores and glacial geologic histories character-ize climate variability and identify the key climate parame-ters forcing glacier expansions for Kamchatka over the past several centuries.
The KAML larch ring-width chronology provides a proxy record of past summer temperature variability for the period AD 1632–2003 in Kamchatka. Comparison of the KAML chronology ring width minima with the Melt Feature Index in Ushkovsky ice core record suggests a 1–3 year dating ac-curacy for the ice core from the late 18th to 20th centuries. Individual low growth years in the larch record are associated with several known and inferred volcanic events recognized from other proxy records from the Northern Hemisphere.
Since the 1870s–1880s the decadal variations of annual accumulation and larch ring width in Kamchatka tend to be opposite. This pattern is consistent with the observed fluctua-tions of annual precipitation and summer temperature in 20th century. The periods of high accumulation and low summer temperature favorable for the glaciers are identified by these records as 1880s, 1910s–1920s, 1940s–1950s and 1970s. The positive linear trend for both summer temperature and annual precipitation began in 1870s-1880s. In accordance with this trend glaciers retreated from the LIA maximum during the 20th century. The minor advances of glaciers in 1940s–1950s and 1970s are instrumentally recorded and supported by mass balance reconstructions from instrumen-tal data, while those for the beginning of the century are sup-ported by the dated moraines in both maritime and continen-tal parts of Kamchatka.
The glacier record shows moraine building about AD 1500, during the final decade of the 17th century, a strong expansion during the late 1800s and mostly negative mass balance with short positive excursions during the 20th cen-tury. Comparisons of this glacier history with records from Alaska and the Canadian Rockies suggests broadly consis-tent intervals of glacier expansion and inferred summer cool-ing durcool-ing solar irradiance minima.
Acknowledgements. The study was supported by National Science Foundation Grant ATM02-02898, and International Science and Technology Center, Grant 2947. We would like to thanks Brian Luckman for valuable comments.
Edited by: J. Brigham-Grette
References
Calkin, P. E. and Wiles, G. C.: Little Ice Age glaciation in Alaska: a record of recent global climatic change, Int. Conf. on the role of the Polar regions in global change, Fairbanks, p. 617-625, 1991.
Chinn, T. J.: New Zealand glacier response to climate change of the past two decades, Global and Planetary Change, 22, 155–168, 1999.
Cook, E. R. and Kairiukstis, L. A.: Methods of dendrochronology: applications in the environmental sciences, Dordrecht, Nether-lands, Kluwer Academic Publishers, 1990.
Cook, E. R.: A Time Series Analysis Approach to Tree-Ring Stan-dardization, Ph.D. Thesis, University of Arizona, Tucson. 1985. D’Arrigo, R. J., Jacoby, G., Frank, D., Pederson, N., Cook, E.,
Buckley, B., Nachin, B., Mijiddorj, R., and Dugarjav, C.: 1738 Years of Mongolian Temperature Variability Inferred from a Tree-ring Width Chronology of Siberian Pine, Geophys. Res. Lett., 28(3), 543–546, 2001.
D’Arrigo, R. D., Mashig, D., Frank, D., Jacoby, G., and Wilson, R.: Reconstructed warm season temperatures for Nome, Se-ward Peninsula, Alaska since AD 1389, Geophys. Res. Lett., 31, L09202, doi:10.1029/2004GL019756, 2004.
Davi, N. K., Jacoby, G. C., and Wiles, G. C.: Boreal temperature variability inferred from maximum latewood density and tree-ring width data, Wrangell Mountain region, Alaska, Quatern. Res., 60, 252–262, 2003.
Davi, N., D’Arrigo, R. D., Jacoby, G., Buckley, B., and Kobayashi, O.: Warm-season to decadal temperature variability for Hokkaido, Japan, inferred from maximum latewood density (AD 1557-1990) and ring width data (AD 1532–1990), Clim. Change, 52, 201–217, 2002.
Golub, N. V.: Moraine complex of Kropotkina glacier as a record of glacier fluctuations in 17th–20th centuries, Data of Glaciological Studies, 93, 178–181, 2002 (in Russian).
Gostev, M., Wiles, G., D’Arrigo, R., Jacoby, G., and Khomen-tovsky, P.: Early summer temperature since 1670 A.D. for Cen-tral Kamchatka reconstructed based on a Siberian larch tree-ring width chronology, Can. J. For. Res., 26, 2048–2052, 1996. Grove, J. M.: Little ice ages: ancient and modern, New York,
Rout-ledge, 2004.
Gudmundsson, H.: A review of the Holocene environmental history of Iceland, Quatern. Sci. Rev., 16, 81–92, 1997.
Hoelzle, M., Haeberli, W., Dischl, M., and Peshke, W.: Secular glacier mass balances derived from cumulative glacier length changes, Global Planet. Changes, 36, 295–306, 2003.
Holmes, R. L.: Computer-Assisted Quality Control in Tree-Ring Dating and Measurement, Tree-Ring Bull., 44, 69–75, 1983. Jacoby, G. C., Cook, E. R., and Ulan, L. D.: Reconstructed Summer
degree days in Central Alaska and Northwestern Canada since 1524, Quatern. Res., 23, 18–26, 1985.
Jacoby, G., Solomina, O., Frank, D., Eremenko, N., and D’Arrigo, R.: Kunashir (Kuriles) Oak 400-year reconstruction of tempera-ture and relation to the Pacific Decadal Oscillation, Palaeogeog-raphy, Palaeoclimatology, Palaeoecology, 209, 303–311, 2004. Koch, J., Menounos, B., Clague, J., and Osborn, G. D.:
Envi-ronmental Change in Garibaldi Provincial Park, Southern Coast Mountains, British Columbia. Geosci. Can., 31(3), 127–135, 2004.
Koerner, R. M.: Devon Ice Cap: ice core stratigraphy and paleocli-mate, Science, 196(4285), 15–18, 1977.
Lubinsky, D. J., Forman, S. L., and Miller, G. H.: Holocene glacier and climate fluctuations on Franz Josef Land, Arctic Russia,
80◦N, Quatern. Sci. Rev., 18, 87–108, 1999.
Luckman, B. H: The Little Ice Age in the Canadian Rockies.
morphology. 32(3), 357–384, 2000.
Luckman, B. H. and Wilson, R. J. S.: Summer temperatures in the Canadian Rockies during the last millennium: a revised records, Clim. Dyn., 24, 131–144, 2005.
Mantua, N. J., Hare, S. R., Zhang, Y., Wallace, J. M., and Francis, R. C.: A Pacific Interdecadal Climate Oscillation with Impacts on Salmon Production, Bull. Amer. Meteorol. Soc., 76, 1069–1079, 1997.
Muraviev, Y. D., Shiraiwa, T., Yamaguchi, S., Matsumoto, T., Nishimura, K., Kohshima, S., and Ovsyannikov, A.: Mass bal-ance of glacier in condition of maritime climate – Koryto glacier in Kamchatka, Russia, Cryospheric Studies in Kamchatka, 2, 51– 61, 1999.
Nesje, A. and Dahl, S. O.: The Little Ice Age - only temperature?, The Holocene, 13(1), 139–145, 2003.
Oerlemans, J.: Glaciers and Climate Change, Lisse, Abingdon, Ex-ton (PA), Tokyo, 2001.
Pederson, G. T., Foger, D. B., Gray, S. T., and Graumlich, L. J.: Decadal-scale climate drives for glacier dynamics in Glacier Na-tional Park, Montana, USA, Geophys. Res. Lett., 31, L12203, doi:10.1029/2004GL 019770, 2004.
Patterson, W. S. B.: The physics of glaciers:
Butterworth-Hememann, Oxford, 1994.
Shiraiwa, T., Muraviev, Ya. D., and Yamaguchi, S.: Stratigraphic features of firn as proxy climate signals at the summit ice cap of Ushkovsky Volcano, Kamchatka, Russia, Arc. Alp. Res., 29(4), 414–421, 1997.
Shiraiwa, T., Muravyev, Y. D., Kameda, T., Nishio, F., Toyama, Y., Takahashi, A., Ovsyannikov, A. A., Salamatin, A. N., and Yamagata, K.: Characteristics of a crater glacier at Ushkovsky volcano as revealed by the physical properties of ice cores and borehole thermometry, J. Glaciology, 47(158), 423–432, 2001. Shiraiwa, T., Nishio, F, Kameda, T., Takahashi, A, Toyama, Y.,
Mu-raviev, Ya., and Ovsyannikov, A.: Ice core drilling at Ushkovsky ice cap, Kamchatka, Russia, Seppyo, 61(1), 25–40, 1999. Solomina, O. N.: Mounatin glaciation of Northern Eurasia in the
Holocene (Gornoye oledeneniye Severnoy Evrazii v Golotsene), Moscow, Nauchniy Mir, 1999 (in Russian).
Solomina, O.: Retreat of mountain glaciers of northern Eurasia since the Little Ice Age maximum, Ann. Glaciol., 31, 26–30, 2000.
Solomina, O. N.: Fluctuations of subpolar glaciers over the last 2000 years by lichenometric data, Data of glaciological studies, 94, 17–30, 2003 (in Russian).
Solomina, O. and Calkin, P.: Lichenometry as Applied to Moraines in Alaska, USA, and Kamchatka, Russia, Arctic, Antarctic, and Alpine Research, 35(2), 129–143, 2003.
Solomina, O., Jacoby, G., D’Arrigo, R., Braeunning, `A., Eremenko,
N., and Muraviev, Ya.: Summer Temperature Reconstructions of the Last 400 Years in Kamchatka and Kunashir Based on Tree-Ring Analysis, Problems of ecological monitoring and ecosys-tem modeling, 20, 37–58, 2005 (in Russian).
Solomina, O. N., Muravyev, Ya. D., and Bazanova, L. I.: Little Ice Age Glaciers in Kamchatka, Ann. Glaciol., 21, 240–244, 1995. Solomina, O. N., Muraviev, Ya. D., Braeuning, A., Shiraiwa, T.,
and Shiyatov, S. G.: Tree-rings in Central Kamchatka in Com-parison with Climate Variations and Ice Core Data, Proceedings of the International Conference on Climate Change and Variabil-ity, Tokyo, Japan, 133–137, 2000.
Ten Brink N. W. and Weidick, A.: Greenland Ice Sheet History since the Last Glaciation, Quatern. Res., 4, 429–440, 1974. Villalba, R. D., Cook, E. R., Jacoby, G. C., and Wiles, G.:
Decadal-Scale Climatic Variability Along the Extratropical Western Coast of the Americas: Evidence from Tree-Ring Records, Interhemi-spheric climate linkages, edited by: Markgraf, V., San Diego, Academic Press, 155–174, 2001.
Vinogradov, V. N. and Muraviev, Ya. D.: Kozel’sky Glacier. (Led-nik Kozel’sky), Sankt-Petersbourg, Gidrometeoizdat, 1992 (in Russian).
Vinogradov, V. N. and Muraviev, Ya. D.: Regime of glaciers in vol-canic regions of Kamchatka, Glaciol. Stud., 27, 36–50, 1985 (in Russian).
Vinogradov, V. N.: Modern glaciation of the regions of active vol-canism. Moscow, Nauka, 1975 (in Russian).
Werner. A.: Lichen growth rates for the Northwest coast of Sptis-bergen, Svalbard, Arctic and Alpine Research, 1990, 22(2), 129– 140.
Wiles, G., D’Arrigo, R., and Jacoby, G.: Gulf of Alaska
atmosphere-ocean variability over recent centuries inferred from coastal tree-ring records, Clim. Change, 38, 289–306, 1999. Wiles, G., D’Arrigo, R., Villalba, R., Calkin, P., and Barclay, D. J.:
Century-scale solar variability and Alaskan temperature change over the past millennium, Geophys. Res. Lett., 31, L15203, doi:10.1007/s00382-006-0194-9, 2004.
Wilson, R., Wiles, G., D’Arrigo, R., and Sweck, C.: Cycles and shifts: 1300 years of multidecadal temperature variability in the Gulf of Alaska, Clim. Dyn., 28, 424–440, doi:10007/s 00382-006-0194-9, 2007.