HAL Id: hal-00317669
https://hal.archives-ouvertes.fr/hal-00317669
Submitted on 3 Jun 2005
HAL is a multi-disciplinary open access
archive for the deposit and dissemination of
sci-entific research documents, whether they are
pub-lished or not. The documents may come from
teaching and research institutions in France or
abroad, or from public or private research centers.
L’archive ouverte pluridisciplinaire HAL, est
destinée au dépôt et à la diffusion de documents
scientifiques de niveau recherche, publiés ou non,
émanant des établissements d’enseignement et de
recherche français ou étrangers, des laboratoires
publics ou privés.
Bora-induced currents corresponding to different
synoptic conditions above the Adriatic
G. Beg Paklar, A. Baji?, V. Dadi?, B. Grbec, M. Orli?
To cite this version:
G. Beg Paklar, A. Baji?, V. Dadi?, B. Grbec, M. Orli?. Bora-induced currents corresponding to
different synoptic conditions above the Adriatic. Annales Geophysicae, European Geosciences Union,
2005, 23 (4), pp.1083-1091. �hal-00317669�
SRef-ID: 1432-0576/ag/2005-23-1083 © European Geosciences Union 2005
Annales
Geophysicae
Bora-induced currents corresponding to different synoptic
conditions above the Adriatic
G. Beg Paklar1, A. Baji´c2, V. Dadi´c1, B. Grbec1, and M. Orli´c3
1Institute of Oceanography and Fisheries, ˇSet. I. Meˇstrovi´ca 63, 21000 Split, Croatia
2Meteorological and Hydrological Service of Croatia, Griˇc 3,10000 Zagreb, Croatia
3Andrija Mohoroviˇci´c Geophysical Institute, Faculty of Science, University of Zagreb, Horvatovac bb, 10000 Zagreb, Croatia
Received: 21 December 2002 – Revised: 14 February 2005 – Accepted: 24 February 2005 – Published: 3 June 2005
Abstract. The Bora wind field is characterised by strong vorticity and divergence. Several numerical experiments, in which an oceanographic model was forced with northeasterly winds having climatological alongshore variability, were per-formed in order to study the influence of spatial variability in the bora wind field on the surface currents in the northern Adriatic. Numerical model results showed that during bora episodes with lower speeds and fast offshore decay surface currents along transect Rovinj – Po River are predominantly in the downwind direction. On the other hand, during bora episodes with strong intensity and slow offshore decay, a cy-clonic gyre due to the pronounced bora alongshore variability is formed in the northernmost part of the Adriatic Sea and the studied transect is influenced by the counter currents. More-over, bora having a high speed and a short offshore range produces the same effect in the eastern part of the Rovinj – Po River transect as low-speed bora characterised by slow offshore decay.
Eulerian current measurements performed in the north-ern Adriatic during bora episodes characterised by different synoptic conditions supported the numerical model findings. Surface currents during the bora episode of 8–11 February 1984 were directed downwind, whereas during the episode of 12–19 February 1984 they were directed upwind. The first episode was characterised by a deep bora layer with cy-clonic activity over the western Mediterranean and Genoa Bay, whereas the second one was accompanied by temper-ature inversion and a southwesterly tropospheric wind above a shallow bora layer. According to the hydraulic theory de-veloped by Smith (1985), an observed descent of isentropes during the second bora episode led to the stronger accelera-tion in the bora layer and its larger offshore extent. Different offshore bora decays during studied events were confirmed by a comparison of the wind data originating from the meteo-rological stations positioned on the opposite Adriatic coasts.
Correspondence to: G. Beg Paklar
Keywords. Oceanography: Physical (Air-sea interaction, Currents, Numerical modelling)
1 Introduction
Bora (in Croatian this wind is known by the name bura) is a strong and cold katabatic wind that blows along the eastern Adriatic coast from the northeastern quadrant. There have been many studies and descriptions of wind regime and bora wind characteristics on the northern Adriatic in the last few decades. One of the most comprehensive reviews of the bora-related research can be found in Yoshino (1976), where bora was considered from a climatological, synoptic and aeoro-logical point of view. It is well known that bora occurs under various synoptic conditions (Yoshino, 1976; Jurˇcec, 1989) and both observational and modelling studies show that the strongest bora cases occur during winter, being related to the frontal passages from the northwest and cyclones mov-ing along the Adriatic to the southeast (Brzovi´c, 1999).
A great step forward in the understanding of bora dynam-ics was provided by Smith’s results from both observational studies of ALPEX (ALPine EXperiment) bora cases (Smith, 1987) and the theoretical approach to downslope wind struc-ture based on hydraulic theory (Smith, 1985; Smith and Sun, 1987). Hydraulic theory is a steady-state hydrostatic theory, which describes the flow of fluid over an obstacle, and one of its solutions is a flow accelerated in both the upstream and downstream region leading to the occurrence of severe wind on the lee side. Upstream acceleration, obtained both from aerological and aircraft measurements (Smith, 1987), is the result of descending critical isentrope and accompanying increasing temperature gradients in the downstream direc-tion (Smith, 1985). Smith’s analytic model links downslope windstorms to the breaking waves in a continuously strati-fied atmosphere by solving Long’s (1954) equation. Studies of Baji´c (1988) and Vuˇceti´c (1988) have shown that the ap-plication of the hydraulic theory is successful in the case of the postfrontal bora type, whereas Jurˇcec (1988) has shown
1084 G. Beg Paklar et al.: Bora induced currents
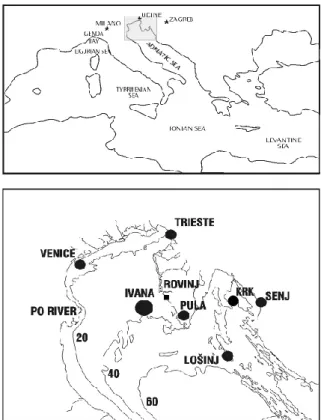
Fig. 1. Northern Adriatic Sea location and bathymetry. The
loca-tions of the radio-sounding staloca-tions are denoted in the upper chart with asterisks, whereas the locations of the gas field Ivana and mete-orological stations whose data were used in the analysis are denoted with full circles on the lower chart.
the same in the case of the frontal type. The strongest bora cases are connected with oppositely directed air flow above the bora layer, whereas in the cases with northeasterly upper wind the surface bora is weaker (Jurˇcec, 1989).
The pronounced alongshore variability in the bora wind speed is mainly controlled by the mountain chain along the eastern coast, whereas offshore bora extension depends on the synoptic situation and the intensity of the cold air out-break across the Dinaric Alps. Although surface data char-acteristics in the coastal area as well as vertical profiles were extensively analysed, only a few studies of the offshore bora spreading in the northern Adriatic exist. Polli (1956) has found that during the strong events bora decreased by about 60% from Trieste to Venice. Investigations by Yoshino et al. (1976) of wind-shaped trees revealed that at some loca-tions strong bora areas disappear at 20 km distance off shore. Analysis of wind data at coastal and open sea stations in the southern Adriatic area showed different offshore wind de-crease regimes during different synoptic situations (Miljak, 1982, in Penzar et al., 2001). Due to the lack of open sea meteorological stations, a similar analysis is missing for the northern Adriatic. Climatological analysis of the bora wind field pointed to bora frequencies decreasing in the offshore direction (Makjani´c, 1978). Numerical experiments by En-ger and Grisogono (1998) showed the controlling influence of the sea surface and air temperature differences on the
off-shore bora spreading. In the case of higher sea surface than air temperature the bora occupies a larger offshore area. This result requires observational support.
The measurements of the bora have shown that at some
locations the hourly average surface wind reaches 17 ms−1
and gusts exceed 50 ms−1(Baji´c and Glasnovi´c, 1999). The
analyses of simultaneous wind and current measurements ob-tained at a gas field positioned in the northernmost part of the Adriatic 70 km off Trieste indicated that bora with an hourly
mean of about 10 ms−1generates in the Adriatic surface
cur-rents of up to 50 cms−1and bottom currents of up to 30 cm−1
(Orli´c et al., 1986). Horizontal variability of the current field is primarily influenced by the wind-curl effect. The bora influence on the Adriatic current field was studied in some detail during the winter homogeneous period from empiri-cal in-situ (Zore-Armanda and Gaˇci´c, 1987) and remotely sensed data (Kuzmi´c, 1991; Sturm et al., 1992). Numerous numerical models successfully reproduced either semicircu-lar (Stravisi, 1977) or full cyclonic gyre (Orli´c et al., 1986; Bone, 1993; Orli´c et al., 1994; Beg Paklar et al., 2001; Pullen et al., 2003) induced by the bora in the northernmost part of the Adriatic.
Influence of vorticity and divergence of the bora wind field on the surface currents is studied in this paper using an oceanographic model forced by winds having a climatolog-ical alongshore profile with various intensities and offshore ranges. Eulerian current measurements performed during the period 19 January–19 February 1984 at the gas field Ivana in the northern Adriatic (Fig. 1), together with the wind data from several meteorological stations positioned on the op-posite Adriatic coasts, are used as a possible support of the numerical model findings. Also given is a detailed analysis of two synoptic situations with bora episodes.
2 The numerical model results
Several numerical experiments were performed in order to examine the influence of the bora wind field spatial variabil-ity on the surface currents of the northern Adriatic. Nu-merical experiments were made with the Princeton Ocean
Model (POM) (Blumberg and Mellor, 1987). POM is a
three-dimensional primitive equation nonlinear model with
complete thermodynamics. The equations which capture
the model physics are the traditional equations for the con-servation of mass, momentum, heat and salt coupled with the equation of state (Mellor, 1991). The model contains a second order turbulence closure submodel “level 2 1/2” de-scribed in the Mellor and Yamada (1982) review, which pro-vides two prognostic differential equations for the turbulence
kinetic energy and turbulence macroscale. The
horizon-tal viscosity and diffusivity coefficients are obtained using the horizontal diffusion formulation following J. Smagorin-sky, adapted to the sigma coordinate system (Mellor and Blumberg, 1985). The model employs a staggered C-grid according to A. Arakawa and a bottom following sigma coor-dinate in the vertical direction. The leapfrog scheme is used
for time stepping and a central difference scheme is used for spatial terms. The horizontal time differencing is explicit, whereas the vertical diffusion differencing is implicit.
In the simulation of bora influence on the Adriatic, a rect-angular grid with 10-km resolution in the horizontal plane and 16 sigma levels in the vertical direction was used. The numerical model domain is shown in Fig. 2. The horizontal grid spacing is constant, whereas the vertical spacing varies in order to achieve better resolution near the surface and bottom. The topography of the studied area was digitised from the bathymetric chart B100 given in Mercator projec-tion (Croatian Hydrographic Institute, Split), and smoothed with a Shapiro (1970) filter. In the numerical experiments an external time step of 70 s and an internal time step of 1400 s satisfied the Courant-Friedrichs-Lewy stability criterion. The model was integrated for 10 days in each experiment in order to reach the steady state.
POM was forced with the winds of the northeastern tion having a climatological profile in the alongshore direc-tion (Fig. 2, after Orli´c et al., 1994). The wind stress was determined using a bulk coefficient approach with the drag coefficient according to Deacon and Webb (1962). In all the experiments we assumed a linear decrease of the wind speed in the offshore direction. Differences between 30 performed experiments were in the bora wind speed and distances from the eastern shore at which the wind speed vanished. The ef-fect of the variable wind stress curl was investigated by forc-ing the model with climatological profiles calibrated to wind speeds of 5, 10 and 15 m/s at the Pula meteorological station (Orli´c et al., 1994). For each of these profiles the wind speed equalled zero at 30 km, 40 km, etc., up to 150 km from the eastern shore.
Surface currents and those at the seventh sigma level ob-tained in the experiments with a profile calibrated to a wind speed of 10 m/s at the Pula station indicate that the current direction at transect Rovinj – Po River depends on the wind speed decrease from the eastern coast (Fig. 3). In the ex-periments with a large decrease, surface current at the
stud-ied transect is in downwind direction (Figs. 3a,b,c). On
the other hand, in the experiments with a smaller decrease, the cyclonic gyre in the northernmost part of the Adriatic is generated and transect Rovinj – Po River is in the area of the counter current (Figs. 3d,e,f). Beside a general cur-rent strength decrease with depth, vertical homogeneity is increasing with the offshore bora range.
Since the results of the numerical experiments will be compared in the next section with current measurements at the gas field Ivana (Fig. 1), currents at model nodes corre-sponding to this position are presented in Fig. 4. Surface currents (Fig. 4a) and those from the seventh level (Fig. 4b) are shown for the experiments characterised by various wind speeds and fetches. Significant current variability in the area of the Ivana station can be explained by the existence and strength of the cyclonic gyre in the northernmost part of the domain and the small anticyclonic gyre further south. During the bora episodes with fast offshore decay and lower speeds, the double gyre system is not pronounced and the currents in
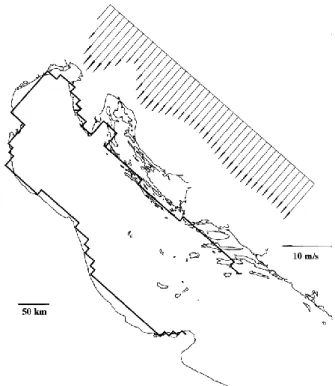
Fig. 2. Domain of the oceanographic model and the bora wind
pro-file used in the numerical experiments.
the selected area are predominantly in the downwind direc-tion. On the other hand, lower offshore decay and stronger wind intensity favour a double gyre structure and the stud-ied area is influenced by the counter current. Moreover, cur-rents for the lower winds and longer fetches are similar to those originating from experiments with the higher wind in-tensities and shorter fetches, since in these situations stresses acting on the sea surface are of comparable strength. Vertical current homogeneity is increasing with increased wind speed and offshore range.
3 Bora episodes from winter 1984
In order to support numerical model results we present Eu-lerian current measurements from the gas field Ivana in the
northern Adriatic (Fig. 1, 44◦47’ N, 13◦25’ E), obtained
dur-ing bora episodes related to different synoptic situations. De-tailed analysis of synoptic situations, with a possible expla-nation of the bora-controlling mechanisms, is also given.
3.1 Currents
Current measurements analysed in this paper were carried out by Aanderaa RCM4 current meters. This type of instru-ment is one of the most frequently used in Croatia during the 1970s and 1980s. RCM4 current meters were widely tested and compared with other types of instruments (Gould, 1973; Sounders, 1976, 1980; Beardsley et al., 1981; Sherwin, 1988). The instruments’ main errors, due to the compass-related problems, vane response length scale, sampling rate
1086 G. Beg Paklar et al.: Bora induced currents
Fig. 3. Surface currents (left) and currents at the seventh sigma level (right) obtained from the numerical experiments assuming a bora
range of 30 km (a), 40 km (b), 50 km (c), 70 km (d), 100 km (e) and 150 km (f) and a climatological profile calibrated to 10 m/s at the Pula meteorological station. The gas field Ivana is denoted by a circle.
and wave influence, occur mostly with low currents and can be reduced by calibration prior to and after each deployment and by choosing appropriate methods of mooring.
Strong currents during studied bora events and special de-ployment reduced some of the RCM4 errors in our case. All current meters at the gas field Ivana were deployed from the oil exploration platform fixed by three steel legs at the sea bottom. Each RCM4 current meter hung on a sepa-rate synthetic rope (12 mm in diameter), protruding 4 m from
the platform deck. To avoid the influence of steel on com-pass registration, the distance between the current meters and the platform legs was 25 m. The described RCM4 deploy-ment reduced the compass error, as well as errors induced by waves. According to Sherwin (1988), the latter error de-pends on the ratio of mean speed, wave speed and angle be-tween their directions. During bora events with speeds
rang-ing from 3.3 to 19.1 ms−1, wind waves having a height of
1996), whereas surface currents could reach 50 cms−1(Orli´c
et al., 1986). Under these conditions wave-related surface current amplification is between 15 and 20%. Current re-versal, which is the main topic of our paper, could not be significantly affected by this amplification.
Surface current time series obtained in the period from 19 January to 19 February 1984 reveal the influence of two bora episodes (Fig. 5): A) 8–11 February and B) 12–19 February. Wind data were simultaneously collected at the Pula airport station (Fig. 1). Both wind and current hourly means were low-pass filtered with a 24m214 filter (Thompson, 1983). The bora wind from 8 to 11 February, with a maximum
low-pass filtered speed in Pula of about 6.5 ms−1, induced
down-wind currents in the surface layer at the gas field Ivana
reach-ing 20 cms−1(Fig. 5). On the other hand, in the period from
12 to 19 February surface currents with a pronounced up-wind component dominated. Maximum current speed in the
period B was about 20 cms−1. The corresponding maximum
filtered wind speed at the Pula station was 8.5 ms−1(Fig. 5).
3.2 Synoptic situations
Although bora wind blew during the whole period from 8 to 19 February, synoptic developments and accompanied bora characteristics were different in the 8–11 February and 12– 19 February intervals with strong bora decay between them. Consequently, the period mentioned could be considered to comprise two bora episodes with large differences in synop-tic situations and their development. The crucial difference between the episodes (not easily noticeable in the surface pressure patterns) is the vertical atmospheric structure across the Dinaric Alps and Adriatic coast.
A) 8–11 February 1984. Synoptic development at the be-ginning of this situation was marked by a cold air outbreak and a deepening trough in Western Europe. Further large-scale development had a usual sequence characterised by a cut-off process and displacement of the upper level ridge from Western Europe eastward (Jurˇcec, 1989; Baji´c, 1988). A cyclone developed when a cold front, associated with a pri-mary trough moving eastward over Europe, interacted with the Alps. At the surface, the cyclone reached maximum in-tensity around 12 UTC on 9 February, and then gradually filled. The upper level evolution showed the amplification of a trough over central Europe. Lee cyclogenesis appeared at higher levels as a cut-off forming up to 300 hPa. The upper cut-off low subsequently grew, moving slowly from the mid-dle Adriatic to the Greece region, while a geopotential high, initially amplifying to the west of the trough, moved east-ward over southwest Europe. At the surface deep Mediter-ranean cyclone and a high pressure over southwestern Euro-pean coast built up a large pressure gradient over the Adri-atic (Fig. 6). Grubiˇsi´c (1989) showed that this bora event was characterised by a deep uniform northeasterly flow. The maximum bora wind speeds were observed in this situation on 10 February on the northern Adriatic islands of Loˇsinj
(Fig. 1, mean hourly wind speed 16.0 ms−1)and Krk (Fig. 1,
mean hourly wind speed 15.5 ms−1). The bora conditions
Fig. 4. Surface currents (a) and currents at the seventh sigma level
(b) in the area corresponding to the position of the gas field Ivana,
obtained in the numerical experiments with climatological bora pro-files calibrated to speeds of 5, 10 and 15 m/s at the Pula station and fetches of 30, 40, 50, 70, 100 and 150 km.
Fig. 5. Low-pass filtered series of the wind vectors registered at
the height of 10 m above the ground at the meteorological station Pula airport and of the currents registered at 5-m depth at the gas field Ivana from 19 January to 19 February 1984. Also indicated are episodes A and B discussed in the text.
were also observed along the whole middle Adriatic as a part of the circulation connected with the cyclone centred over the southern Adriatic.
B) 12–19 February 1984. This long-lasting bora remained severe during the whole episode while the upper level flow developed into a typical large-scale blocking pattern (Fig. 7). In the cases of long lasting severe bora conditions, this
1088 G. Beg Paklar et al.: Bora induced currents Case A Case A) 1000 1010 1010 1020 1030 1015 1035 1015 1030 990 1015 L H H 9. 2. 1984. 12 GMT
Fig. 6. Surface air pressure field on 9 February 1984.
temperature inversion is frequently observed and intensifies when a weakening upper tropospheric wind in a prefrontal stage turns to the southwesterly direction (Jurˇcec, 1989; Vuˇceti´c, 1988). A change in the upper level wind direction is associated with narrow trough extending from the northeast-ern Europe to the Adriatic region. The wind change to the northwesterly direction did not influence strongly the bora speed which rapidly decayed when the strong northeasterly flow behind the trough reached the upstream bora region. Cold air advection and stronger tropospheric northeasterly winds swept the inversion. Thus, cold air supply from the east associated with a continental anticyclone (Fig. 7) was not sufficient to oppose the effect of a strong unidirectional tropospheric northeasterly flow which apparently restrained the otherwise favourable bora conditions due to cold air sup-ply (Jurˇcec, 1989; Baji´c, 1990). Severe bora was observed in Senj (Fig. 1) with a maximum on 17 February (mean hourly
wind speed 16.1 ms−1).
Although bora wind occurred in both situations, their dif-ferent characteristics and spatial variability are obvious. The main reason for this is the difference in the vertical struc-ture of the atmosphere. The first episode was characterised by a deep bora layer with cyclonic activity over the west-ern Mediterranean and Genoa Bay, whereas the second one was accompanied by temperature inversion and southwest-erly tropospheric wind above the shallow bora layer. Vertical profiles of potential temperature over Zagreb, Udine and Mi-lano (Figs. 8 and 9) show further differences between the two situations.
Thus, the vertical profile of the potential temperature in the second situation indicates a definite descent of lower isen-tropic surfaces (those below 282 K) from the upstream to the downstream bora region (Fig. 9). At the same time, descent of upper isentropes did not exist. The region of isentrope splitting seems to have filled the gap between the descend-ing bora air and the less disturbed condition aloft. In the first bora situation vertical structure was quite different (Fig. 8). A less pronounced descent of isentropes existed in the en-tire troposphere on 8 February. However, this feature almost
Case B Case B) a) 12. 2. 1984. 00 GMT 850 hPa 156 152 148 144 140 152 156 160 164 H L L b) 12. 2. 1984. 12 GMT L H 1040 1030 1040 1030 1020 1020 L 1030 1030 c) 1020 1025 1025 1035 1025 1020 1015 1005 995 1025 L L L H 18. 2. 1984. 12 GMT Case B) a) 12. 2. 1984. 00 GMT 850 hPa 156 152 148 144 140 152 156 160 164 H L L b) 12. 2. 1984. 12 GMT L H 1040 1030 1040 1030 1020 1020 L 1030 1030 c) 1020 1025 1025 1035 1025 1020 1015 1005 995 1025 L L L H 18. 2. 1984. 12 GMT Case B) a) 12. 2. 1984. 00 GMT 850 hPa 156 152 148 144 140 152 156 160 164 H L L b) 12. 2. 1984. 12 GMT L H 1040 1030 1040 1030 1020 1020 L 1030 1030 c) 1020 1025 1025 1035 1025 1020 1015 1005 995 1025 L L L H 18. 2. 1984. 12 GMT
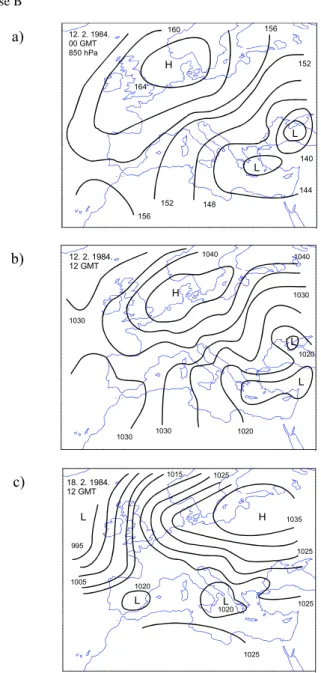
Fig. 7. Absolute topography AT 850 hPa on 12 February 1984 (a),
surface air pressure field on 12 February 1984 (b), and surface air pressure field on 18 February 1984 (c).
disappeared on 9 February (vertical profiles of potential tem-perature in Udine and Milano are almost the same).
Differences that arose from different isentropic structures of two studied bora episodes can be explained using Smith’s (1985) hydraulic model for severe downslope winds, illus-trated in Fig. 10. When the bora layer with velocity U and
height H0arrives at the obstacle with height h, splitting of
the isentropes occurs. Critical isentrope (θc)descend (δc)
in the upstream region, observed both from aerological and aircraft measurements (Smith, 1987; Baji´c, 1988; Vuˇceti´c, 1988), results in downstream acceleration for two reasons. Firstly, the conservation of mass flow rate between the ris-ing terrain and the descendris-ing isentropes would require flow
Case A Case A) 260 280 300 320 Potential temperature (K) ZG UD MI 260 280 300 320 Potential temperature (K) 0 2000 4000 6000 Height ( m ) 8.2.1984. 9.2.1984.
Fig. 8. Vertical profiles of potential temperature at Zagreb (ZG),
Udine (UD) and Milano (MI) on 8 and 9 February 1984 at 00 UTC. Case B Case B) 260 280 300 320 Potential temperature (K) 0 2000 4000 6000 Heigh t ( m ) 12.2.1984. 260 280 300 320 Potential temperature (K) 18.2.1984. 260 280 300 320 Potential temperature (K) ZG UD MI 16.2.1984. Case B) 260 280 300 320 Potential temperature (K) 0 2000 4000 6000 Heigh t ( m ) 12.2.1984. 260 280 300 320 Potential temperature (K) 18.2.1984. 260 280 300 320 Potential temperature (K) ZG UD MI 16.2.1984.
Fig. 9. Vertical profiles of potential temperature at Zagreb (ZG),Udine (UD) and Milano (MI) on 12, 16 and 18 February 1984 at
00 UTC.
acceleration. Secondly, the descending isentropes produce a horizontal density gradient that hydrostatically gives rise to a pressure gradient below. This pressure gradient is directly responsible for the flow acceleration. The local descent of isentropes implies both local baroclinicity, which generates horizontal components of vorticity, and differential vertical motion, which tilts the horizontal vorticity components into the vertical (Dempsey, 1989). Consequently, since no isen-tropic surface descend was observed during the first bora event, it could be concluded that the conditions did not sup-port significant flow acceleration from the upstream to
down-Fig. 10. Schematics of Smith’s (1985) hydraulic model for severe
downslope winds.
Fig. 11. Low-pass filtered series of the wind vector at the
meteoro-logical stations Trieste (up) and Venice (down). A and B indicate episodes discussed in the text.
stream bora region at the time. Moreover, investigations of time-dependent downslope winds (Bacmeister and Pier-rehumbert, 1988) showed that for a higher atmospheric bora layer stronger energy dissipation may occur, leading to lower acceleration at the surface. This agrees with our results, and implies that the first bora case with a higher incoming layer was characterised by lower speeds and faster offshore decay. Lower wind speeds during the period A in comparison with the period B are easily observed from the wind data collected at meteorological stations Pula, Trieste and Venice (Figs. 5 and 11). A stronger offshore speed decrease during the first bora episode is confirmed by a comparison between northeasterly wind components (Table 1) and wind vectors (Fig. 11) at the meteorological stations Trieste and Venice, positioned on the opposite Adriatic coasts (Fig. 1). Although the distance at which the bora becomes zero depends on the position where it was determined, the presented results agree with the characteristics of some bora situations in which the bora speed becomes zero at short offshore distances (Pen-zar et al., 2001; Poulain and Raicich, 2001). On the other hand, the second long-lasting bora, which induced upwind surface currents, had small offshore speed decay (Table 1 and
1090 G. Beg Paklar et al.: Bora induced currents
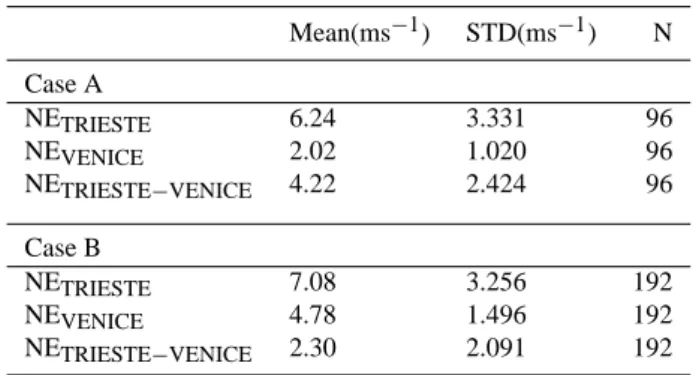
Table 1. Northeasterly wind means and standard deviations at
Tri-este and Venice and corresponding differences for two bora cases: 8–11 February (A) and 12–19 February 1984 (B). N is the number of hourly values included in the analysis.
Mean(ms−1) STD(ms−1) N Case A NETRIESTE 6.24 3.331 96 NEVENICE 2.02 1.020 96 NETRIESTE−VENICE 4.22 2.424 96 Case B NETRIESTE 7.08 3.256 192 NEVENICE 4.78 1.496 192 NETRIESTE−VENICE 2.30 2.091 192
Fig. 11). Due to strong alongshore variability, with larger velocities off Trieste and Senj and smaller velocities at the cross section of the Rovinj – Po River, this type of bora in-duced cyclonic gyre in the northernmost part of the Adri-atic. The gas field Ivana was then in the area of the counter current. We hypothesise that the first bora, due to its lower speeds and strong offshore decrease, was not able to gener-ate cyclonic gyre and, therefore, the surface current at the gas field Ivana was in the wind direction.
4 Conclusions
Numerical experiments with different bora spatial distribu-tions indicate that the surface current direction in the north-ern Adriatic depends on the bora intensity and distance from the eastern coast at which the bora speed vanishes. Bora with greater wind speeds off Trieste and Senj and smaller speeds at the cross section of the Rovinj – Po River and with slower offshore decay, induces a cyclonic gyre in the northernmost part of the Adriatic. The transect Rovinj – Po River is in the area of the counter current, which is formed in the southern part of the cyclonic gyre. Bora episodes with lower speeds and high offshore decay are not able to generate the cyclonic gyre, and therefore they can only induce downwind currents in the limited offshore area. It is important to notice that in the eastern part of the studied transect, which coincides with the position of the gas field station Ivana, strong bora with fast offshore decay has the same effect as the bora having low intensity and slow offshore decay. The stresses acting on the sea surface are of comparable strength in these cases.
Eulerien current measurements at the gas field Ivana in-dicate the occurrence of the oppositely directed surface cur-rents during two bora episodes. These measurements and detailed analyses of synoptic situations offer possible sup-port of the numerical model results.
The deep bora layer, with its centre of cyclonic activity over the western Mediterranean and Genoa Bay, was accom-panied by downwind surface currents at the gas field Ivana in
the period 8–11 February 1984. On the other hand, cyclonic development in the period 12–19 February 1984, which was characterised by inversion and southwesterly tropospheric wind above a shallow bora layer, induced upwind surface currents.
The main difference between the two studied bora episodes was their vertical development. The well expressed descent of isentropic surfaces in the bora layer observed in the second situation is, according to Smith’s (1985) hy-draulic theory, an indicator of significant flow acceleration from the upstream to downstream bora region and conse-quently, slower offshore bora decay. On the other hand, the vertical atmospheric structure in the first bora episode gives no evidence of significant flow acceleration, which agrees with its lower speeds observed at the meteorological sta-tions Pula, Trieste and Venice and faster offshore decay con-firmed by the comparison of the wind data from two meteo-rological stations positioned on the opposite Adriatic coasts. Moreover, our results match investigations of nonstationary downslope winds, which indicate stronger energy dissipation in the case of stronger vertical development.
Finally, let us emphasise the connection between surface wind characteristics, vertical structure of the atmosphere and corresponding current directions. The first bora episode char-acterised by higher atmospheric vertical development, lower upwind acceleration and stronger offshore decay induced downwind currents, whereas the second one, limited to a shallow atmospheric layer and having significant upwind ac-celeration, induced the cyclonic gyre in the northernmost part of the Adriatic Sea with counter currents affecting the gas field Ivana station.
Although the presented numerical experiments give quite interesting results, the use of space- and time-varying wind stresses and heat fluxes from mesoscale meteorological mod-els (e.g. Beg Paklar et al., 2001; Pullen et al., 2003), instead of simple forcing with suddenly applied climatological wind speed profile, would improve findings as well as our under-standing of the bora’s influence on the Adriatic dynamics. The study of the detailed structure of the sea surface temper-ature could also contribute to this understanding, since Enger and Grisogono (1998) have shown that offshore bora extent depends on the difference between the sea surface and air temperature.
Acknowledgements. Meteorological and Hydrological Service of
the Republic of Croatia kindly provided wind data from Croatian meteorological stations. We are grateful to F. Raicich from Isti-tuto Talassografico Sperimentale in Trieste and L. Zampato from Comune di Venezia for providing us with the wind data from Ital-ian stations. We would also like to thank J. Miljak for his helpful discussion of the synoptic situations. The work was supported by the Ministry of Science, Education and Sports of the Republic of Croatia. We thank two anonymous referees for their constructive suggestions.
Topical Editor N. Pinardi thanks three referees for their help in evaluating this paper.
References
Bacmeister, J. T. and Pierrehumbert, R. T.: On high-drag states of nonlinear stratified flow over an obstacle, J. Atmos. Sci., 45, 63– 80, 1988.
Baji´c, A.: The strongest bora event during ALPEX-SOP, Rasprave (Papers), 23, 1–12, 1988.
Baji´c, A.: Spatial bora variations in relation to cold air outbreak and surface pressure gradient, Rasprave (Papers), 25, 13–24, 1990. Baji´c, A. and Glasnovi´c, D.: Impact of severe Adriatic Bora on
traf-fic, Proceedings 4th European Conference on Application of Me-teorology - CD, Norrk¨oping, Sweden, 13–17 September 1999, 46–48, 1999.
Beardsley, R. C., Boicourt, W. C., Huff, L. C., McCullough, J. R., and Scot, J.: CMICE: A near-surface current meter intercompar-ison experiment, Deep Sea Res., 28, 1577–1603, 1981.
Beg Paklar, G., Isakov, V., Koraˇcin, D., Kourafalou, V., and Orli´c, M.: A case study of bora-driven flow and density changes on the Adriatic shelf (January 1987), Cont. Shelf Res., 21, 1751–1783, 2001.
Blumberg, A. F. and Mellor, G. L.: A description of a three-dimensional coastal ocean circulation model, In: Heaps, N. S. (Ed.), Three Dimensional Coastal Ocean Models, Coastal and Estuarine Science 4, AGU , Washington, D.C. 16, 1987. Bone, M.: Development of a non-linear levels model and its
ap-plication to bora-driven circulation on the Adriatic shelf, Estuar. Coast and Shelf Sci., 37, 475–496, 1993.
Brzovi´c, N.: Factors affecting the Adriatic cyclone and associated windstorms, Contr. Atmos. Phys., 72, 51–65, 1999.
Deacon, E. L. and Webb, E. K.: Interchange of properties be-tween sea and air, In: Hill M. N. (Ed.), The Sea, Vol 1. Wiley-Interscience Publication, New York, 43–315, 1962.
Dempsey, D. P.: Insights into Alpine lee cylogenesis from numeri-cal simulations of moderately rotating, low Froude number first past three-dimensional obstacles, International Conference on Mountain Meteorology and ALPEX, Garmisch-Partenkirchen, 5–9 June 1989, 87–89, 1989.
Enger, L. and Grisogono, B.: The response of bora-type flow to sea surface temerature, Quart. J. R. Meteor. Soc., 124, 1227–1244, 1998.
Gould, W. J.: Effects of non-linearities of current meter compasses, Deep Sea Res., 20, 423–427, 1973.
Grubiˇsi´c, V.: Application of the hydraulic theory in cases of bora with strong upstream flow, Rasprave (Papers), 24, 21–28, 1989. Jurˇcec, V.: The Adriatic frontal bora type, Rasprave (Papers), 23,
13–26, 1988.
Jurˇcec, V.: Severe Adriatic bora storms in relation to synoptic de-velopments, Rasprave (Papers), 24, 11–20, 1989.
Kuzmi´c, M.: Exploring the effects of bora over the Northern Adri-atic - CZCS imagery and a mathemAdri-atical model prediction, Int. J. Rem. Sens., 12, 1, 207–214, 1991.
Long, R. R.: Some aspects of the flow of stratified fluids, II, Exper-iments with a two fluid system, Tellus, 6, 97–115, 1954. Makjani´c, B.: Bora, sirocco and etesian winds (in Croatian), Prilozi
poznavanju vremena i klime SFRJ 5, 1–56, 1978.
Mellor, G. L.: An equation of state for numerical models of ocean and estuaries, J. Atmos. Ocean. Technol., 8, 609–611, 1991. Mellor, G. L. and Blumberg, A. F.: Modeling vertical and
horizon-tal diffusivities with the sigma coordinate system, Mon. Weather Rev., 113, 1379–1383, 1985.
Mellor, G. L. and Yamada, T.: Development of turbulent closure models for geophysical fluid problems, Rev. Geophys. Space Phys., 20, 851–875, 1982.
Miljak, J.: Dependance of the wind speed on the offshore distance (in Croatian), B. Sc. Thesis, University of Zagreb, 47, 1982. Orli´c, M., Kuzmi´c, M., and Vuˇcak, Z.: Wind-curl currents in the
Northern Adriatic and formulation of bottom friction, Oceanol. Acta, 9, 425–431, 1986.
Orli´c, M., Kuzmi´c, M., and Pasari´c, Z.: Response of the Adriatic Sea to the bora and scirocco forcing, Cont. Shelf Res., 14, 91– 116, 1994.
Penzar, B., Penzar, I., and Orli´c, M.: Weather and climate of the Croatian Adriatic (in Croatian), Feletar, Hrvatski hidrografski in-stitut, Split, 258, 2001.
Polli, S.: La Bora nei golfi di Trieste e Venezia, Boll. Soc. Ital. Geof. Meteorol., 6, 2–3, 1956.
Poulain, P-M. and Raicich, F.: Forcings, In: Cushman-Roisin, B., Gaˇci´c, M., Poulain, P-M., and Artegiani, A. (Eds.): Physical Oceanography of the Adriatic Sea: Past, Present and Future, Kluwer Academic Publishers, Dordrecht, 45–65, 2001. Pullen, J., Doyle, J. D., Hodur, R., Ogston, A., Book, J. W., Perkins,
H., and Signell, R.: Coupled ocean-atmosphere nested modeling of the Adraitic Sea during winter and spring 2001, J. Geophys. Res., 108, No.C10, 3320, doi:10.1029/2003JC001780, 2003. Shapiro, R.: Smoothing, filtering and boundary effects, Rev.
Geo-phys. Space Phys., 8, 359–387, 1970.
Sherwin, T. J.: Measurements of current speed using an Aanderaa RCM4 current meter in the presence of surface waves, Cont. Shelf Res., 8, 131–144, 1988.
Smirˇci´c, A., Gaˇci´c, M., and Dadi´c, V.: Surface waves, Acta Adriat., 37, 17–34, 1996.
Smith, R. B.: On severe downslope winds, J. Atmos. Sci., 42, 2598– 2603, 1985.
Smith, R. B.: Aerial observations of the Yugoslavian bora, J. Atmos. Sci., 44, 269–297, 1987.
Smith, R. B. and Sun, J.: Generalized hydraulic solutions relevant to severe downslope winds, J. Atmos. Sci., 44, 2934–2939, 1987. Sounders, P. M.: Near-surface current measurements, Deep Sea
Res., 23, 249–257, 1976.
Sounders, P. M.: Overspeeding of a Savonius rotor, Deep Sea Res., 27, 755–759, 1980.
Stravisi, F.: Bora driven circulation in Northern Adriatic, Boll. Ge-ofis. Teor. Appl., 19, 95–102, 1977.
Sturm, B., Kuzmi´c, M., and Orli´c, M.: An evaluation and interpre-tation of CZCS-derived patterns on the Adriatic shelf, Oceanol. Acta, 15, 13–23, 1992.
Thompson, R. O. R. Y.: Low-pass filters to suppress inertial and tidal frequencies, J. Phys. Oceanogr., 13, 1077–1083, 1983. Vuˇceti´c, V.: Bora on the Northern Adriatic, 12–18 April 1982,
Rasprave (Papers), 23, 27–44, 1988.
Yoshino, M. M.: Local Wind Bora, University of Tokio Press, Tokio, 289, 1976.
Yoshino, M. M., Yoshino, M. T., Yoshimura, M., Mitsui, K., Urushibara, K., Ueda, S., Owada, M., and Nakamura, K.: Bora regions as revealed by wind-shape trees on the Adriatic Coast, In: Yoshino, M. M. (Ed.): Local Wind Bora, University of Tokio Press, Tokio, 289, 1976.
Zore-Armanda, M. and Gaˇci´c, M.: Effects of bora on the circulation in the North Adriatic, Ann. Geophys., 5, 93–102, 1987.