HAL Id: hal-00318244
https://hal.archives-ouvertes.fr/hal-00318244
Submitted on 21 Dec 2006
HAL is a multi-disciplinary open access
archive for the deposit and dissemination of
sci-entific research documents, whether they are
pub-lished or not. The documents may come from
teaching and research institutions in France or
abroad, or from public or private research centers.
L’archive ouverte pluridisciplinaire HAL, est
destinée au dépôt et à la diffusion de documents
scientifiques de niveau recherche, publiés ou non,
émanant des établissements d’enseignement et de
recherche français ou étrangers, des laboratoires
publics ou privés.
Remote sensing of a near-Earth neutral line during the 5
October 2000 substorm
D. Nagata, S. Machida, S. Ohtani, S. B. Mende, Y. Saito, T. Mukai
To cite this version:
D. Nagata, S. Machida, S. Ohtani, S. B. Mende, Y. Saito, et al.. Remote sensing of a near-Earth
neutral line during the 5 October 2000 substorm. Annales Geophysicae, European Geosciences Union,
2006, 24 (12), pp.3497-3505. �hal-00318244�
www.ann-geophys.net/24/3497/2006/ © European Geosciences Union 2006
Annales
Geophysicae
Remote sensing of a near-Earth neutral line during the 5 October
2000 substorm
D. Nagata1, S. Machida1, S. Ohtani2, S. B. Mende3, Y. Saito4, and T. Mukai4
1Department of Geophysics, Kyoto University, Kyoto 606-8502, Japan
2Applied Physics Laboratory, Johns Hopkins University, Laurel, MD 20723, USA 3Space Sciences Laboratory, University of California, Berkeley, CA 94720, USA
4Institute of Space and Astronautical Science, Japan Aerospace Exploration Agency, Sagamihara, Kanagawa 229-8510, Japan
Received: 6 July 2006 – Revised: 24 October 2006 – Accepted: 10 November 2006 – Published: 21 December 2006
Abstract. In this paper we examined the continuous
mo-tions of a near-Earth neutral line during the recovery phase of the 5 October 2000 substorm. Estimation was based on the PSBL ion beam model proposed by Onsager (1991) and the Geotail observations. Estimated distances from the Earth ranged from 20 to 60 REand retreated tailward at velocities
of 250 and 300 km/s. This event initiated with the arrival of solar wind discontinuity. Simultaneous observations of electromagnetic field and electrons indicate the existence of earthward propagating waves associated with field-aligned currents. Based on these observations, we suggest that the source of the PSBL ion beams was the retreating near-Earth neutral line formed by the compression of the magneto-sphere. Two scenarios of near-Earth neutral line motion in the tail dynamics are also proposed. One is the formation of plural neutral lines to create a long plasmoid. The other is the oscillation of one neutral line between the near-Earth region and the mid-tail stagnant plasmoid.
Keywords. Magnetospheric configuration and dynamics;
Plasma sheet; Storms and substorms
1 Introduction
Magnetic reconnection in the tail plasma sheet is one of the basic components of substorm dynamics and it changes the structure of the tail plasma sheet through the formation of neutral lines (Hones, 1977).
Neutral lines are observed in the near-Earth tail (−20>Xgsm>−30 RE) at the onset of substorm (Nagai et
al., 1998; Machida et al., 1999; Miyashita et al., 1999). After its formation, the neutral line retreats downtail during the re-covery phase of the substorm (Russell and McPherron, 1973; Hones, 1977; Forbes et al., 1981). The speed of the neutral
Correspondence to: D. Nagata
line retreat is important to understand the cycle of the sub-storm (Angelopoulos et al., 1996).
The relative position of the satellite to the neutral line is in-ferred from in-situ observations of the plasma flow direction and the north-south magnetic field direction (Nishida et al., 1996). The consecutive observation of tailward plasma flow with the southward magnetic field and then earthward plasma flows with the northward magnetic field indicates the retreat of the neutral line (Ueno et al., 1999). However, reliance on single point measurements requires a statistical approach, such as a timing analysis to discuss the speed of the neutral line retreat.
Another approach to estimate the motion of the neutral line is to use counter-streaming field-aligned beams in the PSBL (Forbes et al., 1981; Onsager et al., 1991; Elphic et al., 1995). Elphic et al. (1995) analyzed the PSBL measurements by ISEE-2 and estimated the locations of neutral lines based on the model proposed by Onsager. Estimated distances from the Earth were larger than 60 RE, which correspond to the
distant neutral lines.
In this paper we discuss the motion of a near-Earth neutral line by applying the Onsager model to the PSBL ion beam observations made by Geotail. We visually surveyed Geo-tail observations from 1995 to 2003, and found the longest-duration counter-streaming ion beam event during the 5 Oc-tober 2000 substorm. Other events were short-lived for trac-ing the motion or indicated distant neutral lines. In addition to Geotail observations, we use ACE, GOES-8, Interball-Tail, and IMAGE observations to analyze this event from the global point of view.
This paper is structured as follows. In Sect. 2 we present an overview of the event and details of the PSBL observa-tions. In Sect. 3 we estimate the location of a PSBL ion beam source based on ion velocity distributions. In Sect. 4 we dis-cuss the implications of the observations and analysis, and our conclusions are summarized in Sect. 5.
3498 D. Nagata et al.: Remote sensing of a near-Earth neutral line
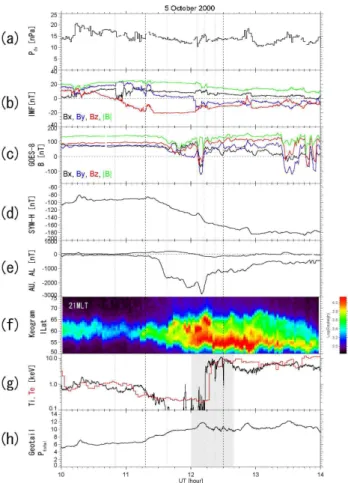
Fig. 1. Summary plot of the 5 October 2000 substorm: (a) ram pressure of solar wind, (b) interplanetary magnetic field, (c) mag-netic field at the GOES-8, (d) SYM-H index, (e) AU and AL in-dices, (f) keogram from the IMAGE/FUV-WIC at 21:00 MLT, (g) ion temperature at the Geotail (black) and electron temperature at the Interball-Tail magnified by 5 (red), (h) total pressure at the Geo-tail.
2 Observations
2.1 Instrumentation
In this paper we utilize the following satellite data and geo-magnetic indices:
1. Solar wind and interplanetary magnetic field (IMF) data from the SWEPAM (McComas et al., 1998) and the MAG (Smith et al., 1998) instruments on board the ACE satellite.
2. Magnetic field data at geosynchronous altitude mea-sured by the GOES-8 satellite (Singer et al., 1996). 3. AL, AU (Davis and Sugiura, 1966), and SYM-H
(Iye-mori, 1990) indices from the World Data Center for Ge-omagnetism at Kyoto.
4. Two-min resolution auroral images from the FUV (Mende et al., 2000) on board the IMAGE satellite.
5. Electron and magnetic field data from the ELECTRON (Sauvaud et al., 1997) and the FM-3I on board the Interball-Tail.
6. Low energy particle, magnetic field, and electric field data from the LEP-EA (Mukai et al., 1994), the MGF (Kokubun et al., 1994), and the EFD (Tsuruda et al., 1994) on board the Geotail satellite, respectively. LEP-EA measures 3-D ion and electron velocity distributions from 21 eV to 44 keV with a time resolution of 12 s. All ions are assumed to be protons.
2.2 Overview
To acquire the perspective of the event, we first take an overview of the ground and satellite observations. Figure 1 plots, from the top, the ram pressure of solar wind, the in-terplanetary magnetic field (IMF) in GSM measured by the ACE satellite (ACE data are shifted by a 46-min travel time to the Earth), the magnetic field in GSM at geosynchronous altitude measured by the GOES-8 satellite, the SYM-H in-dex, the AU and AL indices, the keogram at 21:00 MLT from the far-ultraviolet Wideband Imaging Camera (FUV-WIC) on board the IMAGE satellite, the ion temperature measured by the Geotail and electron mean energy measured by the Interball-Tail (magnified by 5), the total pressure measured by the Geotail satellite in the magnetotail. The ACE satellite was located around (225, −27, −9) RE in GSE in the solar
wind at 12:00 UT. The locations of GOES-8, Geotail, and Interball-Tail are shown in Fig. 2.
The growth phase of this substorm started around 10:50 UT when the IMF turned from northward to south-ward. Subsequently, the Interball-Tail escaped from the plasma sheet to the lobe. The onset of the expansion phase was around 11:18 UT after the northward turning of the IMF arrived. At 11:36 UT the auroral oval expanded poleward and Geotail escaped from the plasma sheet to the lobe.
At 12:05 UT the discontinuity of the solar wind arrived. At the same time the GOES-8 experienced the sudden change in the magnetic field, which indicates that the magnetopause crossed the GOES-8. A concurrently observed positive bay of the SYM-H index and a total pressure increase at Geotail (in the tail lobe) suggest the compression of the magneto-sphere.
At 12:12 UT the compression signatures ceased and then Geotail and Interball-Tail were engulfed by the plasma sheet. At the same time a poleward boundary intensification (PBI) was observed near the footprint of Geotail (Fig. 2c). After-ward, the AL index started to recover while the main UV oval lasted until 14:00 UT.
In summary, PBIs and plasma sheet expansions were observed after the compression of the magnetosphere at 12:10 UT during the 5 October 2000 substorm.
Fig. 2. Locations of the GOES-8, Geotail, and Interball-Tail during 10:00–14:00 UT on 5 October 2000, projected on the GSM (a) XY and (b) XZ plane. Magnetic field line by Tsyganenko T96 model (Tsyganenko, 1995) from the position of Geotail at 12:14 UT and the magnetopause model (Shue et al., 1997) are also shown for ref-erence. (c) The far-ultraviolet image from the IMAGE satellite. Footprints of Geotail and Interball-Tail are mapped with the T96 model.
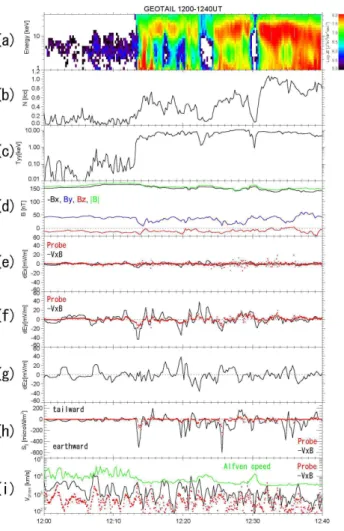
Fig. 3. (a) Energy-time diagram of ion, (b) ion density, (c) ion temperature, (d) magnetic field in GSM, (e–g) three components of electric field perturbation, (h) field-aligned Poynting flux, (i) phase velocity and Alfv´en velocity.
2.3 PSBL crossing
In this section we closely examine the plasma sheet expan-sion from 12:00 UT to 12:40 UT with plasma and elec-tromagnetic field measurements made by Geotail (Fig. 3). Earthward propagating waves and counter-streaming field-aligned ion beams were simultaneously observed.
From the lobe to the plasma sheet, the plasma temperature suddenly increased at 12:13 UT at Geotail. Near the lobe-plasma sheet interface, Geotail observed negative By
pertur-bations. These perturbations indicate a pair of field-aligned currents in the outermost PSBL (Ueno et al., 2002).
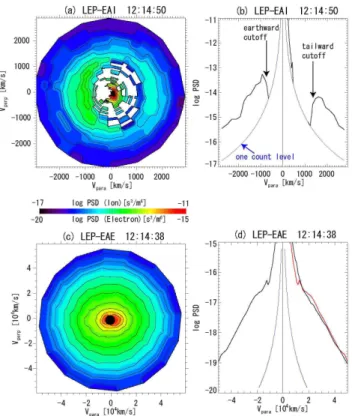
The existence of a field-aligned current pair is supported by electron measurements. Though electron velocity distri-butions were almost isotropic (Fig. 4c), excesses of tailward electrons at energies 1.1–4.4 keV and earthward electrons be-low 200 eV are evident (Fig. 4d). These electrons are consis-tent with the field-aligned currents indicated by the By
per-turbations (Hoshino et al., 2001; Fujimoto et al., 2001; Nagai et al., 2003).
3500 D. Nagata et al.: Remote sensing of a near-Earth neutral line
Fig. 4. (a) Ion velocity distribution in the B-C plane at 12:14 UT, (b) 1-D cut of ion velocity distribution at the B-axis, (c) 2-D cut of electron velocity distribution at 12:14 UT, (d) 1-D cut of the elec-tron velocity distribution at the B-axis at 12:14 UT. Red line shows the mirror image of the opposite side.
Magnetic field perturbations, together with electric field perturbations, produced earthward field-aligned Poynting flux (Fig. 3h). The electric field was estimated in two ways: (1) the electric field measured by the probe of the EFD in-strument (3-s resolution) with an assumption that Ez=0, (2) the electric field computed from −V ×B (12-s resolution). Perturbations of fields are calculated by subtracting a 10-min running average from the original electric and magnetic field data. The phase velocity computed by the E-to-B ratio did not exceed the Alfv´en velocity calculated by the ion density and magnetic field.
During this PSBL crossing, ion velocity distributions con-sisted of counter-streaming field-aligned beams with lower-energy cutoffs and sometimes cold ions (Fig. 4a), which were probably outflows from the auroral ionosphere. Tail-ward beams had higher energy and lower flux than earthTail-ward beams (Fig. 4b). Estimation of the beam source location in the next section is based on the lower-energy cutoffs of these counter-streaming beams.
Fig. 5. Schematic pictures of the Onsager model: (a) an original configuration, (b) a more realistic configuration.
3 Analysis
In this section we estimate the distance from the Geotail to the ion beam source by the lower-energy cutoffs of the counter-streaming ion beams.
3.1 Onsager model
To estimate the distance from the source of ion beams, we utilize the PSBL model proposed by Onsager et al. (1991) which assumes:
1. a plasma sheet as a source of PSBL beams, 2. a neutral line located tailward of the spacecraft, 3. a near-Earth mirror point located earthward of the
spacecraft,
4. a quasi-steady convection toward the central plasma sheet,
5. the conservation of an energy and magnetic moment of particles.
As a consequence of convection toward the center of the plasma sheet and the finite tailward extent of the plasma sheet, which is caused by the neutral line formation, parti-cles with lower cutoff energy are those which originate from the region just earthward of the neutral line.
In the PSBL, these particles come to the spacecraft loca-tion in two ways (Fig. 5a). The earthward traveling particles come directly from the plasma sheet to the spacecraft, while the tailward traveling particles are reflected once by the near-Earth magnetic mirror to reach the spacecraft. Flight time T1
of the particles coming directly from the source to the space-craft is given by
T1=SN/VE, (1)
and for particles reflected by the magnetic mirror, is given by T2=(SN+2Sm)/VT, (2)
where SN is the distance from the spacecraft to the source
and Smis the distance from the spacecraft to the near-Earth
mirror point. VT and VE are the tailward and earthward
cut-off velocities, respectively. Here we used the constant travel velocity approximation to calculate the flight time.
If T1 and T2 are equal to Ttof, which is the time for the
field line being convected from the source to the spacecraft location, SN is obtained as
SN=2Sm/(VT/VE−1). (3)
VE and VT are known by measurements and Sm is defined
as the field line length calculated by Tsyganenko T96 and IGRF magnetic field models. Then we evaluated the downtail distance to the source |XN|from the Earth as
|XN| =SN+ |XSC|, (4)
where |XSC|is the downtail distance of the spacecraft. The
estimated value |XN|is the value at the time when the
parti-cles left the source. We define event time, Tevent, by
Tevent=Tobs−Ttof, (5)
where Tobs is the time when particles were observed at the
spacecraft. Event time means the time when particles were launched from the source. The motion of the source is ob-tained by |XN|versus Teventplot.
3.2 Uncertainties and limitations
The finite energy resolution of the actual instrument results in an uncertainty of the source location. The lower bound SN− and upper bound SN+are expressed as
SN+=2Sm/(VT−/V +
E −1), (6)
SN−=2Sm/(VT+/VE−−1), (7)
where+ and− of V
T and VE correspond to the upper and
lower borders of each energy passband. This is the prime factor for the uncertainties in SN.
To stabilize our estimate, we took a running average of the cutoff velocities and calculated the downtail distances of the neutral line based on them. If cutoff velocities change coher-ently, this procedure works properly (Elphic et al., 1995).
Because event time has also an uncertainty which comes from the flight time estimate, we fitted the obtained |XN|
versus event time plot by the two-dimensional, least-squares fitting of Awaya (1983).
Fig. 6. (a) Time histories of lower-energy cutoffs, (b) estimated distance from the Geotail to the beam source, (c) estimated beam source location against the event time.
There are two limitations for this analysis based on the quasi-steady assumption. First, the temporal resolution of this analysis is regulated by the particle flight time from the source to the spacecraft. Second, this analysis is not suitable for rapid motion of the source due to the finite speed of the particle. Hence, this analysis is applicable for slow and long time scale motion of the particle source.
3.3 Application
Figure 6a shows the cutoff velocities of earthward and tail-ward beams from 12:13 UT to 12:31 UT. Lower-energy cut-offs were determined as the energy passband of non-zero flux before flux falls below the one-count level (Fig. 4b). Bars in-dicate the velocity width corresponding to the energy width of each energy step of the LEP instrument. Solid lines are the 36-s (3 samples) window running average of the cutoff velocities.
We could not identify lower-energy cutoffs in the follow-ing intervals:
1. Before 12:13 UT, Geotail was in the lobe.
2. From 12:22 UT to 12:24 UT, tailward low energy cut-offs were sometimes below the one-count level of the instrument, and only earthward cutoffs were obtained. 3. From 12:24 UT to 12:28 UT, cold ions sometimes
merged with beam components.
4. After 12:31 UT, Geotail was embedded in the plasma sheet and flux did not fall before the one-count level. Figure 6b shows the downtail distance SN. Diamonds
rep-resent the distances from the smoothed cutoff velocities. Sm
is set to be 8.5 REfrom the length of the field line calculated
by the T96 model. Bars indicate the uncertainties of SN due
3502 D. Nagata et al.: Remote sensing of a near-Earth neutral line
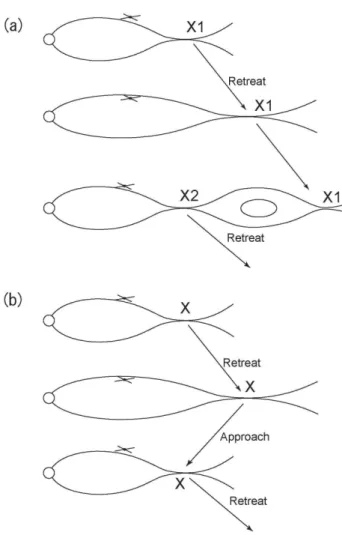
Fig. 7. Schematic picture of two possible neutral line motion sce-narios. (a) Zigzag motion between the near-Earth region and mid-tail region, (b) formation of plural X-lines by successive reconnec-tions.
Figure 6c shows |XN|against event time (diamonds). The
downtail distance of Geotail, |XSC|was about 7.1 REduring
this interval. The dashed line shows the smoothed value of |XN|. We divided points into two groups, from 12:10 UT to
12:18 UT and from 12:21 UT to 12:28 UT. Solid lines were linear fittings for the two intervals.
At 12:11 UT the estimated distance suddenly decreased from 40 RE to 25 RE at the speed of 2200 km/s. This short
and rapid motion is beyond the limitation of the analysis be-cause it is faster than the lower-energy cutoffs of the earth-ward beam and its duration is comparable to the particle flight time (1–2 min). This apparent motion is probably due to the temporal effect associated with the formation of the neutral line.
From 12:11 UT to 12:17 UT the estimated source retreated at the average speed of 250±15 km/s to about 45 RE. At
12:17 UT the distance seemed to start to decrease. There is a gap of estimation between 12:18 UT and 12:21 UT, due to the escape of Geotail from the plasma sheet. At 12:21 UT the
distance retreated again at the speed of 300±25 km/s from 25 REto 45 RE.
4 Discussion
Based on the above observations and analysis, we suggest that the source of PSBL ion beams was the near-Earth neutral line formed by the compression of the magnetosphere. 4.1 Existence of magnetic reconnection downtail
Since we took a remote sensing approach, we should discuss whether the source of PSBL ion beams was the reconnec-tion neutral line. We list up the following five supporting evidences:
1. The compression of the magnetosphere could work as a trigger of magnetic reconnection (Horiuchi et al., 2001). 2. Initial positions of the beam source were around X=−25 RE, where the near-Earth neutral line is
con-sidered to be formed at the onset of substorm (Nagai et al., 1998).
3. Reconnection creates field-aligned beams in the PSBL by a Speiser-type acceleration of enhanced electric fields around the diffusion region (Hoshino et al., 1998). These field-aligned beams fill the empty lobe flux tubes and cause the plasma sheet expansions (Forbes et al., 1981; Ohtani and Mukai, 2006).
4. Simultaneously observed field-aligned currents and earthward propagating waves are consistent with the impulsive reconnection located downtail of the Geotail (Nakamura et al., 2004). These waves are also consid-ered to be the source of the PBIs observed at the Geo-tail footprint (Wygant et al., 2000; Mende et al., 2003; Dombeck et al., 2005).
5. PBIs are related to the plasma flows burst in the plasma sheet (Lyons et al., 2002). These flows are generally considered as the major manifestation of magnetic re-connection.
4.2 Retreat speed of neutral line
As for the retreat speed, we can compare our result to the retreat speed of a plasmoid. The average retreat speed of a plasmoid is 350 km/s at 30 RE(Ieda et al., 1998). This value
is slightly larger than our results. If the neutral line retreat follows the ejection of a plasmoid, this magnitude relation of the retreat speed is reasonable.
The speed of the neutral line motion for an asymmetric boundary condition is derived as 10% of the local Alfv´en speed from the numerical simulation (Fujimoto, 2005). If we assume a proton density of 0.1 /cc and a magnetic field of 40 nT at X=−30 RE (This event was under high solar wind
ram pressure and typical parameters could be inadequate), then the Alfv´en speed is 2800 km/s and thus predicts the re-treat speed of 280 km/s. This is comparable to our estimated values.
4.3 Interpretations of neutral line motion
From Fig. 6c there are two interpretations of the neutral line motion. One is that two near-Earth neutral lines were created and retreated (Fig. 7a). The other is that only one near-Earth neutral line went back and forth between the near-Earth re-gion and mid-tail rere-gion (Fig. 7b). If the former is the case, the recurrent formation of the neutral lines forms a long plas-moid between the neutral lines. This could be the mechanism to create 20 RElong plasmoids seen in the distant tail (Slavin
et al., 2003).
The latter case is not denied observationally. Ohtani et al. (2004) reported the case study of the earthward moving neutral line. They discussed that the neutral line they ana-lyzed did not reach the lobe and was confined in the plasma sheet.
If the neutral line returns at X=−60 RE, a maxima of the
occurrence rate is expected there, due to the deceleration be-fore the earthward motion. In fact, distribution of the neutral lines statistically obtained by Ueno et al. (1999) has a maxi-mum occurrence rate at Xgsm=−60 RE. A possible cause of
the neutral line deceleration is the formation of the stagnant plasmoid under the southward IMF condition (Nishida et al., 1996). This event also occurred under the strong southward IMF condition.
Two cases give totally different results on the plasmoid re-lease and hence mass and energy loss in the tail plasma sheet. The effect of IMF Bzon the plasmoid evolution is worth
fur-ther investigation. In both cases, we would like to point out that the 10-min duration of retreat motion is comparable with the typical duration of BBFs and PBIs. This might suggest that the motion of neutral line is a part of the global ULF oscillation of the magnetotail (Lyons et al., 2002).
4.4 Future application of the Onsager model
In this paper we investigated the motion of near-Earth neutral line during the recovery phase of a substorm. Another in-teresting application of the Onsager model is traveling com-pression regions (TCRs) during the expansion phase of a sub-storm. These TCRs are likely related to the reconnection in the near-Earth tail region (Owen et al., 2005). There is a pos-sibility to reveal the motion of the neutral line at the start of the substorm expansion by applying the Onsager model to the PSBL crossing associated with TCRs. In this case, high time resolution measurements of the electrons are necessary because the typical duration of TCRs in the near-Earth tail region is as short as 35 s (Slavin et al., 2005). We will hope-fully investigate this issue in a future study.
5 Conclusions
From the lower-energy cutoffs of PSBL ion beams, we esti-mated the motion of the near-Earth neutral lines during the 5 October 2000 substorm. The retreat speeds of the neutral line were 250 and 300 km/s. The estimated motion of the neutral line suggests either the creation of plural X-lines or the oscillation of one neutral line between near-Earth and the midtail. Two cases are totally different for a plasmoid re-lease but not distinguishable by our remote sensing analysis, thereby making coordinated multi-satellite studies necessary. Acknowledgements. The authors thank E. Sagawa for handling the
IMAGE/FUV data. The Geotail EFD data was provided by K. Tsu-ruda and H. Hayakawa. The Geotail MGF data was provided by T. Nagai. ACE, GOES-8, and Interball-Tail data were via CDAWeb. SYM-H, quick look AL and AU indices were from WDC-Kyoto. This work was supported by the JSPS Research Fellowships for Young Scientists. The work at APL was supported by NASA grants NAG5-13024. A part of this study was conducted when the primary author was a visiting student at APL.
Topical Editor I. A. Daglis thanks J. Slavin and another referee for their help in evaluating this paper.
References
Angelopoulos, V., Mitchell, D. G., McEntire, R. W., Williams, D. J., Lui, A. T. Y., Krimigis, S. M., Decker, R. B., Christon, S. P., Kokubun, S., Yamamoto, T., Saito, Y., Mukai, T., Mozer, F. S., Tsurada, K., Reeves, G. D., Hughes, W. J., Friis-Christensen, E., and Troshichev, O.: Tailward progression of magnetotail ac-celeration centers: Relationship to substorm current wedge, J. Geophys. Res., 101, 24 599–24 620, 1996.
Awaya, T.: Data Analysis, Japan Scientific Societies Press, ISBN: 4762263796, 1983.
Davis, T. N. and Sugiura, M.: Auroral electrojet activity index AE and its universal time variations, J. Geophys. Res., 71(3), 785– 801, 1966.
Dombeck, J., Cattell, C. A., Wygant, J. R., Keiling, A., and Scudder, J.: Alfv´en waves and Poynting flux observed simultaneously by Polar and FAST in the plasma sheet boundary layer, J. Geophys. Res., 110, A12S90, doi:10.1029/2005JA011269, 2005.
Elphic, R. C., Onsager, T. G., Thomsen, M. F., and Gosling, J. T.: Nature and location of the source of plasma sheet boundary layer ion beams, J. Geophys. Res., 100, 1857–1870, 1995.
Forbes, T. G., Hones, E. W. Jr., Bame, S. J., Asbridge, J. R., Pash-mann, G., Sckopke, N., and Russell, C. T.: Evidence for the tail-ward retreat of a magnetic neutral line in the magnetotail during substorm recovery, Geophys. Res. Lett., 8, 261–264, 1981. Fujimoto, M., Nagai, T., Yokokawa, N., Yamade, Y., Mukai, T.,
Saito, Y., and Kokubun, S.: Tailward electrons at the lobe-plasma sheet interface detected upon dipolarizations, J. Geophys. Res., 106, 21 255–21 262, 2001.
Fujimoto, M. and Tandokoro, R.: Two-fluid simulations of the X-line retreat process, American Geophysical Union, Fall Meeting 2005, abstract #SM12A-05, 2005.
Hones Jr., E. W.: Substorm processes in the magnetotail: Comments on “On hot tenuous plasmas, fireballs, an boundary layers in the
3504 D. Nagata et al.: Remote sensing of a near-Earth neutral line
Earth’s magnetortrail,” by Frank, L. A., Ackerson, K. L., and Lepping, R. P., J. Geophys. Res., 82, 5633–5640, 1977. Horiuchi, R., Pei, W., and Sato, T.: Collisionless driven
reconnec-tion in an open system, Earth Planets Space, 53, 439–445, 2001. Hoshino, M., Mukai, T., Yamamoto, T., and Kokubun, S.: Ion dy-namics in magnetic reconnection: Comparison between numer-ical simulation and Geotail observations, J. Geophys. Res., 103, 4509–4530, 1998.
Hoshino, M., Mukai, T., Terasawa, T., and Shinohara, I.: Suprather-mal electron acceleration in magnetic reconnection, J. Geophys. Res., 106, 25 979–25 998, 2001.
Hubert, B., Gerard, J.-C., Evans, D. S., Meurant, M., Mende, S. B., Frey, H. U., and Immel, T. J.: Total electron and proton energy input during auroral substorms: Remote sensing with IMAGE-FUV, J. Geophys. Res., 107, 1183, doi:10.1029/2001JA009229, 2002.
Ieda, A., Machida, S., Mukai, T., Saito, Y., Yamamoto, T., Nishida, A., Terasawa, T., and Kokubun, S.: Statistical analysis of the plasmoid evolution with Geotail observations, J. Geophys. Res., 103, 4453–4466, 1998.
Iyemori, T.: Storm-time magnetospheric currents inferred from midlatitude geomagnetic field variations, J. Geomagn. Geo-electr., 42, 1249–1265, 1990.
Kokubun, S., Yamamoto, T., Acuna, M. H., Hayashi, K., Shiokawa, K., and Kawano, H.: The GEOTAIL magnetic field experiment, J. Geomag. Geoelectr., 46, 7–21, 1994.
Lyons, L. R., Zesta, E., Xu, Y., Sanchez, E. R., Samson, J. C., Reeves, G. D., Ruohoniemi, J. M., and Sigwarth, J. B.: Auro-ral poleward boundary intensifications and tail bursty flows: A manifestation of a large-scale ULF oscillation?, J. Geophys. Res., 107, 1352, doi:10.1029/2001JA000242, 2002.
Machida, S., Miyashita, Y., Ieda, A., Nishida, A., Mukai, T., Saito, Y., and Kokubun, S.: GEOTAIL observations of flow velocity and north-south magnetic field variations in the near and mid-distant tail associated with substorm onsets, Geophys. Res. Lett., 26, 635–638, 1999.
McComas, D. J., Bame, S. J., Barker, P., Feldman, W. C., Phillips, J. L., Riley, P., and Griffee, J. W.: Solar Wind Electron Proton Alpha Monitor (SWEPAM) for the Advanced Composition Ex-plorer, Space Sci. Rev., 86, 563–612, 1998.
Mende, S. B., Heetderks, H., Frey, H. U., Lampton, M., Geller, S. P., Habraken, S., Renotte, E., Jamar, C., Rochus, P., Spann, J., Fuselier, S. A., Gerard, J.-C., Gladstone, R., Murphree, S., and Cogger, L.: Far ultraviolet imaging from the IMAGE spacecraft, Space Sci. Rev., 91, 243–318, 2000.
Mende, S. B., Carlson, C. W., Frey, H. U., Peticolas, L. M., and Østgaard, N.: FAST and IMAGE-FUV observa-tions of a substorm onset, J. Geophys. Res., 108, 1344, doi:10.1029/2002JA009787, 2003.
Miyashita, Y., Machida, S., Nishida, A., Mukai, T., Saito, Y., and Kokubun, S.: GEOTAIL observations of total pressure and elec-tric field variations in the near and mid-distant tail associated with substorm onsets, Geophys. Res. Lett., 26, 639–642, 1999. Mukai, T., Machida, S., Saito, Y., Hirahara, M., Terasawa, T., Kaya,
N., Obara, T., Ejiri, M., and Nishida, A.: The low energy particle (LEP) experiment onboard the GEOTAIL satellite, J. Geomag. Geoelectr., 46, 669–692, 1994.
Nagai, T., Fujimoto, M., Saito, Y., Machida, S., Terasawa, T., Naka-mura, R., Yamamoto, T., Mukai, T., Nishida, A., and Kokubun,
S.: Structure and dynamics of magnetic reconnection for sub-storm onsets with Geotail observations, J. Geophys. Res., 103, 4419–4440, 1998.
Nagai, T., Shinohara, I., Fujimoto, M., Hoshino, M., Saito, Y., Machida, S., and Mukai, T.: Geotail observations of the Hall current system: Evidence of magnetic reconnection in the mag-netotail, J. Geophys. Res., 106, 25 929–25 950, 2001.
Nagai, T., Shinohara, I., Fujimoto, M., Machida, S., Nakamura, R., Saito, Y., and Mukai , T.: Structure of the Hall current system in the vicinity of the magnetic reconnection site, J. Geophys. Res., 108, 1357, doi:10.1029/2003JA009900, 2003.
Nakamura R., Baumjohann, W., Nagai, T., Fujimoto, M., Mukai, T., Klecker, B., Treumann, R., Balogh, A., Reme, H., Sauvaud, J.-A., Kistler, L., Mouikis, C., Owen, C. J., Fazakerley, A. N., De-whurst, J. P., and Bogdanova, Y.: Flow shear near the boundary of the plasma sheet observed by Cluster and Geotail, J. Geophys. Res., 109, A05204, doi:10.1029/2003JA010174, 2004.
Nishida, A., Mukai, T., Yamamoto, T., Saito, Y., and Kokubun, S.: Magnetotail convection in geomagnetically active times 1. Dis-tance to the Neutral lines, J. Geomag. Geoelectr., 48, 489–501, 1996.
Ohtani, S., Ueno, G., Yamaguchi, R., Singer, H., Creutzberg, F., Yumoto, K., Kitamura, K., and Mukai, T.: Tail dynamics dur-ing the growth phase of the 24 November 1996, substorm event: Near-Earth reconnection confined in the plasma sheet, J. Geo-phys. Res., 109, A05211, doi:10.1029/2003JA010299, 2004. Ohtani, S. and Mukai, T.: Plasma sheet expansion:
Sta-tistical characteristics, J. Geophys. Res., 111, A05206, doi:10.1029/2005JA011547, 2006.
Onsager, T. G., Thomsen, M. F., Elphic, R. C., and Gosling, J. T.: Model of electron and ion distributions in the plasma sheet boundary layer, J. Geophys. Res., 96, 20 999–21 011, 1991. Owen, C. J., Slavin, J. A., Fazakerley, A. N., Dunlop, M. W., and
Balogh, A.: Cluster electron observations of the separatrix layer during traveling compression regions, Geophys. Res. Lett., 32, doi:10.1029/2004GL021767, 2005.
Russell, C. T. and McPherron, R. L.: The magnetotail and sub-storms, Space Sci. Rev., 15, 205–266, 1973.
Sauvaud, J.-A, Koperski, P., Beutier, T., Barthe, H., Aoustin, C., Thocaven, J. J., Rouzaud, J., Penou, E., Vaisberg, O., and Borod-kova, N.: The Interball-Tail ELECTRON experiment: Initial re-sults on the low-latitude boundary layer of the drawn magneto-sphere, Ann. Geophys., 15, 587–595, 1997,
http://www.ann-geophys.net/15/587/1997/.
Shue, J.-H., Chao, J. K., Fu, H. C., Russell, C. T., Song, P., Khurana, K. K., and Singer, H. J.: A new functional form to study the solar wind control of the magnetopause size and shape, J. Geophys. Res., 102, 9497–9512, 1997.
Singer, H. J., Matheson, L., Grubb, R., Newman, A., and Bouwer, S. D.: SPIE Proceedings, Volume 2812, 4–9 August, 1996. Slavin, J. A., Lepping, R. P., Gjerloev, J., Fairfield, D. H., Hesse,
M., Owen, C. J., Moldwin, M. B., Nagai, T., Ieda, A., and Mukai, T.: Geotail observations of magnetic flux ropes in the plasma sheet, J. Geophys. Res., 108, 1015, doi:10.1029/2002JA009557, 2003.
Slavin, J. A., Tanskanen, E. I., Hesse, M., Owen, C. J., Dun-lop, M. W., Imber, S., Lucek, E. A., Balogh, A., and Glassmeier, K.-H.: Cluster observations of traveling compres-sion regions in the near-tail, J. Geophys. Res., 110, A06207,
doi:10.1029/2004JA010878, 2005.
Smith, C. W., Acuna, M. H., Burlaga, L. F., L’Heureux, J., Ness, N. F., and Scheifele, J.: The ACE Magnetic Field Experiment, Space Sci. Rev., 86, 613–632, 1998.
Tsuruda, K., Hayakawa, H., Nakamura, M., Okada, T., Matsuoka, A., Mozer, F. S., and Schmidt, R.: Electric field measurements on the GEOTAIL satellite, J. Geomag. Geoelectr., 46, 693–711, 1994.
Tsyganenko, N. A.: Modeling the Earth’s magnetospheric magnetic field confined with a realistic magnetopause, J. Geophys. Res., 100, 5 599–5 612, 1995.
Tsyganenko, N. A. and Stern, D. P.: Modeling the global magnetic field of the large-scale Birkeland current systems, J. Geophys. Res., 101, 27 178–27 198, 1996.
Ueno, G., Machida, S., Mukai, T., Saito, Y., and Nishida, A.: Dis-tribution of X-type magnetic neutral lines in the magnetotail with Geotail observations, Geophys. Res. Lett., 26, 3341–3344, 1999. Wygant, J. R., Keiling, A., Cattell, C. A., Johnson, M., Lysak, R. L., Temerin, M., Mozer, F. S., Kletzing, C. A., Scudder, J. D., Pe-terson, W., Russell, C. T., Parks, G., Brittnacher, M., Germany, G., and Spann, J.: Polar spacecraft based comparisons of in-tense electric fields and Poynting flux near and within the plasma sheet-tail lobe boundary to UVI images: An energy source for the aurora, J. Geophys. Res., 105, 18 675–18 692, 2000.