RILEM TC ISC-239 recommendation on
reliable assessment of on-site concrete
strength with NDT testing.
Denys BREYSSE1, Jean-Paul BALAYSSAC2
1 Université Bordeaux, I2M, UMR 5295 CNRS (formerly, now retired) 2 LMDC, INSA/UPS Génie Civil, Toulouse, France
RESUMEThis paper adresses the most original issues that have been studied by the RILEM TC
in order to achieve a reliable non-destructive assessment of on-site concrete strength. The assessment concerns the local strength, the mean strength and the standard deviation of local strengths. The recommendation is based on the two concepts of prescribed tolerance interval regarding the assessed parameter and of risk of wrong assessment. A minimum number of cores is available, which depends on the more or less ambitious estimation quality level (EQL), the repeatability of measurements (TRP) which must be quantified and the characteristics of concrete. The recommendation also covers the issue of selecting the core location (through conditional coring), choosing the conversion model (the bi-objective method is put forward), and checking the assessment error.
Mots-clefs Concrete strength, concrete variability, measurement repeatability, risk
I. CONSIDERING RISK, A NEW PARADIGM FOR CONCRETE ASSESSMENT
A. Research priorities and lacks
NDT has been promoted for several decades as a mean able to provide a reliable estimate of concrete strength. However, a validated methodology that guarantees the quality and efficiency of this process is still missing. The use of NDT is based on the possibility to use a “conversion model” (commonly an empirical relationship taken from the literature or built from a calibration dataset) thanks to which an estimated strength value is derived from that of a NDT test result (this concept may be extended when several NDT are used in combination). In practice, rebound hammer and ultrasonic pulse velocity measurement are the most commonly used NDT for assessing strength. Whereas the measurement process has been standardized for most common NDT, this is not the case for the concrete strength estimation process, and the assessor has no way to know how far from the “true strength” is the estimated strength. The research efforts have concentrated on the technical issues of measurement and on the choice of the “optimal” conversion model. Two basic issues remain widely open: (a) the definition of the more adapted investigation program and data processing, (b) the assessment of the accuracy of the strength assessment. Facing these open questions, structural managers and engineers remain often
60
reluctant to use NDT in common practice and prefer to base their strength estimation on the core data.
B. Why the risk dimension must be central ?
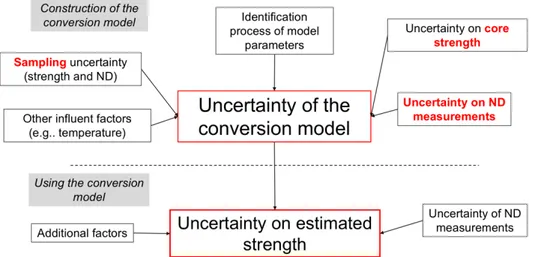
The non-destructive strength assessment issue deserves a paradigm change, that will be easily understood by looking at Figure 1. A conversion model is required for deriving strength estimates from NDT results. Any uncertainty in this model implies some uncertainty in the estimation. And many causes exist which result in uncertain conversion models (upper part of the figure). The two main causes are the uncertainty on ND measurements (which may be large on site, and is often not even estimated!) and the sample uncertainty resulting from the limited number of samples. The former cause has not been paid enough attention until a recent date.
FIGURE 1. Uncertainties arising in the different stages of the strength estimation process
When the lower part of the figure is considered, it comes to an “uncertain” conversion model fed by new data (new ND measurements, having their own uncertainty), and possibly additional uncontrolled influencing factors (e.g. a temperature or humidity that may be different from that used at the previous stage. The estimated strength therefore clearly appears as the result of a random process. Repeating the same whole process would lead to a statistical distribution, when a unique process delivers a unique value, whose distance from the “real” value is a random variable. Obtaining a reliable strength assessment requires that all factors contributing to the final uncertainty are well-known and controlled.
C. How the assessment can be made reliable ?
The challenge is no more to identify the true strength but to estimate it with some tolerance interval, and at a given (accepted) risk. It is possible to write:
p (fc, true – fc, true) < fc, est < p (fc, true + fc, true) = 1- (1)
where fc, true is the (unknown) true value of concrete strength, fc, est is the estimated concrete strength, fc, true is the half of tolerance interval on the true strength and (1- ) is the confidence level of the estimation (or is the risk of a wrong assessment, i.e. outside the prescribed tolerance interval).
61
The larger the number of cores used for calibrating the conversion model, the more accurate the estimation (i.e. the smaller the tolerance interval for given risk level). However, because of the combined effects of all uncertainties on the final estimation, the number of cores cannot be related in a simple way to the final accuracy. This dependence was studied into details in specific studies which considered both real data and synthetic data [1-3]. Two new concepts have been defined, namely the Estimation Quality Level (EQL) and the Test Result Precision (TRP).
The EQL corresponds to the degree of requirement of the strength estimation challenge. It can be adapted to fit a variety of situations, according to the amount of resources (limited budget, few data...) or to safety requisites. Three different EQLs are defined that correspond to progressively more ambitious requirements, as described in Table 1 (this table is simplified from that included in the recommendations [4]). Three targets are considered, which are respectively the mean strength, the strength standard deviation (concrete variability) and the mean error on the local strength value, RMSE. At the first level EQL1, estimating the mean strength is the unique challenge, with a tolerance interval of +/- 15% around its true value. At the two other levels, the three targets are considered, with a higher ambition for EQL3 than for EQL2.
TABLE 1. Relation between estimation quality levels (EQL) and the target tolerance intervals on strength assessment (simplified version)
Estimated property EQL1 EQL2 EQL3
Mean 15% 15% 10%
Standard deviation not addressed 4 MPa 2 MPa
RMSE not addressed 6 MPa 4.5 MPa
The Test Result Precision (TRP) is related to the measurement uncertainties and corresponds to the scatter which is easy to quantify, by simply repeating NDT measurements at a same test location or at a close distance. Recommendations prescribe how many test results are required in order to assess TRP, which can be expressed either by the standard deviation of test results or by their coefficient of variation (COVrep). Table 2 (also simplified from that provided in the recommendations) illustrates how the TRP level is derived from the measured COVrep, both for rebound test results and ultrasonic pulse velocity test results.
TABLE 2. Definition of the TRP classes TRP1 high precision TRP2 medium precision TRP3 poor precision rebound (RH) COVrep 3% 3% < COVrep 7% COVrep > 7% ultrasonic pulse
velocity (UPV) COVrep 1% 1% < COVrep 3% COVrep > 3%
The threshold values given in the Table result from an analysis of the sensitivity of each non-destructive technique to strength variations, and from a review of what level of repeatability can be obtained in practice. For instance, it can be pointed out that commonly available UPV test results (with direct measurements) will fall in the TRP2 class, or even in TRP1 class in some cases, while typical RH test results will mostly fall in TRP2 or TRP3 classes. The TRP1 class is very difficult to obtain with rebound measurements on a real structure, which affects the precision of the conversion model and, as a consequence, that of the concrete strength estimation.
62
II. KEY TASKS OF THE RECOMMENDED ASSESSMENT PROCESS
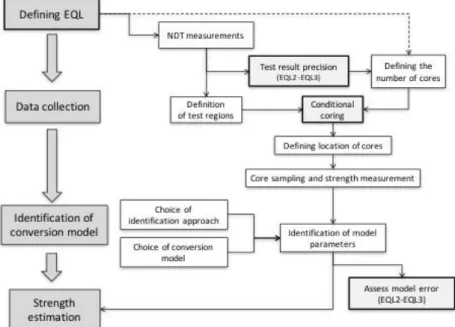
The flowchart describes how to achieve a reliable strength assessment. Several important issues must be pointed. The definition of the required quality of the assessment (EQL) is the first task, as it impacts the next steps, and primarily the number of cores required. This is also true for the uncertainty of ND measurements (TRP) which must be assessed from a specific series of tests.
FIGURE 2. Flowchart of the assessment process and key steps
Conditional coring is recommended. It corresponds to choosing core locations at places that guarantee the best coverage of strength distribution within the whole structure. The choice of the mathematical shape of the conversion model is less crucial than expected from literature. Several options are offered by the recommendations. A last issue is the (recommended) quantification of the final model error, that can be done easily without any additional core, and is not limited to check any “good correlation” between measured and estimated strengths on some control cores.
REFERENCES
(1) D. Breysse, J.P. Balayssac, S. Biondi, A. Borosnyói, E. Candigliota, L. Chiauzzi, V. Garnier, M. Grantham, O. Gunes, V. Luprano, A. Masi, V. Pfister, Z.M. Sbartai, K. Szilagyi, Non-destructive assessment of in situ concrete strength: comparison of approaches through an international benchmark, Mat. Str., 50, 133, 2017.
(2) M. Alwash., D. Breysse D., Z.M. Sbartai, Using Monte-Carlo simulations to evaluate the efficiency of different strategies for nondestructive assessment of concrete strength, Mat. Str., 50, 1, 2017.
(3) D. Breysse, J.P. Balayssac , Strength assessment in reinforced concrete structures: from research to improved practices, Constr. Build. Mat.,182, p. 1-9, 2018.
(4) D. Breysse, J.P. Balayssac, S. Biondi, D. Corbett, A. Gonçalves, M. Grantham, V. Luprano, A. Masi, A. Valente Monteiro, Z.M. Sbartai, Recommendation of RILEM TC249-ISC on Non Destructive In-situ Strength Assessment of Concrete, Mat. Str., 52, 4, Aug. 2019.
63