Dissociation Mechanisms of Dissolved
Alkali Silicates in Sodium Hydroxide
The MIT Faculty has made this article openly available.
Please share
how this access benefits you. Your story matters.
Citation
Dupuis, Romain et al. "Dissociation Mechanisms of Dissolved Alkali
Silicates in Sodium Hydroxide." Journal of Physical Chemistry C 124,
15 (March 2020): 8288–8294 © 2020 American Chemical Society
As Published
http://dx.doi.org/10.1021/acs.jpcc.0c01495
Publisher
American Chemical Society (ACS)
Version
Final published version
Citable link
https://hdl.handle.net/1721.1/129405
Terms of Use
Creative Commons Attribution 4.0 International license
Cite This:J. Phys. Chem. C 2020, 124, 8288−8294 Read Online
ACCESS
Metrics & More Article Recommendations*
sı Supporting InformationABSTRACT: Recent accelerated simulations of the decondensa-tion of silicates by sodium hydroxide open a window on understanding complex mechanisms of the depolymerization of silicate chains. Herein, complex mechanisms of decondensation that involve two water molecules (or OH−groups) are unveiled. The study of two different solutions, having the same chemical composition but in different concentration, help one to draw more general conclusions on the dissociation mechanism in silicate solutions. We find that the dissociation is not always assisted by single water molecules but that in about 20% of the cases two
water molecules (or OH−) are present in the near environment. The results underline the importance to consider explicit water solvent in which water molecules are reactive.
I. INTRODUCTION
For a long time, efforts have been done to investigate and control the silicate chemistry.1−9 It is the base for the formation or phase transformation of liquids, gels, and minerals, yet it is unclear how water and silicate chains interplay at the atomic scale, depending on the chemistry of the solution and on the shape of the interface.10,11It is mainly due to the complexity with experimentally characterizing the structure of silicates in solution.12Besides, molecular dynamics have helped to rationalize the outcomes of experiments. Until recently, it was also challenging to reproduce the bond formation or dissociation by atomistic simulations due to the high activation energy barrier (a few tenths of an electronvolt) to make or break Si−O bonds,13−15 but new methods have been used to produce reliable silicate structures.14,16,17 This opens the paths to study in detail the statistics of the mechanisms of decondensation for silicate chains. Indeed, long-time trajectories offer a large set of configurations of interest to observe multiple bond-breaking incidents.
In this work, we employ statistical analysis to describe the dissociation mechanisms, triggered by the addition of sodium hydroxide, that has been reproduced by accelerated molecular dynamics. The loss of connectivity is compared to experiments for two different solutions. Both systems contain sodium silicates in solution. In particular, we detail how several water molecules or OH− groups could participate in bond dissociation.
II. METHODS
II.A. Experimental Samples. The chemical composition of the two sodium silicate solutions were adjusted according to
the final products we wanted to synthesize. The first one (named Zsol) is usually used to synthesize some aluminosi-licate zeolites. The initial concentrations are [Si] = 2.25 mol· L−1 and [Na+] = 1.31 mol·L−1, which correspond to molar
ratios of SiO2/Na2O = 2.44 and H2O/Na2O = 85. A sodium
hydroxide solution ([NaOH] = 1.31 mol·L−1) is added to this solution in order to study the silicate decondensation process, as explained by Dupuis et al. in 2019.17 The final concentrations are [Si] = 1.125 mol·L−1 and [Na+] = 1.31
mol·L−1(final molar ratios are SiO2/Na2O = 1.72 and H2O/
Na2O = 85). The second one (named Gsol) is commonly used
to synthesize alkali-activated materials as geopolymers. Two solutions were characterized by varying the concentration of sodium hydroxide at fixed silicate and water content ([Si] = 5.8 mol·L−1and [Na+] = 9.66 mol·L−1, which correspond to molar ratios of SiO2/Na2O = 1.2 and H2O/Na2O = 11.5, and
[Si] = 5.8 mol·L−1and [Na+] = 13 mol·L−1, which correspond to molar ratios of SiO2/Na2O = 0.89 and H2O/Na2O = 11.5).9 The NMR spectra corresponding to the two solutions are presented in Figure 1 in the initial state and after decondensation. As usually observed, the mean connectivity of the silicate species decreases when the ratio SiO2/Na2O
decreases.9,18
Received: February 20, 2020
Revised: March 16, 2020
Published: March 25, 2020
II.B. Simulated Solutions. In order to study the decondensation of Gsol and Zsol upon the addition of sodium hydroxide, we havefirst built two structures for the simulation. The stoichiometry and the connectivity of the initial structure have been chosen to be in agreement with the experimental data obtained for Zsol (seeTable 1).
The two structures that has been simulated are given in
Figure 2. The colloidal liquid is composed of 50 SiO4groups, initially organized in 4 silicate species, 2344 water molecules, and 28 Na+and OH−groups. The simulation cell size has been
set to 42 × 42 × 42 Å3 in order to correspond to the experimental density of 1.135 kg/m3. The system Gsol is
composed of 40 SiO4groups, initially organized in 14 silicate
species ranging from monomers to quadrimers, 294 water molecules, and 94 Na+ and OH−groups. The simulation cell size has been set to 30× 20 × 20 Å3, in agreement with the
experimental density that has been measured experimentally (about 1.35 kg/m3).
II.C. Simulation Details. In order to simulate the effect of adding sodium hydroxide to these two systems, we have used a method based on the parallel tempering (PT) technique, which consists of replicating the initial state and running dynamics at different temperatures in order to enhance energy barrier crossing. After 10 steps, if it is energetically favorable, replicas are exchanged.19,20As detailed by Dupuis et al.,16 in brief-PT, the simulation is interrupted regularly (herein every 1000 steps) and all replica are repopulated with the configuration that has been obtained at the lowest temperature. A set of 16 temperatures ranging from 300 to 800 K has been used.
In order to account for chemical reactions, we have used the reactive force field ReaxFF21 using the parameters given by Hahn et al.,22in which parameters for Na are refitted on the basis of the parameters of Fogarty et al.23The parameters for Si/O/H have been previously tested and used to study various silicate systems.16,22,24,25 In particular, it is possible to reproduce the polymerization and depolymerization of silicates using this set of parameters. Moreover, for silica-base gel formation, this set of parameters has shown good efficiency to simulate the polymerization of pure silica gels.14
All simulations have been carried out with LAMMPS code using the python interface. The time step was set to 0.2 fs to ensure that the dynamics of water molecules is correctly
described. The temperature has been controlled using the Nosé−Hoover thermostat.26
Brief-PT runs were simulated using the NVT ensemble. If the average distribution of the Qn
does not evolve for 1000 steps, the convergence is achieved. For both systems, the convergence has been reached after about 200 ps of PT; note that this does not correspond to real time. The Qn distributions have been compared to nuclear
magnetic resonance measurements made after decondensation. The agreement with the experiments is good for both solutions (see Table 1). In the view of previous works, the brief-PT technique enables one to study decondensation in quantitative agreement with experimental data.16,17
II.D. Statistical Analysis. In order to study the decondensation mechanism, we have proceeded to a statistical analysis along the trajectories that have been simulated. In particular, we have developed an algorithm to study the mechanism of decondensation (see Figure 3). In this algorithm, we are seeking for water molecules or hydroxides that enter the near environment during the dissociation, which defines one event. The environment of the dissociation, as shown in Figure 3, is the space defined by the sum of two spheres of radius Rccentered on the position of the two silicon
atoms that are being dissociated. After each dissociation, we rewound the dynamics and counted the number of events that occurred during the last 250 000 steps of the simulation. Since water molecules can be dissociated in the near environment
Figure 1.NMR spectra as a function of the chemical composition for (a) Zsol and (b) Gsol.
Figure 2.Snapshot of the original configurations. Silicon, oxygen, and sodium atoms are represented in yellow, red, and blue, respectively. The water molecules have been omitted for clarity.
The Journal of Physical Chemistry C pubs.acs.org/JPCC Article
https://dx.doi.org/10.1021/acs.jpcc.0c01495
J. Phys. Chem. C 2020, 124, 8288−8294 8289
during the 5 ps, we record the number of events and the character of the event (entering of a water molecule or entering of an OH−group) at the moment the molecule enters the dissociation environment.
III. RESULTS AND DISCUSSION
III.A. Dissociation by Sodium Hydroxide. The first outcome of this work is that brief-PT increases the dynamics of dissociation and enables one to observe this complex process, which involves specifically many bond-breaking but also some bond-forming episodes. Validating if the simulation is reliable or not comes down to comparing the evolution of Qnobtained
by the simulation to the experimental data. In previous works,16,17 it has been shown that the polymerization and decondensation of silicates can be reproduced by this method. The decondensation can be due to either the breaking of a silicate chain or the opening of rings into a silicate chain.
In this work, we compare the decondensation on two different aluminosilicate solutions that are significantly differ-ent. The water to silicon ratio is equal to 47 in Zsol and 7 in Gsol. The sodium hydroxide concentration that will depoly-merize the silicate chains is also modified accordingly with the experiments.
The decondensation of silicate chains in these systems has been previously reported.9,17The values for the experimental and simulated systems are reported inTable 1.
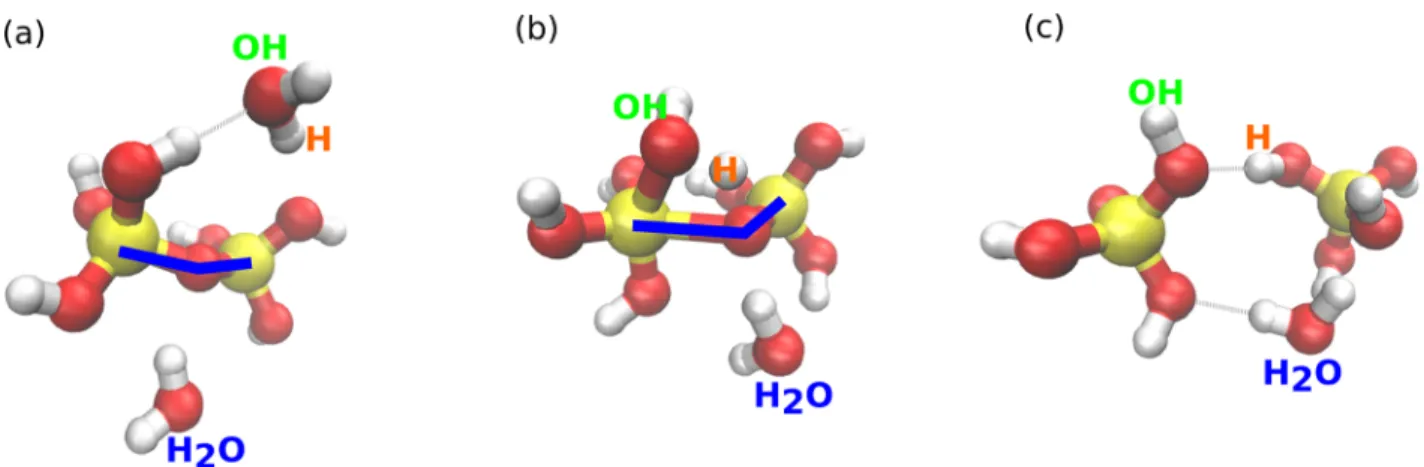
III.B. Dissociation Mechanisms. The simplest dissocia-tion mechanism for the silicate chains in the presence of OH− groups is the following:
is a necessary step for the decondensation, in a reversed process to the oligomerization.27 Meanwhile, a second water molecule pulls awayin the opposite direction to the first water moleculethe oxygen atom of the Si−O−Si bridge (as shown in blue in Figure 4b. Finally, the Si−O−Si bond is
dissociated. This example shows that these complex mecha-nisms involve not only a single hydroxide group to make the dissociation. This motivates a detailed study of the dissociation mechanisms.
III.C. Distance Probability Distribution. The distribution of Na−Si, Na−O, and Si−O distances gives insights on the dissociation mechanism. Figure 5 shows the distribution of oxygen atoms in the near environment to the silicon atoms that are being dissociated during 25 000 steps before dissociation. The first peak, located at 1.6 Å, corresponds to the bond distance of the Si−O covalent bond. For this peak, we observe that Zsol has a slightly shorter Si−O distance distribution than Gsol. This seemingly comes from the higher concentration of Na+in Gsol compared to Zsol, because cations may play a role in the strength of the Si−O bonds.28Herein, we observe that, in Gsol, the Si−O bond is longer and weaker than in Zsol. The small bump at about 2 Å seemingly comes from the Si−O bond distance during the dissociation that is being elongated.
Figure 6shows the probability offinding an oxygen atom at a given distance from the sodium atoms during the 250 000 steps before dissociation. Note that only the oxygen from silicates has been considered to calculate the O−Na bond distance. Therefore, the veryfirst peak, located around 1.6−2.0 Å, corresponds to the Na−O distance when Na+ is in charge
compensation and not the distance of the solvated ion with its first solvation layer. If we consider a Gaussian distribution, this peak is larger for Gsol (σ = 0.84 Å) than for Zsol (σ = 0.76 Å). For these curves, we observe that the sodium ions are localized both in thefirst (first peak) and in the second solvation layer (second peak) around the silicates during the decondensation. The position of the second peak, around 2.4 Å, is consistent with the one calculated for sodium hydroxide solutions.29 Nonetheless, in our calculations, we observe that at higher sodium hydroxide concentration, in Gsol, the peak is shifted to
Figure 3.Graphical representation of the algorithm used to make the statistical analysis. In this algorithm, we consider two spheres of radius Rccentered on the two silicon atoms that are being dissociated. Each water molecule or OH−that enters these spheres during the last 5 ps is counted (25 000 steps). Note that in PT, the time is not real-time but accelerated.
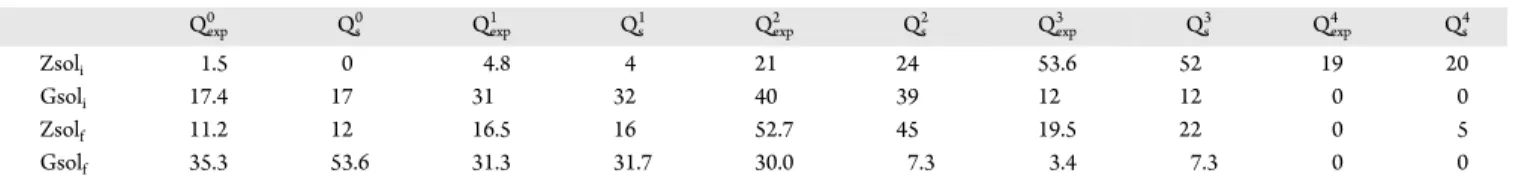
Table 1. Table of Qnfor the Two Silicate Solutionsa
Qexp0 Qs0 Qexp1 Qs1 Qexp2 Qs2 Qexp3 Qs3 Qexp4 Qs4
Zsoli 1.5 0 4.8 4 21 24 53.6 52 19 20
Gsoli 17.4 17 31 32 40 39 12 12 0 0
Zsolf 11.2 12 16.5 16 52.7 45 19.5 22 0 5
Gsolf 35.3 53.6 31.3 31.7 30.0 7.3 3.4 7.3 0 0
aSubscripts:“exp” denotes the experimental value, “s” denotes the simulated value averaged over the last 5 ps of the simulation (see theSupporting Information),“i” denotes initial, and “f” denotes final.
slightly longer distances. In our calculations, we consider not only OHbut all the O atoms around Na+. Therefore, the shift
of this peak could stem from the other O atoms in water molecules or silicates. The shift indicates that, at higher NaOH concentration and lower water/Si ratio, the second solvation layer is farther from the silicate groups.
Regarding the Si−Na distance probability distribution, shown in Figure 7, we observe a large first peak with a maximum at 3.2 Å for Gsol and 3.4 Å for Zsol. A reason for the Si−Na distance being reduced during the dissociation of alkali silicates in Gsol compared to Zsol could be that the (Na + Si)/ (H2O) concentration is higher in Gsol. This also indicates that more Na+ are in a charge compensation scheme in Gsol compared to Zsol.
III.D. Diluton by Pure Water. To compare, we have simulated the dissolution of both systems by a solution of pure water (with no sodium hydroxide), and we have found that, in the time-scale of the simulation, the silicate chains are not affected by dilution (i.e., Qn does not evolve). This was thought to be due to the formation of rings that are self-protected structures in gels,14,16 but in Gsol, there is a low
quantity of rings and we observe that same effect. Therefore, in this mechanism, the passivation effect most probably comes from the presence of Na+. Na+ is generally considered to elongate and weaken bonds (as observed in Figure 6). Therefore, the passivation effect could come from the protonation of the silicate chains that releases sodium ions in the solution. In these systems, Na+ could protect the silicate chains if they are solvated by attracting molecules from their first solvation shell, in particular, water molecules and possibly OH−. Hereinafter, we investigate the mechanisms of dissociation in more detail.
III.E. Angular Distribution Function. The O−Si−O angular distribution function, shown in Figure 8, is also an important piece of information when investigating how OH− groups are added to the end of the chain or Si−O−Si bridges. A regular silica monomer has a single symmetric peak at about 109.5° that corresponds to the angle for an ideal tetrahedron. In the simulated phases, we observe a major peak located at 107° for Zsol and shifted to 105° for Gsol. Fitting the peaks with a Gaussian distribution gives aσ of 24° for Zsol and 27° for Gsol. The peak for Gsol is larger than for Zsol, which
Figure 4.Example of a complex mechanism of dissociation. (a) In thefirst snapshot, a water molecule enters the dissociation sphere. (b) In second snapshot, this water molecule is dissociated, the hydrogen atom protonates a nearby silicate chain, and the OH−group connects to a silicon atom. Meanwhile, a water molecule is pulling away the Si−O−Si bridge (as shown in blue in panel b). (c) In the last snapshot, the two silicates have been dissociated.
Figure 5.Probability of having an O atom at a given distance from a Si atom during the dissociation.
Figure 6.Probability of having an O atom at a given distance from a Na+cation during the dissociation.
The Journal of Physical Chemistry C pubs.acs.org/JPCC Article
https://dx.doi.org/10.1021/acs.jpcc.0c01495
J. Phys. Chem. C 2020, 124, 8288−8294 8291
indicates that it might be easier to make an additional Si−OH bond. It has been shown that for other elements, such as Al,13 the energy barrier to form pentamers is dependent on the flexibility of the AlO4 or SiO4 group. In particular, we can
observe inFigure 8that about 2% of the O−Si−O angles are larger than 140°. This corresponds to the opening of the angle during the bond dissociation.
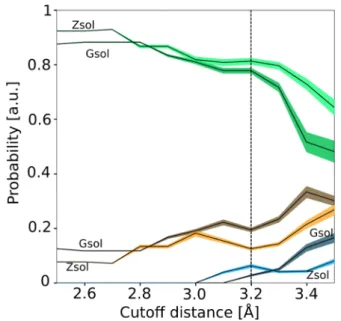
III.F. Combined Role of Water and Hydroxide. To analyze the role of water and hydroxide during the dissociation of alkali silicates, we have plotted the number of events per dissociation. Each event being a water molecule or a hydroxide entering the dissociation environment, as explained previously and shown in Figure 3. In Figure 9, we have plotted the distribution versus Rcut. At small cutoff, for both systems, about
90% of the dissociations happens with a single event, whereas about 10% happens with the combined effect of two molecules (H2O or hydroxides). There is an increase in the number of events for Rcut greater than 3.2 Å. If we consider Rcutgreater
than 3.2 Å, the number of dissociations with only one event suddenly drops to 60%, whereas it increases for two events and three events (25% with two events and 15% with three events). However, these additional molecules probably have a weak contribution to the dissociation.
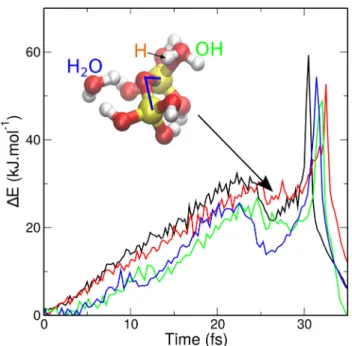
In order to investigate the effect of having a secondary water molecule in the near environment, as observed inFigures 4and
9, we have calculated the energy barrier for the dissociation (Figure 10). The energy barrier is about 50 kJ·mol−1.13 We observe a catalyst effect of the additional water molecule. The energy barrier is reduced by about 8 kJ·mol−1(black and red lines), which corresponds to about 12% of the total energy barrier. Indeed, the pentacoordination of the silicon atom, necessary for the dissociation, is eased by the presence of the second water molecule as it pulls away the Si−O−Si bridge. Moreover, we observe that the dissociation in the presence of OH−instead of H2O is more favorable. Similarly, the addition
of a water molecule reduces the energy barrier of about 5 kJ· mol−1. This indicates that correctly describing the chemistry of the environment is essential for reproducing the dynamics of polymerization and decondensation for silicates.
A non-negligible number of dissociations are due to the combined effect of hydroxide groups and water molecules. Although the dissociation is triggered by the addition of NaOH in our experiments, it has been shown that in other conditions, gels that contain alkali, such as alkali silica reaction gels, have higher connectivity than pure silica gels.16,30,31In these gels, water is solvating ions, which allows for the formation of longer and more connected silicate chains. Further works should focus on trying to connect the solvation degree of ions to the connectivity of silicate chains in colloidal solutions and gels. Note that, for glasses, Na+ is generally considered as a glass
modifier, as it introduces defects due to a change in the local charge compensation scheme.32
Understanding the decondensation mechanism is an important step toward the understanding of recondensation that occurs when adding aluminum to alkali-rich silicate solutions.9 Indeed, the reactivity and diffusion of aluminates with silicates should be related to how accessible reaction sites
Figure 7.Probability of having a Na+cation at a given distance from a Si atom during the dissociation.
Figure 8.Angular distribution function of the O−Si−O angle in the silicon tetrahedron during dissociation.
Figure 9.Probability offinding one (in green), two (in orange), or three (in blue) water molecules in the dissociation sphere versus the cutoff radius.
are and how the silicate structure can be penetrated. Decondensation is the first step toward the formation of aluminosilicate materials, such as geopolymers and zeolites. With sodium hydroxide solutions, silicates might be dissociated prior to recondensation.
This work could also have other implications, for instance, to elucidate the complex chemistry behind the formation of alkali silica gels during the so-called alkali−silica reaction known to cause irreversible damages in cement.33,34 This gel, which forms in water, is described in the literature from the experimental point of view, but little is known about the silicate structure. As we have shown in this work, water participates in the dissolution of silicate structures. Moreover, sodium ions interact with the silicate chains in a charge compensation scheme. The method presented herein could be used to study other solutions, such as sodium-rich solutions, in order to investigate the effect of alkali concentration.
IV. CONCLUSION
In conclusion, two solutions have been studied. Each system has a different silicon/water ratio and sodium/silicon ratio, but similar decondensation (due to the addition of sodium hydroxide) has been observed experimentally and by simulations. The brief-PT technique has been used to reproduce the decondensation of silicates, and the initial and final structures are in good agreement with the NMR experiments.
We have observed that dilution by pure water does not affect the connectivity of the silica chains. This indicates a passivation effect that is not only due to the presence of rings, as suggested in the literature, but most probably of Na+. In both systems, the dissociation of the silicates occurs in processes that involve mostly a single water molecule (or OH−
group), but we have found that about 20% of the dissociations occurs with two water molecules (or OH−group) in thefirst shell around the silicate chain. The water molecule reduces by about 8 kJ·mol−1the energy barrier to dissociate the Si−O−Si bridge. The dissociation is also favored in the presence of OH− groups. This could help to understand how to control the dissociation of silicates and the formation of alkali silicate or aluminosilicates, such as zeolites and geopolymers.
■
ASSOCIATED CONTENT*
sı Supporting InformationThe Supporting Information is available free of charge at
https://pubs.acs.org/doi/10.1021/acs.jpcc.0c01495.
A figure showing the evolution of the connectivity Q during the simulation (PDF)
■
AUTHOR INFORMATIONCorresponding Author
Romain Dupuis − MIT/CNRS/Aix-Marseille Université Joint Laboratory”MultiScale Materials Science for Energy and Environment”, UMI MSE2, Massachusetts Institute of Technology, Cambridge, Massachusetts 02139, United States;
orcid.org/0000-0001-9451-1132; Email:rdupuis@ mit.edu
Authors
Roland Pellenq − MIT/CNRS/Aix-Marseille Université Joint Laboratory”MultiScale Materials Science for Energy and Environment”, UMI MSE2, Massachusetts Institute of Technology, Cambridge, Massachusetts 02139, United States;
orcid.org/0000-0001-5559-4190
Jean-Baptiste Champenois − CEA, DES, ISEC, DE2D, SEAD, LCBC, F-30207 Bagnols-sur-Cèze, France
Arnaud Poulesquen − MIT/CNRS/Aix-Marseille Université Joint Laboratory”MultiScale Materials Science for Energy and Environment”, UMI MSE2, Massachusetts Institute of Technology, Cambridge, Massachusetts 02139, United States; CEA, DES, ISEC, DE2D, SEAD, LCBC, F-30207 Bagnols-sur-Cèze, France
Complete contact information is available at:
https://pubs.acs.org/10.1021/acs.jpcc.0c01495
Notes
The authors declare no competingfinancial interest.
■
ACKNOWLEDGMENTSThe authors acknowledge the The French National Research Agency (ANR) for financial support of the DYNAMISTE project (ANR-15-CE07-0013-02). This work was performed using HPC resources from GENCI- [TGCC/CINES/IDRIS] (Grant 2020-A0070911009). We would like to thank Donatien Gomes Rodrigues for NMR measurements.
■
REFERENCES(1) Iler, R. K. The Chemistry of Silica: Solubility, Polymerization, Colloid and Surface Properties and Biochemistry of Silica; Wiley, 1979. (2) Soules, T. F.; Gilmer, G. H.; Matthews, M. J.; Stolken, J. S.; Feit, M. D. Silica molecular dynamic force fields–A practical assessment. J. Non-Cryst. Solids 2011, 357, 1564.
(3) Rejmak, P.; Dolado, J. S.; Stott, M. J.; Ayuela, A. 29si NMR in Cement: A Theoretical Study on Calcium Silicate Hydrates. J. Phys. Chem. C 2012, 116, 9755.
Figure 10. Energy barrier associated with the dissociation of an isolated silicate dimer with one water molecule (in black), two water molecules (in red), one OH−group (in blue), or one OH−and one water molecule (in green). Energy barriers have been obtained by molecular dynamics performed on a silicate dimer model. The snapshot corresponds to an intermediate state for the system with two water molecules just before the bond-breaking, in the same configuration as the one shown for the liquid inFigure 4b.
The Journal of Physical Chemistry C pubs.acs.org/JPCC Article
https://dx.doi.org/10.1021/acs.jpcc.0c01495
J. Phys. Chem. C 2020, 124, 8288−8294 8293
(9) Aupoil, J.; Champenois, J.-B.; d’Espinose de Lacaillerie, J.-B.; Poulesquen, A. Interplay between silicate and hydroxide ions during geopolymerization. Cem. Concr. Res. 2019, 115, 426.
(10) Manzano, H.; Moeini, S.; Marinelli, F.; van Duin, A. C. T.; Ulm, F.-J.; Pellenq, R. J.-M. Confined Water Dissociation in Microporous Defective Silicates: Mechanism, Dipole Distribution, and Impact on Substrate Properties. J. Am. Chem. Soc. 2012, 134, 2208.
(11) Sulpizi, M.; Gaigeot, M.-P.; Sprik, M. The silica−water interface: How the silanols determine the surface acidity and modulate the water properties. J. Chem. Theory Comput. 2012, 8, 1037 pMID: 26593364.
(12) Smith, M. E.; Holland, D. Atomic-Scale Structure of Gel Materials by Solid-State NMR. In Handbook of Sol−Gel Science and Technology; Klein, L., Aparicio, M., Jitianu, A., Eds.; Springer International Publishing: Cham, Switzerland, 2016; pp 1−43.
(13) Dupuis, R.; Dolado, J. S.; Surga, J.; Ayuela, A. Doping as a Way To Protect Silicate Chains in Calcium Silicate Hydrates. ACS Sustainable Chem. Eng. 2018, 6, 15015.
(14) Du, T.; Li, H.; Zhou, Q.; Wang, Z.; Sant, G.; Ryan, J. V.; Bauchy, M. Atomistic origin of the passivation effect in hydrated silicate glasses. npj Mater. Degrad. 2019, 3, 6.
(15) Trinh, T. T.; Rozanska, X.; Delbecq, F.; Sautet, P. The initial step of silicate versusaluminosilicate formation in zeolite synthesis: a reaction mechanism in water with a tetrapropylammonium template. Phys. Chem. Chem. Phys. 2012, 14, 3369.
(16) Dupuis, R.; Béland, L. K.; Pellenq, R. J.-M. Molecular simulation of silica gels: Formation, dilution, and drying. Phys. Rev. Materials 2019, 3, 075603.
(17) Dupuis, R.; Gomes Rodrigues, D.; Champenois, J.-B.; Pellenq, R.; Poulesquen, A. Time resolved alkali silicate decondensation by sodium hydroxide solution. J. Phys.: Mater. 2020, 3, 014012.
(18) Jansson, H.; Bernin, D.; Ramser, K. Silicate species of water glass and insights for alkali-activated green cement. AIP Adv. 2015, 5, 067167.
(19) Swendsen, R. H.; Wang, J.-S. Replica Monte Carlo Simulation of Spin-Glasses. Phys. Rev. Lett. 1986, 57, 2607.
(20) Jing, Z.; Xin, L.; Sun, H. Replica exchange reactive molecular dynamics simulations of initial reactions in zeolite synthesis. Phys. Chem. Chem. Phys. 2015, 17, 25421.
(21) van Duin, A. C. T.; Dasgupta, S.; Lorant, F.; Goddard, W. A. Reaxff: A Reactive Force Field for Hydrocarbons. J. Phys. Chem. A 2001, 105, 9396.
(22) Hahn, S. H.; Rimsza, J.; Criscenti, L.; Sun, W.; Deng, L.; Du, J.; Liang, T.; Sinnott, S. B.; van Duin, A. C. T. Development of a ReaxFF Reactive Force Field for NaSiOx/Water Systems and Its Application to Sodium and Proton Self-Diffusion. J. Phys. Chem. C 2018, 122, 19613.
(23) Fogarty, J. C.; Aktulga, H. M.; Grama, A. Y.; van Duin, A. C. T.; Pandit, S. A. A reactive molecular dynamics simulation of the silica-water interface. J. Chem. Phys. 2010, 132, 174704.
(24) Rimsza, J. M.; Du, J. Interfacial Structure and Evolution of the Water−Silica Gel System by Reactive Force-Field-Based Molecular Dynamics Simulations. J. Phys. Chem. C 2017, 121, 11534.
Phys. Chem. B 2019, 123, 5121 pMID: 31141363.
(30) Vega, A. J.; Scherer, G. W. Study of structural evolution of silica gel using 1h and 29si NMR. J. Non-Cryst. Solids 1989, 111, 153.
(31) Hou, X.; Kirkpatrick, R. J.; Struble, L. J.; Monteiro, P. J. M. Structural Investigations of Alkali Silicate Gels. J. Am. Ceram. Soc. 2005, 88, 943.
(32) Hehlen, B.; Neuville, D. R. Raman Response of Network Modifier Cations in Alumino-Silicate Glasses. J. Phys. Chem. B 2015, 119, 4093.
(33) Kirkpatrick, R. J.; Kalinichev, A. G.; Hou, X.; Struble, L. Experimental and molecular dynamics modeling studies of interlayer swelling: water incorporation in kanemite and ASR gel. Mater. Struct. 2005, 38, 449.
(34) Benmore, C.; Monteiro, P. J. The structure of alkali silicate gel by total scattering methods. Cem. Concr. Res. 2010, 40, 892.