HAL Id: hal-00297000
https://hal.archives-ouvertes.fr/hal-00297000
Submitted on 1 Jun 2007
HAL is a multi-disciplinary open access
archive for the deposit and dissemination of
sci-entific research documents, whether they are
pub-lished or not. The documents may come from
teaching and research institutions in France or
abroad, or from public or private research centers.
L’archive ouverte pluridisciplinaire HAL, est
destinée au dépôt et à la diffusion de documents
scientifiques de niveau recherche, publiés ou non,
émanant des établissements d’enseignement et de
recherche français ou étrangers, des laboratoires
publics ou privés.
Identification and model based assessment of the
potential water retention caused by land-use changes
A. Wahren, K. Schwärzel, K. H. Feger, A. Münch, I. Dittrich
To cite this version:
A. Wahren, K. Schwärzel, K. H. Feger, A. Münch, I. Dittrich. Identification and model based
assess-ment of the potential water retention caused by land-use changes. Advances in Geosciences, European
Geosciences Union, 2007, 11, pp.49-56. �hal-00297000�
© Author(s) 2007. This work is licensed under a Creative Commons License.
Geosciences
Identification and model based assessment of the potential water
retention caused by land-use changes
A. Wahren1, K. Schw¨arzel1, K. H. Feger1, A. M ¨unch2, and I. Dittrich2
1Institute of Soil Science and Site Ecology, Dresden University of Technology, Tharandt, Germany
2Dr. Dittrich & Partner Hydro-Consult GmbH, Bannewitz, Germany
Received: 15 January 2007 – Revised: 13 April 2007 – Accepted: 15 May 2007 – Published: 1 June 2007
Abstract. The extreme summer flood in the Elbe River wa-tershed initiated a debate on the role of forest conversion and afforestation as measures for preventive flood protection. To quantify the effect of forest conversion and afforestation on flood runoff from catchments reliable model calculations are essential. The article overviews the present state of our work and provides an example for a model- based assess-ment of potential water retention caused by land-use changes in a catchment in the Central Ore Mountains (Saxony, Ger-many). The potential of flood control by land-use manage-ment measures is highly dependant on the site-specific soil and relief conditions and the rainfall event characteristics. The pre-event soil moisture is distinctly lower under forest land-use. Furthermore, infiltration, percolation in the sub-soil is increased. These effects exist for small/medium-scale events whereas they become marginal for extreme events.
1 Introduction
The revitalization and increase of natural water retention po-tentials – notably in headwater catch-ments – is a major component of sustainable flood prevention strategies. It is logical that changes in land-use (e.g. settlements including road-construction, deforestation, distinct practices in arable and grassland management) contribute to an increased fre-quency and severity of flood generation. For forest land-use, it has been stated that afforestation and a promotion of close-to-nature silviculture will considerably increase the water retention in landscapes. However, there is a controver-sial debate on the general applicability of such non-structural flood risk management measures with respect to event size and scale-based physical conditions. To quantify the im-pact of land-use changes on the behavior of flood generation
Correspondence to: A. Wahren
(wahren@frsws10.forst.tu-dresden.de)
in river basins well-founded model calculations are needed. Furthermore, such information is needed for land-use plan-ning and creation of a legal framework (e.g. novel §100 Wa-ter Management Law in Saxony (=S¨achsWG) and/or imple-mentation of specific aspects of the EU-Water-Framework-Directive). This research is undertaken within the framework of the running projects “Analysis, Assessment, and Imple-mentation of Measures for Preventive Flood Protection in the Jeseniky Mountains/Czech Republic” (financed by the DBU) and “FLOODsite – Integrated Flood Risk Analysis and Man-agement Methodologies” (Integrated Project 6th EU-FP).
2 Challenge
As a result of the disastrous floods during recent years, espe-cially the Elbe flood in August of 2002, the novel water law of Saxony (S¨achsWG) contains regulations concerning flood originating areas (“Hochwasserentstehungsgebiete”). Such areas have to be defined by the flood protection authority (S¨achsische Landeshochwasserzentrale).
For the flood originating areas the novel law addresses the conservation and improvement of the natural water retention. The soils should be unsealed or afforested if it is possible. In case of an unavoidable loss or reduction of the natural water retention in these areas a suitable compensation is required (e.g. afforestation).
In order to assess the effectiveness of potential land-use changes at a given location the following two questions are essential (Naef et al., 2000):
– Do the physical settings (notably soils and relief) allow an improved water retention if land-use is changed?
→ runoff generation
– To what extent does runoff from this location contribute to the flood hydrograph of the total catchment?
50 A. Wahren et al.: Potential water retention caused by land-use changes
Gauge A
Gauge B Subregion 2
Outflow from region of balance A
Outflow from region of balance B
Subregion 1 with 6 subareas
Fig. 1. Structure of a model-catchment AKWA-M®.
Therefore, suitable methods and strategies are required. There are different types of models which we use for the identification of the land-use impact on the flood behavior of catchments.
To assess all spatial site information from maps or field investigations for the estimation of the general runoff be-havior expert-systems like WBS-FLAB (Merta et al., 2005) or the PBS (“Scherrer-key”: Naef et al., 2000) were devel-oped. These models provide (without any complex rainfall-runoff calculations) a rough overview about catchments with respect to their runoff generation behavior. Based on this information areas in which fast runoff components are dom-inant can be identified.
However, if individual rainfall events have to be assessed with respect to flood dynamics, e.g. to estimate the impact of the pre-event soil moisture, plot model calculations are indis-pensable. For this purpose, we use the plot model BROOK90 (Federer, 2003). To scale-up the results from the plot model and to consider the runoff concentration components spatial distributed rainfall-runoff models are applied. In our study we apply different models, e.g. AKWA-M® (M¨unch, 2004). The main goal of the ongoing project is to assess land-use options especially afforestion with respect to water retention during flood events. In the following we present an example.
Catchment: Schwarze Pockau River Catchment: Freiberger Mulde River Catchment: Zwickauer Mulde River
Fig. 2. Catchment of the Schwarze Pockau River with gauging
sta-tion Z¨oblitz (Mulde Catchment, Ore Mountains – Elbe Catchment).
3 Calculation example (Schwarze Pockau River)
3.0.1 AKWA-M®
The rainfall-runoff model AKWA-M® is based on the wa-ter budget model AKWA-M (Golf, Luckner 1991; M¨unch 1994). The model was advanced by Dr. Dittrich & Partner Hydro-Consult GmbH (Dittrich et al., 2004). This water bal-ance and rainfall-runoff model simulates the water balbal-ance and flood runoff in watersheds and transforms the different processes from the site-scale to a larger area. It contains physically based components as well as a conceptual back-ground.
The application of AKWA-M® covers manifold tasks in practice, research, and education. With the help of the model the following processes can be simulated and quantified:
– the available water for changing land-use and climate change;
– water balances for management and controlling (dams, water stores, groundwater recovery);
– effects on the water balance resulting from river revital-ization, hydromelioration, groundwater use, urbaniza-tion, or land-use changes;
– anthropogenic influences to protected natural area or landscape;
– water balance of specified areas (mires, waste dispos-als);
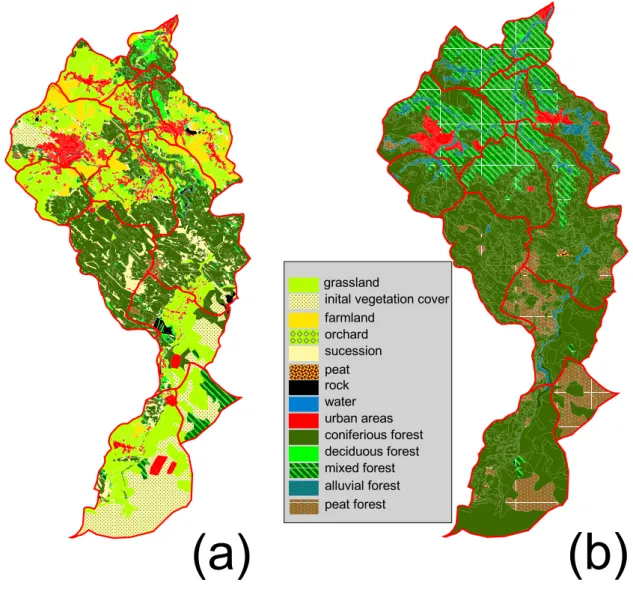
(a)
grassland
inital vegetation cover farmland orchard sucession peat rock water urban areas coniferious forest deciduous forest mixed forest alluvial forest peat forest (b)
Fig. 3. Land-use parameterizations (a) present land-use and (b) PNV.
– changes of groundwater recharge in urban areas with artificial infiltration of precipitation;
– prognostic determination of the system status for flood models;
– flood runoffs from historical precipitation and statistical design storms for different dimensioning tasks; – calculation of storage or dimensioning for dams, flood
detention reservoirs.
The structure of the model-catchment results from subareas (unit areas or hydrotops), combined to partial and balance regions (Fig. 1). In the pre-processing the subareas are pro-vided by uniting the relevant geodata with GIS applications (e.g. ARCVIEW). For simulation of vertical and horizontal processes different calculation modules are available in the program.
– Subareas:
characterized by geodata as land-use, elevation, slope, orientation, soil type, type of groundwater and others. simulated processes: adoption of climate data, intercep-tion, transpiraintercep-tion, evaporaintercep-tion, infiltraintercep-tion, soil water balance, surface and hypodermic runoff, depth infiltra-tion.
– Subregions:
characterized by lithofacies, stream network, and the sum of all subareas.
simulated processes: classification of climate data,
runoff concentration, wave propagation. – Regions of balance:
characterized by the superposition of the sub-region re-sults.
52 A. Wahren et al.: Potential water retention caused by land-use changes 0 50 100 150 200 250 300 350
Jan 91 Jul 91 Jan 92 Jul 92 Jan 93 - Time - Jul 93 Jan 94 Jul 94 Jan 95 Jul 95
so il st o rag e co n ten t [m m ] 0 20 40 60 80 100 120 140 p re c ip it a ti o n [ m m ] Precipitation grassland oak-beech-mixed-forest Site: altitude 650 mNN Soil: sandy loam (Ls 2)
Fig. 4. Water content [mm] in the soil storage for different land-use
(timestep 1 d).
AKWA-M® offers the advantage that it allows to calcu-late the pre-event situation with the water budget model (time step 1d) and than to increase the time discretization for the flood event using actual conditions (storage, water contents etc.) as initial state.
All model calculations are limited by the availability of the required data. The following data are needed for the AKWA-M® calculation.
– Water balance:
Daily or monthly mean climate data (precipitation, air temperature, air humidity, sunshine duration or global radiation, wind speed) Observed data optional (flow rate, soil moisture, groundwater level).
– Flood:
Precipitation high resoluted (1 h to 5 min); to calculate
HQ(T) statistical sum of precipitation P (T ) Optional
observed data (flow rate). – Geodata:
Land-use, geo- and morphological stream data, soil, geology (preparation with geographic information sys-tems (GIS) preferred).
– Subareas:
characterized by geodata as land-use, elevation, slope, orientation, soil type, type of groundwater and others. simulated processes: adoption of climate data, intercep-tion, transpiraintercep-tion, evaporaintercep-tion, infiltraintercep-tion, soil water balance, surface and hypodermic runoff, depth infiltra-tion.
– Subregions:
characterized by lithofacies, stream network, and the sum of all subareas.
simulated processes: classification of climate data,
runoff concentration, wave propagation.
– Regions of balance:
characterized by the superposition of the sub-region re-sults.
All these data were available for the catchment of the Schwarze Pockau. The AKWA-M® model was calibrated for this catchment for the “FLOODsite” project (pilot study “Elbe river” – http://www.floodsite.net/).
The geodata from the Czech part (∼20% of the total catch-ment area) are not in the same spatial resolution as the data
for the part located in Germany. We decided to use the
more detailed soil and land-use maps (BKKonz 1:25 000 and CIR 1:10 000) for the German part and the less detailed
maps (B ¨UK 200 1:200 000 and Corine 1:100 000) for the
Czech part. It is logical that this approach produces inhomo-geneities but the advantages of the high detailed information for the catchment area in Germany preponderate.
3.0.2 Changed land-use
Two different land-use parameterizations have been calcu-lated to show the impact of land-use on the hydrological response of local subareas and the total catchment, respec-tively. Especially the soil water budget is considered in this investigation (change of storage, conductivity, preferential flow etc.). The catchment of the river Schwarze Pockau as a subcatchment of the Mulde river basin was chosen to com-pute land-use effects (Fig. 2). This catchment located in the Ore Mountains is a flood originating area (according to S¨achsWG) and belongs to catchment of the Elbe river, where the most serious flood damages ever in Europe occurred in August 2002.
The two land-use parameterizations are (Fig. 3):
a. present land-use given by CIR-data (LfUG 2006): 41% forest; 47% grassland; 7% farmland (arable land) – cal-ibration
b. potential natural vegetation (PNV) except urban areas given by PNV-data (Schmidt et al., 2003): 97% forest predominant oak-beech mixed forest and spruce forest. The choice of these two parameterizations should represent afforestation to identify the maximum water retention effect caused by forets according to S¨achsWG . Forest instead of grassland or farmland is simulated by the following parame-ter changes:
– an increase of root depth, that means a larger part of the soil storage can be emptied via transpiration;
– an additional organic layer on top of the mineral soil; – a higher amount of organic matter in the top layers of
the mineral soil;
– more macro-pores represented by a higher macro-pore conductivity.
-90 -80 -70 -60 -50 -40 -30 -20 -10 0 0 1 .0 8 .1 9 9 5 0 3 .0 8 .1 9 9 5 0 5 .0 8 .1 9 9 5 0 7 .0 8 .1 9 9 5 0 9 .0 8 .1 9 9 5 1 1 .0 8 .1 9 9 5 1 3 .0 8 .1 9 9 5 1 5 .0 8 .1 9 9 5 1 7 .0 8 .1 9 9 5 1 9 .0 8 .1 9 9 5 2 1 .0 8 .1 9 9 5 2 3 .0 8 .1 9 9 5 2 5 .0 8 .1 9 9 5 2 7 .0 8 .1 9 9 5 2 9 .0 8 .1 9 9 5 3 1 .0 8 .1 9 9 5 0 2 .0 9 .1 9 9 5 0 4 .0 9 .1 9 9 5 0 6 .0 9 .1 9 9 5 Time D if fe re n c e o f w a te r c o n te n t [ m m ] 0 10 20 30 40 50 60 70 80 90 P re c ip it a tio n [ m m ]
Fig. 5. Difference of water content [mm] in the soil storage between grassland and oakbeechmixed forest – red – with precipitation [mm]
-gray – (timestep 1 d).
0
5
10
15
20
25
30
3 1 .0 8 .1 9 9 5 0 1 .0 9 .1 9 9 5 0 2 .0 9 .1 9 9 5 0 3 .0 9 .1 9 9 5 0 4 .0 9 .1 9 9 5 0 5 .0 9 .1 9 9 5 0 6 .0 9 .1 9 9 5 0 7 .0 9 .1 9 9 5 0 8 .0 9 .1 9 9 5R
u
n
o
ff
[
m
³/
s
]
0
2
4
6
8
10
12
P
re
c
ip
it
a
ti
o
n
[
m
m
]
precipitation Qsim Qsim PNV Qbeo∆Qp = 6 m³/s = 24 %
Time [d]
Fig. 6. Runoff (Q) hydrographs [m3/s] gauging station Z¨oblitz.
Qobs– observed runoff, Qsim, (a) – simulated (CIR(a)), Qsim(b) – simulated (PNV(b)), (timestep 1 h).
3.1 Results
To demonstrate the general impact of an afforested grassland plot Fig. 4 shows the different soil storage content for a se-lected soil type calculated with BROOK90. The soil water storage is averaged over all soil layers. It is obvious that dur-ing the summer months the water consumption of the forest vegetation is higher resulting in lower water contents in the
soil storage. In July 1992 and 1993 and in August/September 1995 there are rain events which produce a fast increase of water storage. Figure 5 focuses on heaviest of these events on
1 September (89 mm d−1)and shows the difference between
the two curves in Fig. 4 during the days before and during that event.
Figure 5 points out that there were ∼65 mm less soil mois-ture (minimum of the difference curve) calculated under the
54 A. Wahren et al.: Potential water retention caused by land-use changes -100 - -80 % -80 - -60 % -60 - -40 % -40 - -20 % -20 - -10 % -10 - -5 % -5 - 0 % 0 %
Fig. 7. Difference of flood effective rainfall [%] parameterization (b) – (a) for two rainfall events. Left – 59 mm d−1Right – 229 mm 2 d−1.
beech-oak-mixed forest than under the grassland. But the infiltration limited the water transport into the soil. Thus, only ∼40 mm more (increase of the difference curve from
−65 mm up to −25 mm) could be retained due to the
changed land-use.
The example underlines that not only the additional stor-age is important for the extra water retention but that also the availability of this storage is highly related to the rainfall intensity.
Figure 6 provides the runoff hydrograph for the total catch-ment (gauging station Z¨oblitz) for the same event calculated for the two parameterizations (CIR and PNV) with AKWA-M®. The maximum decrease of the peak flow for that event caused by afforestation is 24%.
Two other events were calculated in order to estimate the effects of land use-changes in their spatial distribution. A
more frequent event (∼60 mm d−1)and the highly infrequent
event from August 2002 (∼230 mm within 2 d). Figure 7
shows for these two events the change in flood effective rain-fall. The flood effective rainfall is the component of the storm hyetograph which is neither retained on the land surface nor which infiltrates into the soil – it is that part of the rainfall which is transformed into fast runoff components. It is obvi-ous that there is nearly no change for the very seldom flood event because the storage capacity is limited. The role of land-use during such heavy rain events is negligible. For the more frequent event the afforested areas show a decrease in flood effective rainfall from 5% up to 20%. Thus, it is evident that the impact of the land-use on flood formation decreases with the increase of rainfall intensity.
Figure 8 shows the corresponding runoff hydrographs for both events.
The peak discharge for the highly infrequent event from August 2002 is nearly unchanged. For the more frequent event the decrease of the peak flow is ∼20%.
0 20 40 60 80 100 120 140 160 0 6 12 18 24 30 36 42 48 54 60 66 72 R u n o ff [ m ³/ s ] 0 3 6 9 12 15 18 21 24 P re c ip it a ti o n [ m m ] precipitation IST PNV Psum = 229 mm
∆Qp = 3 %
Time [h] 0 2 4 6 8 10 12 14 0 6 12 18 24 30 36 42 48 54 60 66 72 R u n o ff [ m ³/ s ] 0 2 4 6 8 10 12 14 P re c ip it a ti o n [ m m ] precipitation IST PNV Psum = 59 mm∆Qp = 21 %
Time [h]Fig. 8. Changed peak flow (Qs) and runoff hydrograph due to
changed land-use (blue – CIR (a), green – PNV (b)) for different rainfall situations (timestep 1 h).
4 Conclusions
Spatial distributed hydrological models – in our study AKWA-M® – are efficient tools to predict effects on water budget and floods due to changes in land-use or climate. Es-pecially the pre-event soil moisture conditions can be taken into account with the here presented approach. Such models provide water budgets and storm runoff components for both single hydrotops and for the catchment in total.
The produced simulation indicates that a projected canopy change might cause a runoff reduction which can be ex-plained as follows:
– A higher interception leads to a decreased throughfall (net precipitation). This causes a lower soil moisture and thereby a greater storage.
– The larger root penetration and higher fine root densities in the subsoil in forested sites cause a larger depletion of the soil moisture during the growing season. There-with a larger storage capability is created. Thus, also intense rainfall events can be buffered more effectively. This increased storage capacity may also be available till the winter months, depending on the atmospheric conditions.
– Deeper soils are able to store higher amounts of water (increased available field capacity).
– The high infiltration capacity of forest soils is another important factor in forested areas. Therefore, less sur-face runoff is generated in comparison with grassland or agricultural crop land. Not only erosion might be re-duced or avoided also the rainfall is disposed through macropores in parts of the soil profile where it can be stored or transferred to the aquifer.
– With increased infiltration runoff formation shifts from the soil surface to deeper parts of the soil (interface to C-horizon, bedrock aquifer). Of course, if soil moisture is high, more hypodermic runoff might be generated. – The potential of flood control by land-use management
measures is highly dependant on the site-specific soil and relief conditions and the rainfall event characteris-tics.
– Reliable model calculations are essential for successful implementation of measures. However, there is a con-siderable lack of data for model parameterization with respect to short-term vegetation changes and long-term effects on soil properties.
5 Outlook
The article briefly overviews the current state of our ongo-ing project work. It is quite clear that there are many uncer-tainties in the models and their parameterization. A viable approach to point out the weaknesses of single model ap-proaches is the use of different models and the combination of the results. Our focus is not the best fit of a runoff hydro-graph on a measured discharge. We try to model the process as plausible as possible on the plot and transfer this knowl-edge to the next scale of smaller landscapes.
Accordingly, the future challenges are:
– to develop model tools to describe changes in soil prop-erties as a result of a changed land-use;
– to implement new or existing approaches for hydropho-bicity, surface roughness, and upsilting;
– to assess the impact of measures considering the im-provement of natural water retention to areas down-stream.
The main goal is to develop a rule type to find an optimized land-use in flood originating areas by qualifying and quanti-fying the potential effects of such land-use changes on wa-ter retention and related patwa-tern of runoff formation, notably with respect to mid- and long-term changes in the soils.
Edited by: K.-E. Lindenschmidt
56 A. Wahren et al.: Potential water retention caused by land-use changes References
Dittrich, I., M¨unch, A., Wahren, A., und Goldacker, S.: Hochwasserminderung und Wasserhaus-halts¨anderung durch Aufforstung und Waldumbau in den Einzugsgebieten des Os-terzgebirges; S¨achsische Landestalsperrenverwaltung, Pirna, Dr. Dittrich & Partner Hydro-Consult GmbH Bannewitz, 2004. Dittrich, I., M¨unch, A., Kessler, K., und Goldacker, S.:
Walddy-namik und ihre Wirkung auf Hochwasser und Wasserhaushalt, S¨achsische Landesanstalt f¨ur Landwirtschaft, Dresden, Dr. Ditt-rich & Partner Hydro-Consult GmbH Bannewitz, 2006. Federer, C. A.: BROOK90 – A Simulation Model for Evaporation,
Soil Water, and Streamflow, Handbook and Model, 2003. Golf, W. und Luckner K.: AKWA – ein Modell zur
Berech-nung aktueller Wasserhaushaltsbilanzen kleiner Einzugsgebiete im Erzgebirge, Acta Hydrophysica, 32, 5–20, 1991.
Golf, W., Luckner, K., und M¨unch, A.: Berechnung der Waldver-dunstung im Wasserhaushaltsmodell AKWA, Meteorologische Zeitschrift, 2, 99–107, 1993.
Merta, M., Seidler, C., und Hammer, H.: Hochwasser und Naturschutz im Weißeritzkreis – Ein Expertensystem als Entscheidungshilfe f¨ur das Fl¨achenmanagement in Einzugsge-bieten, Vortrag Workshop EMTAL, Einzugsgebietsmanagement von Talsperren in Mittelgebirgen, 2005.
M¨unch, A.: Wasserhaushaltsberechnungen f¨ur Mittelgebirg-seinzugsgebiete unter Ber¨ucksichtigung einer sich ¨andernden Landnutzung, PhD dissertation, TU Dresden, Fak. f. Forst-, Geo-u. Hydrowissenschaften, 1994.
M¨unch, A.: AKWA-M – Teilfl¨achen basiertes Wasserhaushalts-und Hochwassermodell, Dr. Dittrich & Partner Hydro-Consult GmbH Bannewitz, 2004.
Naef, F., Scherrer, S., Thoma, C., Weiler, W., und Fackel, P.: Die Beurteilung von Einzugsgebieten und ihrer Teilfl¨achen nach der Abflussbereitschaft unter Ber¨ucksichtigung der land-wirtschaftlichen Nutzung – aufgezeigt an drei Einzugsgebieten in Rheinland-Pfalz, Im Auftrag des Landesamt f¨ur Wasser-wirtschaft Rheinland-Pfalz, Bericht Nr. B003, 186 S., 2000. S¨achsisches Landesamt f¨ur Umwelt und Geologie – LfUG:
ColorIn-fraRot (CIR)-Biotoptypen- und Landnutzungskartierung, LfUG Abteilung 4 (Natur, Landschaft, Boden), Zeitbezug 1992/1993, 2006.
S¨achsisches Wassergesetz (S¨achsWG): dating 18 October 2004, S¨achsGVBl.
Schmidt, P. A., Hempel, W., Denner, M., D¨oring, N., Gn¨uchtel, A., Walter, B., und Wendel, D.: Potentielle Nat¨urliche Vegetation Sachsens mit Karte 1:200.000, Materialien zu Naturschutz und Landschaftspflege, Hrsg. S¨achsisches Landesamt f¨ur Umwelt und Geologie, 2003.
Wahren, A., Schw¨arzel, K., Feger, K. H., Dittrich, I., und M¨unch, A.: M¨oglichkeiten und Grenzen forstwirtschaftlicher Maß-nahmen im Rahmen des vorbeugenden Hochwasserschutzes, Tagungsband NNA Seminar 50/05: Hochwasserschutz unter neuen Vorzeichen – Das neue Hochwasserschutzgesetz, Alfred Toepfer Akademie f¨ur Naturschutz, Schneverdingen, 2005. Wahren, A., Schw¨arzel, K., Feger, K. H., Dittrich, I., und
M¨unch, A.: Analyse, Bewertung und Um-setzung von Maß-nahmen das pr¨aventiven Hochwasserschutzes in der Mittelge-birgsregion Jeseniky (Altvater-Gebirge, Tschechische Republik), Umweltkooperationen in der erweiterten Europ¨aischen Union, 11. Internationale Sommerakademie der DBU, Initiativen zum Umweltschutz Bd. 66, Erich Schmidt Verlag, Berlin, 224–234, 2006.

![Fig. 4. Water content [mm] in the soil storage for different land-use (timestep 1 d).](https://thumb-eu.123doks.com/thumbv2/123doknet/14761173.585228/5.892.76.426.94.317/fig-water-content-soil-storage-different-land-timestep.webp)
![Fig. 6. Runoff (Q) hydrographs [m 3 /s] gauging station Z¨oblitz.](https://thumb-eu.123doks.com/thumbv2/123doknet/14761173.585228/6.892.162.730.494.844/fig-runoff-q-hydrographs-gauging-station-z-oblitz.webp)
![Fig. 7. Difference of flood effective rainfall [%] parameterization (b) – (a) for two rainfall events](https://thumb-eu.123doks.com/thumbv2/123doknet/14761173.585228/7.892.143.759.96.688/fig-difference-flood-effective-rainfall-parameterization-rainfall-events.webp)

