HAL Id: hal-00316989
https://hal.archives-ouvertes.fr/hal-00316989
Submitted on 1 Jan 2002
HAL is a multi-disciplinary open access
archive for the deposit and dissemination of
sci-entific research documents, whether they are
pub-lished or not. The documents may come from
teaching and research institutions in France or
abroad, or from public or private research centers.
L’archive ouverte pluridisciplinaire HAL, est
destinée au dépôt et à la diffusion de documents
scientifiques de niveau recherche, publiés ou non,
émanant des établissements d’enseignement et de
recherche français ou étrangers, des laboratoires
publics ou privés.
Measurements and estimation of the columnar optical
depth of tropospheric aerosols in the UV spectral region
V. E. Cachorro, R. Vergaz, M. J. Martin, A. M. de Frutos, J. M. Vilaplana, B.
de la Morena
To cite this version:
V. E. Cachorro, R. Vergaz, M. J. Martin, A. M. de Frutos, J. M. Vilaplana, et al.. Measurements and
estimation of the columnar optical depth of tropospheric aerosols in the UV spectral region. Annales
Geophysicae, European Geosciences Union, 2002, 20 (4), pp.565-574. �hal-00316989�
Annales Geophysicae (2002) 20: 565–574 c European Geophysical Society 2002
Annales
Geophysicae
Measurements and estimation of the columnar optical depth of
tropospheric aerosols in the UV spectral region
V. E. Cachorro1, R. Vergaz1, M. J. Martin1, A. M. de Frutos1, J. M. Vilaplana2, and B. de la Morena2
1Grupo de Optica Atmosf´erica-Universidad de Valladolid (GOA-UVA), Depto. de Optica y Fisica Aplicada, Depto de Fisica
Aplicada I, Valladolid, Spain
2Estaci´on de Sondeos Atmosf´ericos ESAT “El Arenosillo”, INTA, Huelva, Spain
Received: 14 June 2001 – Revised: 15 October 2001 – Accepted: 30 October 2001
Abstract. We report values of the columnar tropospheric
aerosol optical depth at UV wavelengths based on experi-mental measurements of the direct spectral irradiances car-ried out by a commercial spectroradiometer (Li1800 of Licor company) covering the range from 300–1100 nm at two sta-tions with different climate characteristics in Spain. The first station is located in a rural site in north central Spain with continental climate. The data extend from March to the end of October of 1995. The other station is a coastal site in the Gulf of C´adiz (southwest Spain) of maritime climate type. This study is mainly focused on the capability of estimating aerosol optical depth values in the UV region based on the extracted information in the visible and near infrared ranges. A first method has been used based on the ˚Angstr¨om turbid-ity parameters. However, since this method requires detailed spectral information, a second method has also been used, based on the correlation between wavelengths. A correla-tion has been established between the experimental aerosol optical depth values at 350 nm and 500 nm wavelengths. Al-though the type of aerosol seems to be the key factor that determines the quality of these estimations, the evaluation of the associated error is necessary to know the behavior of these estimations in each area of study.
Key words. Atmospheric composition and structure
(aero-sols and particles; transmission and scattering of radiation; troposphere – composition and chemistry)
1 Introduction
There has been an increasing concern over stratospheric ozone depletion and the concomitant increase in solar UV-B radiation during the past few years (Bais et al., 1993; UNEP, 1998). However, the influence of atmospheric aerosols in the UV irradiances is also an increasing concern and is stud-ied more in depth. Until now there have been few reports
Correspondence to: V. E. Cachorro
(chiqui@baraja.opt.cie.uva.es)
of measurements of aerosol optical depth (hereafter AOD) and aerosol properties at UV wavelengths (Marenco et al., 1997; Krzyscin and Sylwester, 1998; Kylling et al., 1998; Erlick and Frederick, 1998) and much of the information has been extrapolated from the behaviour in the visible and near infrared regions by means of aerosol models and measure-ments (Mayer et al., 1997). In recent years we have found more measurements (Meleti and Cappellani, 2000; Reuder and Schwander, 2000; Groebner et al., 2001; Cachorro et al., 2001) and many works about this subject, also considering satellite data (Torres et al., 1998; Veefkind and De Leeuw, 1998; Krotkov et al., 2000; Torres et al., 2000). In this paper, a major focus on the total columnar atmospheric aerosol op-tical depth (tropospheric aerosols) and their characteristics at UV wavelengths has been carried out in order to assess their contribution to UV irradiances.
Due to the great spatial and temporal variability of atmo-spheric aerosol, and their importance in the Earth’s radia-tion budget and health effects, their monitoring is an essen-tial task for climate and environmental studies (NRC, Na-cional Research Council, 1996; Charlson and Heintzberger, 1995; WMO 659 Report, 1993). Measurements of the spec-tral AOD is one of the main procedures to derive microphys-ical (effective radius, volume, etc.) and radiative columnar characteristics (simple scattering albedo, asymmetry factor, etc.) of atmospheric aerosols (Cachorro et al., 2000a, b).
The AOD at ground level is currently measured at visi-ble and infrared wavelengths by means of commercial pho-tometers (Holben et al., 1998), radiometers (Harrison et al., 1994; Fuenzalida, 1998), spectroradiometers (Ahern et al., 1991; Vasilyev et al., 1995; Cachorro et al., 1989, 2000a), or different scientific prototypes (Marenco et al., 1997; Russel et al., 1996). The currently available photometers make the measurements at isolated wavelengths by means of a filter with a spectral width of 5 to 20 nm, depending on the instru-ment. The number and position of the chosen wavelengths is also very different, but 340 nm, 350 nm and 380 nm can be used as representative of this spectral region due to the non-absorption by ozone. The AOD at 350 nm can be considered
566 V.-E. Cachorro et al.: Measurements and estimation of the columnar optical depth as representative of the UV region in the same manner as 500
or 550 nm is taken as the reference wavelength in the visible. The determination of the AOD for wavelengths lower than 350 nm is linked with the ozone content determination (Bais et al, 1996; Slusser et al., 1999) and hence the methodology is being developed (Groebner et al., 2001). Therefore, this type of measurements is infrequent (Vergaz et al. 2001).
A major effort has already been devoted to the measure-ments of UV-B (Gardiner et al., 1993, 1995; Bais et al., 1996) and its modeling (Wang et al., 1994; Mayer et al., 1997; Ren et al., 1999; Diaz et al., 2000) and now the focus is on the aerosol contribution, which seems to play a significant factor once the ozone content determination methodologies are well established. Therefore, the importance of the AOD at the UV wavelengths is clearly manifested in the field of the UV stud-ies and their applications (Madronic, 1987; Ruggaber, et al., 1994; Cotte, et al., 1997; van Weele, 1996).
Here, in the paper we report values of the AOD at 350 nm as representative of the UV region, based on solar direct spectral irradiance measurements performed by a spectro-radiometer (covering the range 300–1100 nm) at two sites in Spain of different climate conditions and over different periods. However, the main aim in this study is how the measurements and modelling of the AOD at visible and how the near-infrared ranges can be analysed to extract informa-tion at these ranges in order to gain available informainforma-tion at the UV region. What are the uncertainties associated with these procedures and estimations? Note that the most fre-quent data about aerosol are usually collected in the visi-ble and near-infrared regions. The study is mainly based on the behaviour of the ˚Angstr¨om turbidity parameters in dif-ferent spectral regions and their capacity to model the AOD at other wavelength ranges; in this case, how well can the visible-infrared range values predict the values in the UV. However, this method requires a lot of spectral information, which is not always available. Therefore, we have also used another current method based on the existing correlation be-tween wavelengths (or channels). We have determined in both areas of study the correlation between the AOD at 350 and 500 nm wavelengths and hence the estimated error given by these two approaches.
We must note that our spectroradiometer data have a rich spectral information due to high-moderate spectral resolution and hence are ideal to be used with the first method. Current Sun-photometers do not provided this detailed spectral infor-mation.
2 Experimental data
Spectral direct normal irradiance measurements for clear skies were performed with the commercial Li1800 portable spectroradiometer at two Spanish stations. The north-central station (41.5◦N, 4.7◦W; 610 m. above sea level) is a ru-ral site 25 km from the city of Valladolid in the region of “Castilla y Le´on” of continental climate type. The measure-ment period extends from March to November of 1995, with
about 300 spectra on 78 clear sky days. The southwest sta-tion “El Arenosillo”, belonging to the INTA (Instituto Na-cional de T´ecnica Aeroespacial) is located in the coastal site of the Gulf of C´adiz in Huelva (37.1◦N, 6.7◦W; sea level), and catalogued as number 213 in the ozone WMO network. This area is of special interest due to the influence of mar-itime aerosols, African desert dust events and local industrial environment (10 km from an important polluted-industrial area). The measured period extends from August of 1996 to October of 1997, with more than 407 spectra over 80 clear sky days. This latter station also provided ozone content determination by means of a Dobson instrument for more than 20 years (Morena de la, et al., 1994). Furthermore, a Brewer #150 UV-spectroradiometer has also been operating since 1997.
Details about the instrument characteristics and calibra-tion of our Li-1800 spectroradiometer have been described elsewhere (LiCor Manual, 1991; Cachorro et al., 1998) but it is described here briefly. The spectroradiometer is based on a single monochromator with a holographic grating of 800 grooves/mm and a focal length of 150 mm and the detec-tor is a silicon photodiode. The collected radiant power must first pass through a filter wheel (composed of 8 filters) be-fore it enters the monochromator. One of the filters serves as dark reference. For the direct component of solar radiation, a collimator tube was designed with an IFOV (instantaneous field-of-view) of 4.3◦and was coupled to the Teflon diffuser receptor cosine (IFOV=2π sr) of the spectroradiometer. The receptor cosine is mounted at one end of a fiber-optic light-guide and the other end is connected to the entrance slit of the monochromator. We have determined the cosine er-ror that is about 5% for angles < 75◦, but greater and
az-imuthal dependent for higher angles. The spectroradiometer covers the spectral range 300–1100 nm, with a nominal 6-nm spectral resolution given by the LiCor company, but the instrument function has been determined in our optic’s lab-oratory to have 6.24±0.27 nm FWHM (Full-Width-at-Half-Maximum). Each spectrum can be recorded with a variable step but 1 nm was used in our measurements.
The spectroradiometer was calibrated periodically (about six months) with the lamp system calibrator provided by the Licor company following the NIST (National Institute of Standard Technology) standard methodology. The sys-tem did not have automatic tracking; therefore, the direct irradiance spectra are measured manually (each spectrum is recorded in 30 s). Between three and seven spectra were mea-sured per day from 10:00. to 17:00 LT but without systematic schedule time protocol.
We have evaluated the error associated with the irradiance measurements of our instrument at about 5% in the 360– 1000 nm spectral range (Cachorro et al., 1998). Obviously, this error depends on the wavelength range. A detailed anal-ysis of error measurements with the Li1800 spectroradiome-ter can be seen in Myers (1989). The error due to calibra-tion is fixed at 3% and the added 2% is due to the other elements, such as: collimator, pointing system, etc. Error calibration of our spectroradiometer is good above 360 nm,
V.-E. Cachorro et al.: Measurements and estimation of the columnar optical depth 567 but at lower wavelengths, the error increases. This
behav-ior has recently been tested, by comparing the calibration features and field measurements given by our Li1800 spec-troradiometer and the Brewer #150 instrument. This study has been carried out as part of a recent intercomparison of various spectroradiometer systems belonging to different re-search groups in Spain and Portugal, the “First Iberian Inter-comparison Campaign” (Sanchez-Muniosguren et al., 2002; Groebner et al., 2001) during the first days of September 1999 in “El Arenosillo”-Huelva station.
This campaign has permitted one to compare the spec-tral features and stability, and to fix the irradiance error in the UV region of our spectroradiometer in relation to the Brewer instruments. The latter instruments were calibrated in the laboratory according to NIST standard and the require-ments given by the Brewer network and also with respect to the Brewer Reference Travelling Standard #17 operated by the International Ozone Services (IOS). The relative dif-ferences for the same reference irradiance lamp (1000 W) in the laboratory between our Li1800 and the Brewer #150 has a mean that varies from −10% to 10% from 300 nm to 320 nm, falling to 3% at 330 nm and maintaining this value to 360 nm. The corresponding standard deviation of this mean has the values ±20% from 300 to 320 nm, decreasing to 10% at 330 nm and 3% at 360 nm. Therefore, measurements be-low 320 nm for our spectroradiometer are not considered.
These differences were also verified with the field experi-mental measurements of more than six days (more than 300 spectra) during the “Intercomparison Campaign”. The ratio of experimental measurements between the Licor1800 and Brewer #150 gives values between 0.8 to 1.2 in the spectral range 320–360 nm, with a mean spectrum that did not ex-ceed 7% from 1 (4% at 350 nm). Furthermore, during this campaign, two other Li1800 instruments were also used be-longing to the Universities of Valencia and Barcelona. The analyzed relative RMS (root mean square) differences for the visible wavelengths comparing field measurements were es-tablished in about 5% for the calibration at the origin then falling to 3% after the in situ calibration (Martinez-Lozano et al., 2002). Thus, the values for the differences are the same as the assigned error of measurements of our Li1800 spectroradiometer.
3 Methodology
3.1 Determination of the aerosol optical depth and the ˚
Angstr¨om parameters
We describe briefly the method we have followed to de-termine the AOD and the ˚Angstr´om turbidity parameters (Vergaz, 1996; Cachorro et al., 2000a). We determine the total experimental spectral optical depth of the atmosphere τ (λ)from our absolute direct solar irradiance (W m−2nm−1) measured at ground level F(λ) using the Beer-Lambert law, according to
F(λ) = Fo(λ)exp(−τ (λ)m), (1)
where Fo(λ) is the well-known irradiance at the top of the atmosphere corrected for the Sun-Earth distance and m is the air mass computed by means of the solar zenith an-gle SZA(m=1/cos(SZA)). The contribution due to Rayleigh scattering according to Bucholtz, (1995) is removed from the total atmospheric optical depth (τR(λ)is scaled by the
term P/Po, where P is the pressure P at the station site and
Po=1 atm, the standard pressure at sea level) and with the
ab-sorption of atmospheric gases τg(λ) in the spectral range of
interest we can determine the experimental spectral AOD τa(λ) = τ (λ) − τR(λ) − τg(λ). (2)
This means that the columnar content of ozone, water va-por, etc. are required in the spectral region of interest. These ancillary data can be obtained from Dobson ozone measure-ments, radiosonde, satellite data, etc. In most common situ-ations the above needed data are not available exactly at the same spatial and temporal resolution required for the mea-sured irradiance data; therefore, another approach must be taken for using these ancillary data. As we show later, spec-troradiometer data with sufficient spectral resolution allows one to use approaches to obtain the AOD without available data of absorption gas content.
In the spectral range of our measurements (300–1100 nm) the absorption of ozone, water vapor, oxygen, NO2and SO2
must be considered, but NO2, SO2and water vapor could be
neglected in the spectral range 350–700 nm considering their lower absorption and the error associated with our irradiance measurements (5%). Therefore, only ozone data must be ac-counted for in the Chappuis band. In the near-infrared range we have considered only the wavelengths where there is no absorption, as we explain below.
When we have the experimental AOD in a given spectral range, a weighted fit of ln(τa) versus the ln(λ), according to
the well known ˚Angstr¨om formula τa(λ)=β(λ/λ0)−α,
deter-mines the two ˚Angstr¨om turbidity parameters α and β. The α parameter characterizes the spectral features of aerosols and is related to the size distribution of the particles, while the β parameter is related to particle concentration and represents the aerosol optical depth at a wavelength of 1 µm (being λ0
equal to 1 µm).
To carry out our analysis of the estimation of the AOD at a given UV wavelength based on the spectral information in the visible and near-infrared range given by the ˚Angstr¨om turbidity parameters, we have obtained two independent sets of these parameters. One set is obtained from the AOD spec-tral information in the visible range, from 400 to 670 nm (called VIS range). The other set of the α − β parameters is obtained from the spectral information, taking several spec-tral regions as a whole, in the UV, visible and near-infrared ranges, labelled by us “window range” or “window method”. This “window range” is defined by four spectral windows of non-absorption, given by A(370–490 nm), B(748–757 nm), C(776–782 nm), and D(862–872 nm). Note that with these four windows we can model the AOD at practically the whole spectral range (e.g. 340–1000 nm). Obviously, this fitting
568 V.-E. Cachorro et al.: Measurements and estimation of the columnar optical depth would be better depending on the spectral features of aerosol
in the whole spectral range.
These four windows were taken to determine the ˚
Angstr¨om parameters with the database of Valladolid be-cause data of ozone and water vapor contents are not avail-able (ozone satellite data are not availavail-able during 1995). Note that in this case, one can obtain the ozone content in a second step, by a minimization-fitting technique between experimental-modelled total optical depth (without Rayleigh contribution) at the Chappuis absorption band because the aerosol optical depth is already known. This procedure was used by us to obtain the ozone content (Cachorro et al., 1996) and water vapor content (Cachorro et al., 1998), during the whole period of 1995 in the Valladolid station. This is a well-known method when we have data of the AOD at wave-lengths or spectral window of non-absorption. The spectral range and resolution of our spectroradiometer are ideal to ob-tain these data and to apply this method.
Once the ozone content is determined by the “window method”, we can obtain the experimental AOD at the range 400–700 nm (VIS range) and the ˚Angstr¨om parameters. However, note that in the first step, we have obtained the
˚
Angstr¨om parameters without including the Chappuis band (“window method”) and in the second step, this band is in-cluded (VIS range). The reason to take the spectral range 400–670 nm (VIS) was based on the good fits shown by this range, as we have analysed in Vergaz (1996) and Martinez-Lozano et al. (1998).
The database at the “El Arenosillo”-Huelva station has different characteristics. As we already mentioned, Dob-son ozone data were measured and hence the VIS range can be used immediately to determine the ˚Angstr¨om parame-ters. However, the “window method” was applied without using the last window D due to the observed spectral fea-tures of these data, where a more pronounced curvature ap-pears at 780 nm (Vergaz, 2001). A first evaluation with the four windows demonstrated poor fits; hence, we decided to take only three windows to determine the ˚Angstr¨om parame-ters in the southwest station. The reason for this curvature at near-infrared spectral region is linked to the maritime aerosol characteristics, as we have observed recently (Vergaz, 2001). 3.2 The errors on the AOD determination
The error on the retrieval of the experimental AOD, τa, is
given by the error of total optical depth τ , and Rayleigh er-ror. The error of τ is given by the irradiance measurements, extraterrestrial irradiance, the air mass m and the modeling of the other optical depths, including absorption coefficients and absorbing content values. In the smooth, non-absorption spectral regions, the error of τ has been estimated assum-ing that the error is mainly due to irradiance measurements F (the other factors can be neglected). As can be seen by the propagation error theory, the relative error of τ is given by ε(τ ) = ε(F)/τ m. Assuming that we have about 5% of er-ror for the irradiance F, the ranges of our measured air mass (1–3) and the values of the total optical depth, we have
eval-22
Figure 1
50 100 150 200 250 300 0,0 0,2 0,4 0,6 0,8 1,0 1,2 (a) Valladolid (1995) Julian day AOD (350 nm) 200 300 400 500 600 700 0,0 0,1 0,2 0,3 0,4 0,5 0,6 0,7 0,8 0,9 b) "El Arenosillo"-Huelva (96-97) Julian Day AOD (350 nm)Fig. 1. Temporal evolution of the experimental AOD at 350 nm for the a data of the north central station of Valladolid and b southwest coastal station of “El Arenosillo”-Huelva.
uated the relative errors at 500 nm and 350 nm wavelengths, respectively. The errors at 500 nm range from ±4% to ±20% and those of 350 nm yield ±1% to ±12%. (bear in mind the 10% of error for the irradiance at 350 nm, where 7% is due to calibration). Greater error of irradiance is compensated by the high value of the optical depth at the UV wavelengths. We must also note that error propagation theory gives lower errors for high air masses, which generally correspond to lower values of irradiance associated with greater uncertain-ties.
Finally, to evaluate the error of the AOD, we have evalu-ated the contribution of Rayleigh error. To do this we have taken two expressions for the evaluation of the Rayleigh scat-tering attenuation: those given by Bucholtz (1995) and Guey-mard (1995). The two sets of the experimental AOD are slightly different and we have evaluated the relative differ-ences between them. They show a range of variation from 0.05% to 8% for the 500 nm wavelength and 0.05% to 4.5% for the 350 nm. Therefore, we have considered these dif-ferences as an estimated error due to Rayleigh contribution.
V.-E. Cachorro et al.: Measurements and estimation of the columnar optical depth 569 Adding these values to the earlier relative error of τ , we
ob-tain the total relative error for the AOD. Therefore, the rela-tive error of the AOD at 500 nm yields values about ±4–28% and lower for 350 nm (±1–17%). This results in a high es-timated error for the AOD, in part given by the error propa-gation theory. However, we have verified by comparison of AOD data of our Li1800 spectroradiometer with five Brewer spectroradiometers that this evaluated error seems to be over-estimated (Groebner et al., 2001).
The error of the ˚Angstr¨om turbidity parameters α − β is given by the weighted least-square fit by considering the pre-viously determined error of the AOD. The relative error of αranges from ±2–16% for the data in the VIS range and “window range”.
4 Results and discussion
4.1 Estimated AOD by ˚Angstr¨om turbidity parameters First, we report the experimental data of the AOD at 350 nm (taken as representative wavelength in the UV region) for our station of north central Spain (Valladolid) of continental cli-mate in Fig. 1a. The values are shown as a function of the Julian day and range from 0.1 to near 1.2 with a mean value of 0.39 and RMS=0.16. These values are higher than the current values found in the visible (we will analyse later the correlation between the experimental AOD at 350 nm versus the AOD at 500 nm). The AOD values given by the database (96–97) of “El Arenosillo”-Huelva station are depicted in Fig. 1b. In this figure, Julian days 212–365 correspond to 1996 and 366–700 (1–178) to 1997. A lack of data is due to cloud days and also to calibration and maintenance of the instrument. The AOD values range from 0.1 to 0.8 with a mean value of 0.24 and RMS=0.11. As can be seen, these values are lower than those measured in the north station of Valladolid, 600 m above sea level.
The relative differences between the estimated values of the AOD at 350 nm, given by the VIS range and “window range” fits, and the experimental ones are depicted in Fig. 2 for the data of the two stations. The differences for the data of Valladolid (Fig. 2a) varies from −10% to 10% for the “win-dow range” (mean=2% and RMS=4%) and from 5% up to values as high as 45% (mean=20% and RMS=8%) for the VIS range. As can be seen, the values determined in the “window range” give a better estimate than those given by the VIS spectral range. This is due to the fact that the “win-dow range” takes the win“win-dow 370–490 giving a greater UV influence than the VIS range (400–670). Generally, the de-creasing tendency in our spectra with the wavelength is more accentuated for UV interval and also for larger spectral in-tervals, like the “window range”. We have not evaluated the results taking the spectral range 370–670 nm but other re-sults taking the interval 350–670 nm indicate this behaviour (these results are not shown here). The “window range” re-gion gives an excellent estimate of the AOD at 350 nm, with their relative differences falling inside the error associated
23
Figure 2
50 100 150 200 250 300 -0.2 -0.1 0.0 0.1 0.2 0.3 0.4 0.5 a) Valladolid(1995)relative differences AOD (350 nm)
Julian Day Exp-Modeled (Fit VIS) Exp-Modeled (Fit 4-windows)
200 300 400 500 600 700 -0,1 0,0 0,1 0,2 0,3 0,4 0,5 0,6 0,7 0,8 0,9 1,0 b) "El Arenosillo-Huelva(96-97)
relative differences AOD (350 nm)
Julian Day
Exp-modeled (Fit VIS) Exp-Modeled (Fit 3-windows)
Fig. 2. Relative differences between the experimental AOD at 350 nm and the AOD values retrieved from the values of the α − β parameters determined by the fits in the regions: a VIS (400–700) and b UV-VIS-NIR (“window range”).
with the experimental AOD. The α − β determined in the VIS range always underestimates the AOD at UV region, but with a reasonable estimate.
Figure 2b illustrates the relative differences evaluated for the data of “El Arenosillo”-Huelva station. The relative dif-ferences for the VIS range and “window range” show a sim-ilar behaviour with underestimated values from 0% to 80% (mean=34% and RMS=16%), which are considerably greater than those of Valladolid station. A first analysis of these re-sults seems to indicate that in the case of the southwest sta-tion, the VIS and “window” spectral ranges are not recom-mended to be used to predict the data at UV region based on the ˚Angstr¨om turbidity parameters. In addition, we must note that for this station the VIS range and “window range” are practically the same due to the removing of the last window, which emphasizes more these results compared with those obtained for the Valladolid station. These results are based on the analysis of the bulk data, assuming that the prevailing continental type of aerosol is in the area of Valladolid and
570 V.-E. Cachorro et al.: Measurements and estimation of the columnar optical depth24
Figure 3
-0,5 0,0 0,5 1,0 1,5 2,0 2,5 3,0 -0,5 0,0 0,5 1,0 1,5 2,0 2,5 3,0 a) Valladolid (1995) alpha (VIS) alpha (4-windows) -2 -1 0 1 2 -2 -1 0 1 2b) "El Arenosillo" (Huelva)
alpha(VIS)
alpha (3-windows)
Fig. 3. Plots of the α parameter determined in the VIS range versus the values determined in the “window range” for a data of the north central station of Valladolid and b southwest coastal station of “El Arenosillo”-Huelva.
the maritime is in the area of the south coastal station of “El Arenosillo”-Huelva. Obviously these results require a more detailed analysis, related with the mixing of aerosol types, seasonal behaviour, etc., but this is really another work, and is not within the aims of this paper.
In order to find one explanation for the different behaviour between the data of Valladolid and “El Arenosillo”-Huelva, we have also investigated the correlation between the α pa-rameter in the different analyzed spectral ranges. In Fig. 3,
25
Figura 4
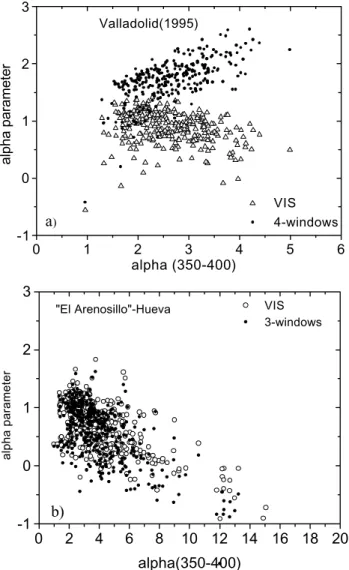
0 2 4 6 8 10 12 14 16 18 20 -1 0 1 2 3 alpha(350-400) alpha parameter"El Arenosillo"-Hueva VIS 3-windows 0 1 2 3 4 5 6 -1 0 1 2 3 Valladolid(1995) alpha parameter alpha (350-400) VIS 4-windows
a
)b)
Fig. 4. Plot of the α parameter determined in the VIS and “window range” range versus the values determined in the (350–400 nm) UV range” a for the data of the north central station of Valladolid; b for the data of the southwest station of “El Arenosillo”-Huelva.
we have illustrated the α values given by the fits in the VIS (400–670 nm) range versus those of “window range”.
In Fig. 3a, we observe a non-existing correlation between the α VIS values versus those obtained with the “window method” for the data of Valladolid, while Fig. 3b shows a good correlation for the data of “El Arenosillo”-Huelva. Ob-viously the latter values are very similar, due to the similar-ity of their spectral ranges because of the already mentioned problem of the bad fitting when taking four windows; there-fore, these results are not comparable. In our opinion, the larger α values given by the “window range” compared with those of the VIS range in Valladolid are representative of the spectral behavior of pure continental aerosol, with AOD de-creasing from UV to near infrared. The shorter interval taken for VIS range gives lower values for the α parameter.
To extend this analysis we have also determined the α pa-rameter values obtained in the (350–400 nm) spectral range, which we can call α-UV. Obviously a better correlation
be-V.-E. Cachorro et al.: Measurements and estimation of the columnar optical depth 571 tween the α parameter in the UV range and the other ranges
determines a better estimate of the AOD at 350 nm. In Fig. 4, we have plotted the α values obtained in the VIS and “window range” versus those of α determined in the UV range (350–3400 nm) for the data of Valladolid (4a) and “El Arenosillo”-Huelva (4b) station. Although a good correla-tion does not seem to exist when observing the corresponding plots, the data of Valladolid show a slightly better correlation. As can be seen, only the correlation for data of Valladolid at the “window range” has a positive slope.
The more flat (lower slope and hence lower values of α) spectral behaviour of the AOD taking the “window range” for the data of “El Arenosillo”-Huelva station compared with the high slope for the data of Valladolid (higher α values) seems to be the main cause of the above results. Continental aerosol type shows a better correlation between the α parameter de-termined in the VIS and “window range” with UV range than maritime type. We must note that the high values of the α parameter in the UV region are due to the high slope in this short region. In this case, the meaning for the α parameter must be taken only as the slope of the AOD at this specific spectral range, and hence the limit of 4 given by Rayleigh scattering cannot be considered for this analysis.
The results are indicative of the difficulties of the extrapo-lation of information between different spectral ranges, even for the same type of aerosols (Vergaz, 2001), especially if we considered mixed aerosol types. As can be seen, the α val-ues are very dependent of the chosen spectral interval, as we have demonstrated in a recent paper (Cachorro et al., 2001b). We must call attention to the comparison of the α parameter taking different spectral ranges, due to its different spectral information.
The above results suggest that ˚Angstr¨om turbidity parame-ters determined in the “window range” can be used to predict the AOD at 350 nm UV wavelength in the north central sta-tion, while VIS data gives a great underestimation. The data of “El Arenosillo”-Huelva seem to be more complicated and inadequate for estimating ultraviolet AOD regardless of the spectral range we choose. Therefore, this study reveals the difficulty in these kinds of estimations that are linked to the aerosol type or measurements site. This method requires a lot of spectral information; hence, we have also analysed an alternative and simple method based on the existing correla-tion between wavelengths.
4.2 Study of correlations
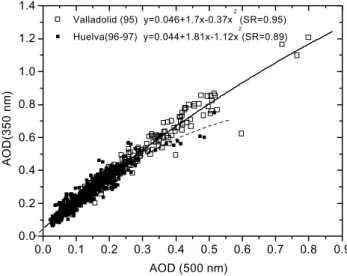
In Fig. 5, we have plotted the experimental AOD at 350 nm versus that at 500 nm. Open square points are the data of Valladolid which give a polynomial fit correlation with the square of correlation coefficient SR=0.95 (solid line). In this figure, we have also added the data (solid square points) at the southwest station of “El Arenosillo”-Huelva with the cor-responding fit (dashed line) and SR=0.89. The confidence of these fits to predict the AOD at 350 nm can be analysed by Fig. 6 (top for the data of Valladolid and bottom for the data of “El Arensillo”-Huelva). 26
Figure 5
0.0 0.1 0.2 0.3 0.4 0.5 0.6 0.7 0.8 0.9 0.0 0.2 0.4 0.6 0.8 1.0 1.2 1.4 AOD (500 nm) AOD(350 nm) Valladolid (95) y=0.046+1.7x-0.37x 2 (SR=0.95) Huelva(96-97) y=0.044+1.81x-1.12x 2 (SR=0.89)Fig. 5. Plot of the AOD at 350 nm versus the AOD at 500 nm for the data of the north central station of Valladolid (open square points) and those of the southwest station of “El Arenosillo”- Huelva (solid squares). Each set of data has been fitted by a polynomial expres-sion (in parenthesis the square of the correlation coefficient).
The relative differences between the experimental and es-timated AOD values are about ±20% but some cases appear with an underestimation below 30%. This can be seen in Fig. 6a for the data of Valladolid where we have depicted these differences as a function of the AOD values at 350 nm. As can be observed the associated error given by this esti-mate is well distributed around the zero value for the whole AOD data set (mean=0% and RMS=16%). The predicted values given by the polynomial fits are not as good as those given by the α −β values determined by the earlier procedure in the “window range” in the case of the data of Valladolid, but slightly better when taking the results given by the VIS range.
In Fig. 6b, we repeated the same evaluation but for the data of “El Arenosillo”-Huelva. This figure shows that the esti-mate is around ±40% (mean=−2% and RMS=16%), with lower uncertainty for high AOD values (also various cases appear which are underestimated by about 40–60%). The er-ror of these estimations is double those obtained for the data of Valladolid station. The polynomial correlation predicts the AOD at 350 nm with lower uncertainty than the values given by the α − β turbidity parameters of VIS or “window range” fits. However, most important is that the polynomial estimate is well distributed around the zero value, while the ˚Angstr¨om turbidity parameters always results in an understimation or overestimation.
It seems that a linear or polynomial correlation can work as well as the method based on the ˚Angstr¨om turbidity pa-rameters, depending on the prevalent type of aerosol in each area of study. Taking into account that the latter procedure requires information of a great number of wavelengths, the procedure of correlation appears as an alternative and ade-quate method to predict AOD at UV from the visible data.
572 V.-E. Cachorro et al.: Measurements and estimation of the columnar optical depth 27
Figure 6
0,0 0,2 0,4 0,6 0,8 1,0 1,2 -0,6 -0,4 -0,2 0,0 0,2 a)relative differences AOD(350)
AOD (350)
Exp-modeled (Correlation Fit) Valladolid (1995) 0,0 0,2 0,4 0,6 0,8 -0,8 -0,6 -0,4 -0,2 0,0 0,2 0,4 0,6 b) Exp-modeled(Correlation Fit) "El Arenosillo"-Huelva (96-97) AOD (350 nm)
relative differences AOD(350 nm)
Fig. 6. Relative differences between the experimental AOD at 350 nm and the AOD values retrieved from the polynomial expres-sion as a function of the experimental AOD values at 350 nm: (a) for the data of the north central station of Valladolid; (b) for the data of the southwest station of “El Arenosillo”-Huelva.
However, the error associated with these estimates is rela-tively very large. It is not at all surprising that this method works better that the ˚Angstr¨om turbidity parameters in the area of “El Arenosillo”-Huelva and in Valladolid for the VIS range because the extended range of information carried by the latter method must be the responsibility of this result.
5 Conclusions
Experimental data of direct solar irradiance has allowed us to report and analyse experimental data of the AOD at the UV region at two different sites in Spain, focusing this anal-ysis on the estimate of the AOD at 350 nm wavelength as representative of this region. The very good estimation of the AOD values at 350 nm based on the ˚Angstr¨om turbidity parameters determined in the “window range” for the data of the north central station of Valladolid is not repeated by the data of the Southwest station of “El Arenosillo”-Huelva.
This different spectral-range behaviour seems to be due to the different predominant type of aerosol in each area: con-tinental type in the north central station and maritime in the south coastal station. However, for the same type of aerosol the different spectral behaviour shown by different spectral ranges makes it difficult to establish the correlations between them. It seems that the continental type shows better correla-tion between its different spectral ranges (generally decreas-ing behaviour with the wavelength) than the maritime type.
We have determined good correlations between the ex-perimental AOD between 500 nm and 350 nm wavelengths which appear as an alternative and useful procedure to es-timate AOD at UV region when only available information is known in the visible. However, the error and limitations given by these procedures must be taken into account, as we demonstrated in this work
Future improvement must be carried out using these pro-cedures once each type of aerosol has been identified in the database. Obviously each area has its characteristic aerosol climatology, but this type of study must be carried out at dif-ferent locations, to know to what extent the above approaches and results can be used.
Acknowledgements. This work is supported by the CICYT, project
REN 2000-0903-C08-04. We thank to J. de Castilla y Le´on for sup-porting the grant of R. Vergaz. Also we thank W. B. Grant, NASA Langley Research Center, Hampton, Virginia, for his suggestions and help in editing the text.
Topical Editor J.-P. Duvel thanks G. Cautenet and another ref-eree for their help in evaluating this paper.
References
Ahern, F. J., Gautier, A. P., Teillet, P. M., Sirois, J., Fedosejevs, G., and Lorente, D.: An investigation of continental aerosols with high-spectral-resolution solar extinction measurements, Appl. Opt. 30, 5276–5287, 1991.
Bais, A. F., Zerefos, C. S., Meleti, C., Ziomas I. C., and Tourpali, K.: Spectral measurements of solar UV-B radiation and its rela-tion to total ozone, SO2and clouds, J. Geophys. Res. 98, 5199–
5204, 1993.
Bais, A. F., Zerefos, C. S., McElroy, C. T.: Solar UVB mea-surements with the double- and single-monochromator Brewer Ozone spectrometers, Geophys. Res. Lett. 23, 833–836, 1996. Bucholtz, A.: Rayleigh-scattering calculations for the terrestrial
at-mosphere , Appl. Opt. 34, 2765–2773, 1995.
Cachorro, V. E., Gonz´alez, M. J., de Frutos, A. M., and Casanova, J. L.: Fitting ˚Angstr¨om formula to spectrally resolved aerosol optical thickness, Atmos. Environ. 23, 265–270, 1989.
Cachorro, V. E., Dur´an, P., and de Frutos, A. M.: Retrieval of ver-tical ozone using the Chappuis band with high spectral resolu-tion solar radiaresolu-tion measurements, Geophys. Res. Lett. 23, 3325– 3328, 1996.
Cachorro, V. E., Utrillas, P., Vergaz, R., Dur´an, P., de Frutos, A. M., and Martinez-Lozano, J. A.: Determination of atmospheric water vap ˚Aor content in the 940 nm band using moderate spectral res-olution measurements of direct solar irradiance, Appl. Opt. 37, 4678–4689, 1998.
V.-E. Cachorro et al.: Measurements and estimation of the columnar optical depth 573 Cachorro, V. E., Dur´an, P., Vergaz, R., and de Frutos, A. M.:
Mea-surements of the atmospheric turbidty of the North-central conti-nental area in Spain: Spectral aerosol optical depth and turbidity parameters, J. Aerosol Sci. 31, 687–702, 2000a.
Cachorro, V. E., Dur´an, P., Vergaz, R., and de Frutos, A. M.: Ver-tical physical and radiative properties of atmospheric aerosols in north central Spain, J. Geophys. Res. 105, 7161–7175, 2000b. Cachorro, V. E., Dur´an, P., Vergaz, R., and de Frutos, A. M.:
Uncer-tainties in the estimated aerosol optical depth at UV region based on visible-near-infrared information. Geophysical Research Ab-stracts, Vol. 3, 26th General Assembly, ISSN: 1029–7006, 2001a. Cachorro, V. E., Vergaz, R., and de Frutos, A. M.: A quantitative comparison of alpha ˚Angstr¨om turbidity parameter retrieved in different spectral ranges based on spectroradiometer solar radia-tion measurements, Atmos. Environ., 35, 5117–5124, 2001b. Charlson, R. J. and Heintzberger, J. (Eds): Aerosol forcing of
cli-mate, John Wiley & Sons, Chichester, 1995.
Cotte, H., Devaux, C., and Carlier, P.: Transformation into spectral actinic flux for photolysis rates determination, J. Atmos. Chem. 26, 1–28, 1997.
Diaz, S., Deferrari, G., Martinioni, D, and Oberto, A.: Regres-sion analysis of biologically effective integrated irradiances ver-sus ozone, clouds and geometric factors, J. Atmos. Solar Terrest. Phys., 62, 629–638, 2000.
Dur´an, P.: “Medidas espectroradiom´etricas para la determinaci´on de componentes atmosf´ericos (ozono, vapor de agua y aerosoles) y modelizaci´on del intercambio radiativo en la atm´osfera, Ph.D. Dissertation, “Departamento de Ciencias Agroforestales”, Uni-versity of Valladolid, Spain, 1997.
Erlick C. and Frederick, J. E.: Effects of aerosols on the wavelength dependence of atmospheric transmission in the ultraviolet and visible 2, Continental and urban aerosols in clear skies, J. Geo-phys. Res., 103, 23 275–23 785, 1998.
Fuenzalida, H. A.: Global ultraviolet spectra derived directly from observations with multichannel radiometers, Appl. Opt. 37, 7912–7919, 1998.
Gardiner, B. G. and Kirsch, P. J.: Second European intercompar-ison of ultraviolet spectrometers, Panorama, Greece, Report to de Commission of the EU, contract STEP CT900076, Brussels, Belgium, 1993.
Gardiner, B. G. and Kirsch, P. J.: Setting standard for European ultraviolet spectroradiometers, Report to de Commission of the EU, contract STEP CT900076, Brussels, Belgium, 1995. Groebner, J., Vergaz, R., Cachorro, V. E., Redondas, A., Henriquez,
A., Lamb, K., Vilaplana, J. M., and Rembges, D.: Intercompar-ison of aerosol optical depth measurements in the UVB using Brewer spectrophometers and a Li-cor spectrophotometer, Geo-phys. Res. Lett., 28 (9), 1691–1694, 2001.
Gueymard, C.: SMARTS2, A simple model of the atmospheric radiative transfer of sunshine: Algorithm and performance as-sessment, Report FSEC-PF-270-95, Florida Solar Energy Cen-ter, 1995.
Harrison, L., Michalsky, J., and Berndt, J.: Automated multifilter shadow-band radiometer: an instrument for optical depth and ra-diation measurements, Appl. Opt., 33, 5118–5125, 1994. Holben, B. N., Eck, T. F., Slutsker, I., Tanr´e, D., Buis, J. P., Setzer,
J., Vermote, E., Reagan, J. A., and Kaufman, Y. A.: AERONET-A federated instrument network and data archive for aerosol characterization, Remote Sensing Environment, 66, 1–16, 1998. Krotkov, N., Eck, T., Bhartia, P. K., Herman, J. R., Torres, O., and Dubovik, O.: Radiative effects of biomass burning aerosols from ultraviolet to visible wavelengths: a combined
ground-based-satellite study, Abstract of the International Radiation Sympo-sium IRS 2000, Current Problems in Atmospheric Radiation, St. Peterburg, Russia, 2000.
Kylling, A., Bais, A. F., Blumthaler, M., Zerefos, C. S., and Kos-midis, E.: Effect of aerosols on solar UV irradiances during the Photochemical Activity and Solar Ultraviolet Radiation cam-paign, J. Geophys. Res., 103, 26 052–26 060, 1998.
Krzyscin, J. and Sylwester, P.: Aerosol impact on surface UV radia-tion from the ground-based measurements taken at Belsk, Poland 1980–1996, J. Geophys. Res., 103, 16 175–16 181, 1998. Licor Manual Radiation measurement instrument, Ed. Li-Cor
Com-pany, 1991.
NRC, Nacional Research Council: A plan for a research program on Aerosol Radiative Forcing and Climate Change, National Academy Press, Washington D. C., 1996.
Madronic, S.: Photodissociation in the atmosphere. Actinic flux and the effects of ground reflections and clouds, J. Geophys. Res., 92, 9740–9752, 1987.
Mayer, B., Seckmeyer, G., and Kylling, A.: Systematic long-term comparison of spectral UV measurements and UVSPEC model-ing results , J. Geophys. Res., 102, 8755–8767, 1997.
Marenco, F., Santacesaria, V., Bais, A. F. Balis, D., Di Sarra, A., Papayanis, A., and Zerefos, C. S.: Optical properties of tro-pospheric aerosols determined by lidar and spectrophotometric measurements, Photochemical Activity and Solar Ultraviolet Ra-diation Campaign, App. Opt., 36, 6875–6886, 1997.
Martinez-Lozano, J. A., Utrillas, M. P., Tena, R., and Cachorro, V. E.: The parametrization of the atmospheric aerosol optical depth using the ˚Angstr¨om power law, Solar Energy, 63, 303–311, 1998.
Martinez-Lozano, J. A., Utrillas, M. P., and Pedr´os, R.: Visible solar irradiance measurements, (Eds) Sanchez-Muniosguren, L., Cuevas, E., and de la Morena, B. A., First Iberian Intercompar-ison Campaign of Spectroradiometers (El Arenosillo, Huelva), I.N.M., Madrid, Spain (in press), 2002.
Meleti, C. and Cappellani, F.: Measurements of aerosol optical depth at Ispra: Analysis of the correlation with UV-B, UV-A, and total solar irradiance, J. Geophys. Res., 105, 4971–4978, 2000. Morena de la, B. A., Vilaplana, J. M., and Miro, G.: La observaci´on
del ozono atmosf´erico desde El Arenosillo, Fisica de la Tierra., 9, 107–122, 1997.
Myers, D. R.: Estimates of uncertainty for measured spectra in the SERI spectral solar radiation data base, Solar Energy 43, 347– 352, 1989.
Ren, Pu Bu Cin, Gjessing, Y., and Sigernes, F.: Measurements of solar ultra violet radiation on the Tibetan Plateau and compar-isons with discrete ordinate method simulations, J. Atmos. Sol. Terr. Phys., 61, 425–446, 1999.
Reuder, J. and Schwander, H.: Aerosol effects on UV radiation in nonurban regions, J. Geophys. Res. 104, 4065–4077, 2000. Ruggaber, A., Dluigi, R., and Nakajima, T., Modeling of radiation
quantities and photolysis frequencies in the troposphere, J. At-mos. Chem., 18, 171–210, 1994.
Russel, P. B., Livingston, J. M., Pueschel, R., Bauman, J. J., Pol-lack, J. B., Brooks, S. L., Hamill, P., Thomason, L. W., Stowe, L. L., Deshler, T., Dutton, E. G., and Bergstrom, R. W.: Global to microscale evolution of Pinatubo volcanic aerosol derived from diverse measurements and analysis, J. Geophys. Res., 101, 18 745–18 763, 1996.
Sanchez-Muniosguren, L., Cuevas E., and de la Morena, B. A.: (Eds) First Iberian Intercomparison Campaign of Spectrora-diometers (El Arenosillo, Huelva), I.N.M., Madrid, Spain, (in
574 V.-E. Cachorro et al.: Measurements and estimation of the columnar optical depth press), 2002.
Schmid, B., Spyak, P. R., Biggar, S. T., Wehrli, C., Sekler, J., In-gold, T. Maetzler, C., and Kaempfer, N.: Evaluation of the appli-cability of solar and lamp radiometric calibrations of a precision Sun photometer operating between 300 and 1025 nm, Appl. Opt., 37, 3923–3941, 1998.
Slusser, J., Gibson, J., Bigelow, D., Kolinski, D., Wanfeng, M., Koenig, G., and Beaubien, A.: Comparison of column ozone re-trievals by use of an mutifilter rotating shadow-band radiometer with those from Brewer and Dobson spectroradiometers, App. Opt., 38, 1543–1551, 1999.
Torres, O., Bhartia, P. K., Herman, J. R., Ahmad, Z., and Gleason, J.: Derivation of aerosol properties from satellite measurements of backscattered ultraviolet radiation: Theoretical basis, J. Geo-phys. Res., 103, 17 099–17 110, 1998.
Torres, O., Bhartia, P. K., and Herman, J.: Aerosol absorption char-acterization from observations of near UV radiation, Abstract of the International Radiation Symposium IRS 2000. Current Prob-lems in Atmospheric Radiation, St. Peterburg, Russia, 2000. UNEP: Environmental Effects of Ozone Depletion: 1998
Assess-ment (http://sedac.ciesin.org/ozone/UNEP).
Vasilyev, O. B., Leyva A., Muhlia, A., Valdes, M., Peralta, R., Ko-valenko, R., Welch, M., Berendes, T. A., Isakov, V. Yu., Ku-likovsky, Y. P., Sokolov, S. S., Strepanov, N. N., Gulidov, S. S.,
and Hoyningen-Huene, W.: Spectroradiometer with wedge inter-ference filter SWIF: measurements of the spectral optical depth at Mauna Loa Observatory, App. Opt., 34, 4426–4436, 1995. Veefkind, J. P. and De Leeuw, G.: A new algorithm to determine
the spectral aerosol optical depth from satellite radiometer mea-surements, J. Aerosol Sci., 29, 1237–1248, 1998.
Vergaz, R.: Turbiedad atmosf´erica y caracterizaci´on de los aerosoles mediante medidas espectroradiometricas, MSC De-gree, Department of Applied Physics I, University of Valladolid, Spain, 1996.
Vergaz, R.: Propiedades ´opticas de los aerosoles atmosf´ericos. Car-acterizaci´on del ´area del Golfo de C´adiz, Ph.D. Dissertation, Departamento de Optica y Fisica Aplicada, University of Val-ladolid, Spain, 2001.
Wang, P. and Lenoble, J.: Comparison between measurements and modeling of UV-B irradiance for clear sky: a case study, App. Opt., 33, 3964–3971, 1994.
van Weele, M.: Effect of clouds on ultraviolet radiation. Photodis-sociation rates of chemical species in the troposphere. Ph D. Dis-sertation, University of Utrecht, The Netherlands, 1996. WMO, Report of the WMO workshop on the measurements
of atmospheric optical depth and turbidity, (Ed) Hicks, B., WMO/GAW 101, WMO/TD 659, World Meteorological Orga-nization, Geneva, Switzerland, 1993.