Dynamic resource allocation DAMA alternatives
study for satellite communications systems
The MIT Faculty has made this article openly available.
Please share
how this access benefits you. Your story matters.
Citation
Huan Yao et al. “Dynamic Resource Allocation DAMA Alternatives
Study for satellite communications systems.” Military
Communications Conference, 2009. MILCOM 2009. IEEE. 2009. 1-7.
© Copyright 2009 IEEE
As Published
http://dx.doi.org/10.1109/MILCOM.2009.5379941
Publisher
Institute of Electrical and Electronics Engineers
Version
Final published version
Citable link
http://hdl.handle.net/1721.1/59386
Terms of Use
Article is made available in accordance with the publisher's
policy and may be subject to US copyright law. Please refer to the
publisher's site for terms of use.
DYNAMIC RESOURCE ALLOCATION DAMA ALTERNATIVES STUDY FOR SATELLITE
COMMUNICATIONS SYSTEMS
Huan Yao, Jeff McLamb, Mehmet Mustafa, Aradhana Narula-Tam, Navid Yazdani1 MIT Lincoln Laboratory
Lexington, MA ABSTRACT
We consider the design ofDemand Assigned Multiple Ac-cess (DAMA) algorithms that efficiently utilize limited RF uplink resources for packet switched military satellite communication networks. In previous work, we designed DAMA algorithms that optimized link layer efficiency and throughput while controlling delay and jitter. In this work we assess the ability ofour DAMA algorithm to meet Ser-vice Level Agreements (SLA) between the Network Man-agement System and the terminals. We evaluate the ability offour DAMA algorithms to provide terminals Committed Information Rates (CIR) under various system loading conditions. The designs have increasing levels of confi-dence in the accuracy of the predicted demand. Results show that although traffic demand cannot be predicted precisely, current demand provides insight into future de-mands and that this information can be used to more effi-ciently provide CIR guarantees to terminals.
I. INTRODUCTION
To support increasing demands for connectivity and bandwidth, future protected military satellite communica-tion systems will support Internet-like packet traffic rather than provisioning circuits for all users. Since packet traffic is bursty and variable, future satellite networks will dy-namically allocate resources on a demand basis to effi-ciently share the link data rates among hundreds to thou-sands of users. Furthermore, terminals have a wide range of transmission and power capabilities and experience time-varying channels due to weather changes, mobility, jamming, and antenna beam patterns. Due to these nu-merous variations and the desire to efficiently share the available time and frequency resources, Dynamic Re-source Allocation (DRA) is employed.
The purpose of DRA is to efficiently utilize scarce satellite RF resources for delivering bursty IP traffic in time-varying channel conditions, and at the same time, achieve good performance in terms of both user experienced appli-cation performance and meeting Service Level Agree-ments (SLA). There are two main techniques employed by DRA, Dynamic Coding and Modulation (DCM) and De-mand Assigned Multiple Access (DAMA). DCM adjusts the coding and modulation used as the channel condition
varies. DAMA adjusts the amount of RF resources as-signed to a terminal depending on its traffic demand. We previously demonstrated the feasibility of DRA using a set of baseline DCM and DAMA algorithms [1]. Results demonstrated the ability of DCM to reassign terminals to different communication modes as channel condition var-ied, the ability of DAMA to reassign resources to accom-modate bursty traffic in a timely fashion, and the robust-ness of control messaging protocols. The DRA algorithm was also shown to be robust against smart jammers [2]. While previous studies evaluated application performance metrics such as packet delays and file transfer delays, this study is also concerned with meeting SLAs. In particular, the emphasis is on using DAMA to provide terminals with Committed Information Rates (CIR), which is the rate that the terminal is contracted to receive when it is needed. There is also a Minimum Sustained Rate (MinSR), which is the rate a terminal receives when it is not active to en-sure infrequent small packets are delivered quickly without waiting for resource allocation. CIR and MinSR provide guidelines on how resources should be allocated. Both CIR and MinSR are defined for each DRA tier. A tier con-sists of one or more QoS traffic classes with similar re-quirements on packet loss, delay, and jitter. While there may be a large number of QoS classes, there are only a few tiers, simplifying the allocation complexity.
This study compares four DAMA algorithms based on two different design philosophies. Constant channel condi-tions are assumed for ease of comparison. The first design philosophy uses terminal traffic demand statistics to de-termine the data rates needed a few seconds in the future. By matching the allocation to the predicted demand, the hope is to efficiently utilize the limited RF resources. The alternate philosophy is based on the premise that it is im-possible to correctly predict demand for highly bursty IP traffic and hence resources should be assigned based on whether a terminal is active or inactive [3].
Section II provides a literature review on traffic predict-ability. Section III presents the four DAMA alternatives. The OPNET simulation setup is described in Section IV. Performance metrics, results and conclusions are given in Sections V, VI, and VII.
1This work is sponsored by United States Air Force under Air Force contract #FA8721-05-C-0002. Opinions, interpretations,
II. TRAFFIC PREDICTABILITY
In this section we present some results from the literature discussing the feasibility of traffic prediction for various traffic types at the timescale and accuracy level of interest. In order for traffic prediction to enable better performance in the DAMA resource allocation algorithms , traffic must be predicted several seconds in advance. This is mainly due to the satellite propagation delay and processing de-lays, which lead to a few seconds delay between the time the queue statistics are collected and the time resource as-signments based on these statistics are used.
In terms of prediction accuracy, we only need to predict at a level that improves DAMA performance, rather than provide fine-grained prediction. We would like to deter-mine a high-probability upper bound on the terminal 's data transfer requirements. If this upper bound is lower than the CIR defined in the SLA, then the difference between the bound and the CIR can be used to satisfy another ter-minai's CIR and increase resource utilization efficiency . In our literature review, we examined several papers [4]-[12]. These papers suggest that although it is not possible to predict traffic at a fine granularity precisely, it may be possible to predict certain types of traffic to a certain level within a certain error tolerance.
Some general conclusions from these papers include: 1. Different types of traffic have varying degrees of
predictability. Hence it may be useful to sepa-rately queue different types of traffic. For exam-ple, if real-time traffic is more predictable, placing it in a separate queue allows the system to accu-rately allocate resources for the queue.
2. Different types of traffic have different predict-ability levels at different time scales.
3. There are at least two time scales of importance: a. Sampling interval - The number of
arri-vals within a sampling interval is meas-ured. Future traffic arrivals are predicted for the same sampling interval.
b. Prediction interval - The prediction inter-val corresponds to how far in the future one is trying to predict traffic.
4. Increased multiplexing leads to increased predict-ability.
5. Simple traffic prediction schemes can be effective for Internet traffic.
As the traffic models, time scales, prediction intervals, and error tolerances studied in the literature are not exactly the same as those in our system of interest, we decided to con-tinue our own simulations to determine whether traffic prediction can be applied effectively to DAMA algorithms .
III. DAMA ALGORITHMS
The DAMA algorithms are centralized algorithms residing on the payload that use terminal reported queue statistics to dynamically assign non-overlapping time-frequency slots to each terminal. The assignment should efficiently utilize resources, lead to good application performance, as well as meet terminal SLAs with high probability .
The DAMA algorithms considered in this study have five modules as depicted in Figure 1. Each epoch
«
1 sec), each terminal sends its supportable modes, as well as the average arrival rate and instantaneous queue volume of each of its queues to the payload. The DAMA algorithm combines the queue statistics into tier statistics. In the first two blocks, the queue arrival rate and queue volume in-formation collected in epoch n are used to determine the needs of each terminal in epoch n+3, which is then used in the last three blocks to make allocations. The DAMA algo-rithm outputs the terminal mode and slot assignments.Allocateavailableresources
Supportablemodes
&queue statistics fromallterminals
Figure 1.Modular structure of the DAMA algorithm
and the steps involved in predicting a terminal's needs and making resource allocations
The various DAMA algorithms that we compare differ only within the Request Forming module. In the rest of this section, we first explain the function of each of the five modules and then focus on the various Request Form-ing module alternatives.
The Arrival Rate Prediction module predicts the rate that will arrive in epoch n+3. Let the actual arrival rate at
ep-och n be denoted by xn ' and let the predicted arrival rate
at epoch
n
be denoted by Yn ' A window ofw
recentsamples is used to compute the predicted arrival rate Yn+3 for epoch
n
+
3 using a predictor function !(xn-w+W"'xn). We investigated a number of prediction approaches, including Exponentially Weighted Moving Average (EWMA) , Max arrival rate with window, moving average, linear and quadratic polynomial predictors with caps, and multi-level prediction. Based on performance, the Max arrival rate with window size 4 was se-lected: yn+3=
max(x
n,x
n- W ' "x
n_w+) ) ' With this approach,once a new maximum value is identified, the predicted arrival rate rapidly moves up to the new maximum level. If no new maximum is detected, the previous maximum value is maintained until w epochs expire. Operationally,
the predicted arrival rate rises with the rising edges of the actual arrival rates rapidly, but its decrease with falling arrival rates is not as aggressive; it does not go down when reduction in activity is temporary.
Figure 2. Various Request-Forming algorithms have different levels of confidence in the predicted demand.
LBR MLR
~M ~M
Confidence~ ~Confidence
In the ABR LBR+ In the
Predicted , - - - -- - - ----, Predicted
Demand Demand
In the Activity-Based Request forming (ABR) algorithm, the requests made are solely a function of whether a par-ticular tier is considered active. The actual value of the predicted demand is not used. A terminal tier is consid-ered to beactive if its predicted arrival rate is greater than one half MinSR or its predicted demand is greater than MinSR. Once a terminal tier is determined to be active, requests are made in steps of 25% CIR.
In the Load-Based Request forming (LBR) algorithm, ter-minals make requests up to their predicted demand in steps of 25% CIR up to 100% CIR. Afterwards, a set of "back-fill" steps are performed for active terminals to increase their cumulative request to 100% CIR. In the LBR algo-rithm, a terminal tier is considered active if its predicted arrival rate is greater than one half of its MinSR.
The Load-Based+ request forming (LBR+) algorithm is nearly identical to the LBR algorithm except requests for the portion of predicted demand above 100% CIR are made prior to back-filling for all active terminals.
The Multi-Level request-forming (MLR) algorithm is a mix between the ABR and the LBR algorithms that defines multiple levels of activity based on the amount of pre-dicted demand. In particular, 5 levels: MinSR, 25% CIR, 50% CIR, 75% CIR, and 100% CIR are used. The pre-dicted demand is essentially rounded up to one of these levels and then the LBR algorithm is used.
The four request-forming algorithms reflect different lev-els of confidence in the accuracy of the predicted demand as described below and illustrated in Figure 2:
• The ABR algorithm has the least confidence in the predicted demand and effectively reduces the pre-dicted amount to one bit,activeorinactive.
• The MLR algorithm has slightly more confidence in the predicted demand, quantizing it and effectively re-ducing the predicted demand information to a few bits. • The LBR algorithm does not perform any quantization of the predicted demand, but does not have sufficient confidence in the predicted demand to request any-thing above CIR.
• The LBR+ algorithm has the most confidence in the predicted demand; it trusts the predicted demand enough to request above CIR predicted demand before back-filling other terminals with below CIR predicted demands to their full CIR.
In the Demand Prediction module, the algorithm attempts to determine the resource needs of a terminal in epoch
n+3, so that its queue will be emptied at the end of epoch n+3. This is done by considering the volume at the end of
epoch n, the predicted arrival rates for epochs n+1,n+2,
and n+3 and the allocations already made for epochsn+1 and n+2. The payload uses the following equation to de-termine the demand for epochn+3.
Demandn+3=max(max(volumen +arrivaln+l- al!ocationn+I 'O) +
arrivaln+2 - al!ocationn+2,0)+arrival n+3 .
The motivation for including the volume in the calculation is to clear any queue backlog and the motivation for sub-tracting allocations for epochs n+1 and n+2is to avoid re-peated allocation for the same backlog volume.
In the Request Forming module, the predicted demand for each terminal is converted into a series of prioritized steps to help DRA determine which demands are most important to satisfy when resources are limited. Both CIR and MinSR are taken into account here. The simplest algorithm is one in which each predicted demand is converted into a one-step request, meaning all demands are equally impor-tant. Another algorithm forms requests in steps of 25% CIR when the predicted demand is greater than MinSR. This module is discussed in more detail later.
In the Allocation BT (Bandwidth-Time) Resource module, the payload considers the available resources and the pri-oritized requests from each terminal to determine how much to allocate to each terminal. First, resources are allo-cated to meet the top-priority requests from all terminals, then the 2ndtop priority requests, then the 3rd
, and so on. If
the nth top priority requests are met, but not the n+1stones,
then a binary search is performed to identify the fraction of the n+1st requests that can be met. The output of this mod-ule is the number of time-frequency slots allocated to each terminal and the terminal mode. Additional detail can be found in [13].
The Slot Packing module assigns specific non-overlapping time-frequency slots to terminals. After packing, time-slots assigned to each terminal are "shuffled" to reduce jitter. Detail of the packing algorithm can be found in [14]. After all five modules, if there are still unallocated re-sources, the remaining resources are uniformly allocated to all terminals. Simulation results have verified that assign-ing all available resources improves performance.
Request Forming Alternatives
As mentioned above, the various algorithms differ only in the Request Forming method. The four Request Forming alternatives are Activity-Based Request forming (ABR), Load-Based Request forming (LBR), Load-Based+ Re-quest forming (LBR+), and the Multi-Level ReRe-quest form-ing (MLR).
IV. SIMULATION SETUP
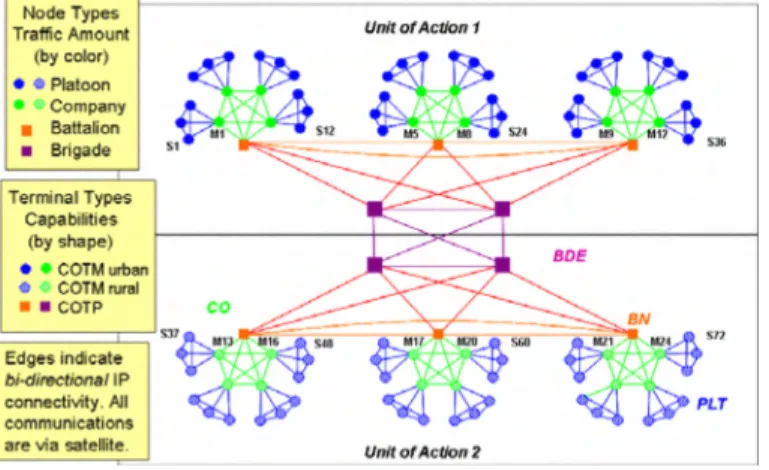
To compare the DAMA algorithms, a 106-terminal topol-ogy model is created within OPNET. Further information about this model can be found in [1,2,15]. The traffic to-pology illustrated in Figure 3 shows which terminals are communicating via satellite. Each terminal is characterized both by node type (color) and terminal type (shape). The node type defines the amount of traffic a terminal is ex-pected to have. A Brigade terminal tends to have more traffic than a Platoon terminal. The terminal type denotes terminal capability , including power, supportable commu-nication modes, and memory size. In this study, all termi-nals are assumed to experience weather-free, jam-free, blockage-free channel conditions in order to focus on DAMA algorithm performance.
Figure 3. Communication topology with 106 terminals Two traffic models are used in the simulations, the Expo-nential traffic model and the Heavy-Tailed traffic model. The latter was suggested by K. Nichols and M. Williams [3]. The traffic it generates has a much more bursty nature compared to the Exponential traffic model, but the average load is much less as shown in Table I. As a result, a 4x version of the Heavy-Tailed traffic model is also consid-ered, which generates slightly less than four times as much traffic by reducing the session inter-arrival times by four. With Heavy-Tailed Ix traffic, the 99th percentile load is
more than twice the average, reflecting its high burstiness. Due to multiplexing, the Heavy-Tailed 4x 99% load is only twice that of the Heavy-Tailed Ix traffic.
The Exponential traffic model consists of two application types: Streaming Video and FTP, each contributing to about 50% of the total traffic. They are separately queued but mapped to one DRA tier.
The Heavy-Tailed traffic model utilizes several heavy-tailed distributions such as Pareto, Weibull, and log-normal to create the more bursty traffic. Itmakes use of six application types mapped to two tiers. Streaming video, routing control traffic, FTP-small , and FTP-large
Average total traffic load 15.2 Mbps 3.07 Mbps 10.6 Mbps 90% total traffic load 18.9 Mbps 4.98 Mbps 14.1 Mbps 99% total traffic load 22.6 Mbps 8.14 Mbps 17.7 Mbps Average traffic load per 1007 Kbps 68 Kbps 227 Kbps
Large terminal
Average traffic load per 53 Kbps 25 Kbps 87 Kbps Small terminal
are all mapped to one DRA tier, while Web browsing and text messaging are mapped to a lower DRA tier.
Table 1: Traffic loading statistics
For both traffic models, different amounts of available bandwidth are used to create different congestion levels in order to compare the DAMA algorithms under different system loads. For each traffic model, and at each loading level, CIR and MinSR are set prior to the simulation . The approach used to set CIR and MinSR levels for this study is detailed in [15].
V. PERFORMANCE METRICS
System performance goals include system utilization, meeting CIRs in SLAs with high probability, and user ap-plication performance. The following metrics are used to evaluate system performance.
System bandwidth-time utilization
The system bandwidth-time utilization is the percentage of bandwidth-time product allocated to the terminals that is used to deliver data. For example, if the system is operat-ing at 40% utilization, this implies that 60% of the capac-ity is not used to send data, although it may have been as-signed to terminals. System bandwidth-time utilization is also an indicator of the congestion level. If an approach requires the system to be configured for low congestion, this metric quantifies the resulting utilized capacity. Under-Allocation
The under-allocation metric calculates the percentage of epochs where the allocation for an epoch is insufficient to meet demand below CIR for that epoch. The under-allocation metric is a direct measure of SLA compliance. For example 10% under-allocation means that traffic de-mands (at or below CIR) are met 90% of the time.
Application Performance
Ultimately , the application performance is what the user cares about. Measures of application performance include packet loss rate, video packet delay, and file transfer delay. Application performance reflects the performance one user gets while system utilization is an indicator of how many users can obtain this performance.
VI. RESULTS
In this section, we evaluate each of the request-forming algorithms (ABR, MLR, LBR, and LBR+), using both
PLT Un/lofA crJon f Unft o f A ction 2 " Terminal Types Capabilities (by shape) • • COTMurban o • COTMrural • • COTP Node Types Traffic Amount (by color) • 0 Platoon • • Co mpany • Battalion • Brigade Edges indicate bi-directiona/ lP connectivity.AU communications are vi a satellite. 40f7
traffic models (Exponential and Heavy-Tailed). The per-formance metrics described above are used to compare the algorithms under varying load conditions.
In the graphs below, the x-axis shows the loading level in terms of the total bandwidth available for allocation. Lower bandwidth corresponds to a more heavily loaded and more congested system. The y-axis shows the evalua-tion metric. Two figures are associated with each metric, one for the Exponential traffic model (left) and one for the Heavy-Tailed traffic model (right). In the Heavy-Tailed traffic model figure, there are two sets of curves: the left set corresponds to the Ix traffic model (relatively lower load), and the right set is for the 4x traffic model (rela-tively higher load). Each curve corresponds to a request forming method. The marker on each curve represents the average performance metric of three 5000 second long runs. The ends of the error bars represent the highest and lowest values of the three runs. For the Heavy-Tailed traf-fic model, the set of three 5000 second long runs for each request-forming method uses the same set of three random seeds to achieve similar traffic loading (FTP file sizes, Web page sizes, etc.), so that the differences in perform-ance between the request-forming methods are not a result of statistical differences in traffic loading.
Figure 4 shows the system bandwidth-time utilization in percentage. The solid curves are the average utilization and the dotted curves are the 99thpercentile utilization.
tion. At very heavy loads, some traffic starts to get dropped, as shown later with the packet loss rate metric. Comparing the dotted curves representing 99th percentile
utilization, LBR+ (blue diamond) achieves the highest 99th
percentile utilization. This is because LBR+ occasionally assigns above CIR resources to large bursts of traffic, lead-ing to higher utilization. The other request-formlead-ing meth-ods all have similar 99thpercentile utilization.
With the Heavy-Tailed traffic model, the Ix traffic 20 MHz bandwidth case and the 4x traffic 80 MHz bandwidth case achieve similar average utilization, since both the traffic load and the amount of resources increased by a factor of 4. However, the latter has significantly lower 99th percentile utilization due to traffic multiplexing .
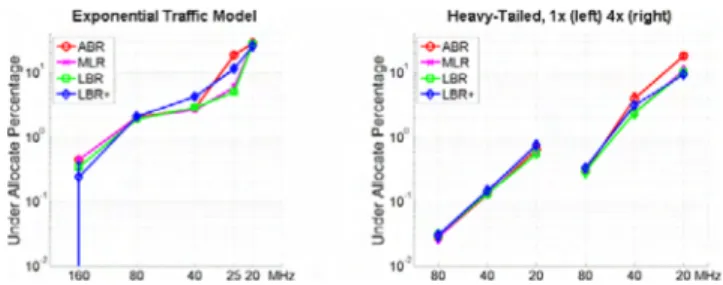
Figure 5 shows the under-allocation performance metric. Results for both traffic models show that under-allocation percentage increases with system loading level. As system resources decrease, terminals receive less and less alloca-tion, hence the probability of under-allocation increases. The under-allocation percentage grows by about a factor of 5 each time congestion level doubles causing the curves to look approximately linear on the log-log scale. When the system becomes highly congested (>50% load), the under-allocation percentage exceeds 10%. The different request-forming methods achieve similar under-allocation per-formance; variations are mostly within a factor of two.
Heavy-Tail ed,1x(left) 4x (ri ght)
Load
I
EX~~tvI
Veryli~tI
LiltrtI
ModerateI
HeavyI
40 20 80 40 20 MHzHea vy-Tailed. 1, (Ieftj 4, (rightJ
f. ,I~~
/ ' m10 -&- LBR ~ + LaR · Q;Fr/ ..
40 2S 20t.I1zE xpon~ntialTrlImc Model , -e- AeR ~ 10t r :::~~ ~ + UlR· Q; • ~10°1
g
! ~10 ' / ~ : :::> 10 ~ 160 80;:·~-;;t~·
• ; ' . / ... ' 9%~33'1,
~% . - Average 80 40 20 80 40 20 MHz + ABR - MLR Q) 8O. ... l BR S + LBR. ~ 60 & ~..
~ 5 20 o H~O 80 40 ~20MHzI
LoadI
y~~I
U~tI
Moderatel~a3 ~~~I
Exp on enti al Traffic Mode l100 I::~~
•
f e 6O,I- LeR 70 .80%I
60 ,:'l::'percenlile:l: 63-66%
~
' 0/ L:,./.
~ 5 20Figure 4. Percentage system bandwidth x time utiliza-tion for both Exponential and Heavy-Tailed traffic models under different system load conditions
For the Exponential traffic model, the system utilization level varied from 10% (very lightly loaded case) to 70-80%, (very heavily loaded case). For the Heavy-Tailed traffic model, the system utilization started at as low as5%,and went up to58-65%.
All solid curves are on top of each other, implying that all request-forming methods lead to similar average utiliza-tion, except at very heavy loads. This is because offered load does not change with request-forming method, and all offered traffic was serviced except at very heavy loads. Servicing the same amount of traffic loads require the same amount of resources, thus the same system
utiliza-Figure 5. Percentage under-allocation for both Expo-nential and Heavy-Tailed traffic models under differ-ent system loading conditions
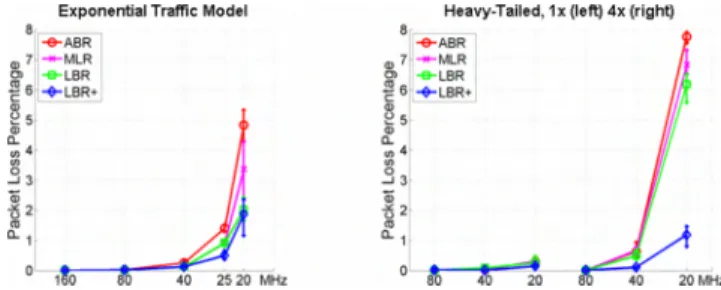
Figure 6 shows the packet loss rate in percentage. The main contributor to loss is packet overflow at the terminal queue due to prolonged insufficient assignment. The re-sults show that at low system loading levels, when there is very little congestion, the packet loss rates are very low. When the system is moderately loaded, the packet loss rate is higher, but still less than I%. When the system is heav-ily loaded and congestion becomes heavy, packet loss in-creases dramatically.
All request-forming methods achieve very low packet loss rate at low system loading level. When the system is mod-erately or heavily loaded, request-forming methods with requests more closely related to the predicted demand
achieve relatively lower packet loss rates. In particular, LBR+, which requests resources for the full predicted de-mand without quantization or capping by CIR, achieves the lowest packet loss rate. LBR, MLR, ABR, result in successively higher packet loss rates, as the request-forming method depends less and less on the predicted demand. When system resources are limited, algorithms that use predicted demand to assign resources have a higher chance of servicing backlogged data bits and avoid-ing packet losses.
Hea"Y.Talled. 1x (left)4.Irlgh~
eo 40 20 eo 40 2OW1.I:
10
+-';:i - Ml R File size is
S10 _ l BR Pareto (10/ B. 1)
~ .... lBR·
r ~ ~
the Heavy-Tailed traffic model are smaller than the fixed 100 KB file size in the Exponential traffic model, the aver-age FTP-small file transfer delay tends to be smaller, so the y-axis scale of the two figures is set differently.
Figure 8. FTP-small file transfer delays for both traffic models under different system loading conditions
For both traffic models, FTP-small file transfer delay in-creases with system loading level. Comparing the different request-forming methods, LBR+ achieves the best delay at all system loading levels. The difference is more signifi-cant at moderately high loads but still observable at low system loading level. Similar trends were observed for the average file transfer delay for large FTP file transfers. In all the application performance results, LBR+, the method relying most on the predicted demand, exhibited the best performance. The difference in performance is most significant at high system loading levels.
To understand the impact of CIR, we varied CIR settings at different loading levels and observed how SLA per-formance and delay perper-formance changed. The ABR and LBR+ methods were compared. Results show that under-allocagtion increases with CIR. At low CIR rates, ABR has better SLA performance, while at higher CIR rates, LBR+ has better SLA performance. The key observation is that there is a cross-over point, generally around I% un-der-allocation. In terms of delay performance, LBR+ achieves lower delay than ABR at all CIR settings.
VII. CONCLUSIONS
Our initial traffic predictability literature search indicated that while it is not possible to predict traffic at a fine granularity precisely, it may be possible to do some level of traffic prediction. Consistent with this indication, our DAMA algorithm comparisons have shown that coarse-grained traffic prediction is effective in improving DAMA. LBR+, the request-forming method that relies most heavily on the demand prediction provided the best performance in most situations, especially under high load.
The desired quantities the study focused on were: • high rate (CIR) guarantees in the SLA, • providing CIR with near 100% probability • high resource utilization, and
• good delay performance.
)
H""Y·Talled. 1x (left)4.'rlgh~
co 40 20 CO 40 2O~
Exponenrlal Trame Model
1450 30 40 25020MH.r:
..
~05
~
Expon ential Traffic Model
6 ~ 7 ~~~~ W6 ~~~~.
~5 ~
~ 4ls I -' 3-;; ~2j Q. ' [ 0-- 1 0 8 40 2520 MHzFigure 7. Video packet delay for both traffic models under different system loading conditions
Figure 8 shows the average file transfer delay for small FTP file transfers. In the Exponential traffic model, all FTP-small files have a fixed file size of 100 KB. In the Heavy-Tailed traffic model, the FTP-small files have Pareto distributed file sizes starting at 10 KB and decaying with a shape parameter of1.In this model, 50% of the files are larger than 20 KB, 10% of the files are greater than 100 KB, and so on. Since 90% of the FTP-small files in
Figure 6. Packet loss rates for both traffic models un-der different system loading conditions.
Figure 7 shows the average video packet delay in seconds. This delay is measured end-to-end in the application layer. Video packet delay remains relatively low until the system becomes congested. At low system loading levels, all re-quest-forming methods achieve equally low video packet delay. At heavy congestion levels, the video packet delay increases dramatically, as allocation is insufficient to meet demand, resulting in full queues and dropped packets. In this case, LBR+ achieves the best performance. The Ex-ponential traffic model simulations show lower video packet delays at heavy congestion levels. This is because strict priority queuing is used with the Exponential traffic model, while the Heavy-Tailed traffic model simulations used CB-WFQ (Class Based - Weighted Fair Queuing).
While all of the above are desirable, it is not possible to improve all qualities at the same time. There are intrinsic tradeoffs:
1. The higher the rate (CIR) guarantee, the lower the probability at which the rate can be guaranteed (for fixed total amount of resources and traffic).
2. Higher system resource utilization results in more congestion, hence reducing the set of rate-probability pairs can be achieved.
3. Higher resource utilization comes at the expense of worse delay performance, as the system becomes more congested. LBR+ achieved the best delay performance especially at high resource utilization level.
4. When the probability of guaranteeing CIR is greater than 99% (less than 1% under-allocation), the CIR rate and the delay performance can be traded by choosing different request-forming methods. In particular, using ABR may allow lower under-allocation at lower CIR while using LBR+ may lead to lower under-allocation at high CIR and better delay performance.
Understanding the direction and magnitude of these trade-offs can be instrumental in both helping system designers and enabling mission planners to select operating points. This study provides a few sets of sample points to help system designers set appropriate expectations on achiev-able performance. At low utilization levels «20%), we can expect SLAs to be met and application performance meas-ures to be quite good independent of DAMA algorithm choices. At medium utilization levels (20-50%), moderate CIR rates and/or rate probability guarantees can be ex-pected, and reasonably good delay performance can be achieved using the LBR+ request forming method. Push-ing utilization above 50% comes with significant cost in meeting SLA and delay performance measures; lower CIR rates and/or rate probability guarantees can be expected, and tolerable delay performance may be achieved using the LBR+ request forming method. This utilization-performance tradeoff suggests that adding a scavenger traffic class without any performance guarantees may al-low us to more fully utilize valuable resources while con-tinuing to provide good performance guarantees to the more important traffic.
More details of this study can be found in [15].
REFERENCES
[1] P.J. Donovan, A. Narula-Tam, J.P. Pandya, J.S. Wyso-carski, and H. Yao, "Transformational Satellite Communi-cations System (TSAT) Dynamic Bandwidth Resource Allocation (DBRA) Evaluation Study Phase 2," MIT Lin-coln Laboratory Project Report SC-T-0010, 31 July 2007
[2] Julee Pandya, Huan Yao, Aradhana Narula-Tam, and Jeff Wysocarski, "Designing Satcom Dynamic Bandwidth Resource Allocation For Operation Under Partial-Time Jamming," MILCOM, October 2007
[3] K. Nichols and M. Williams, Internal Reports and Dis-cussions, www.pollere.com.
[4] L. Gyorfi, G. Morvai, and S. Yakowitz, "Limits to con-sistent on-line forecasting for ergodic time series," IEEE Transactions on Information Theory, Vol. 44, 1998. [5] A. Sang and S. Li, "A Predictability Analysis of Net-work Traffic," Computer NetNet-works, Vol. 39, 2002.
[6] Y. Qiao, J. Skicewicz, P. Dinda, "An Empirical Study of the Multiscale Predictability of Network Traffic," Pro-ceedings of IEEE HPDC, 2003.
[7] Y. Baryshnikov, E. Coffman, D. Rubenstein, and B. Yimwadsana, "Traffic Prediction on the Internet," Colum-bia University Technical Report EE200514-1, May 2002. [8] S. Chong, S. Li, and J. Ghosh, "Dynamic Bandwidth Allocation for Efficient Transport of Real-Time VBR Video over ATM," Proceedings of IEEE Infocom, 2003. [9] J. Aracil, D. Morato, E. Magana, M. Izal, "IP Traffic Prediction and Equivalent Bandwidth for DAMA TDMA Protocols," Proceedings of IEEE Personal Indoor and Mo-bile Radio Communications, September 2003.
[10] A. Sang and S. Li, "Measurement-based virtual queue (VQ): to estimate the real-time bandwidth demand under loss constraint," Computer Networks 46, 2004.
[11] Z. Jiang, Y. Li, and V. Leung, "A Predictive Demand Assignment Multiple Access Protocol for Broadband Sat-ellite Networks Supporting Internet Applications," Pro-ceedings of IEEE International Communications Confer-ence, 2002.
[12] M. Hasegawa, G. Wu, M. Mizuno, "Applications of Nonlinear Prediction Methods to Internet Traffic," Pro-ceedings of IEEE International Symposium on Circuits and Systems, 2001.
[13] N. Yazdani, "Dynamic Bandwidth Resource Alloca-tion (DBRA) Mode and Timeslot AllocaAlloca-tion Algorithm," MIT Lincoln Laboratory Memorandum #64PM-ATOL-0005, 10 July 2008
[14] N. Yazdani, "Frequency Time-Division Multi-ple-Access (MF-TDMA) Resource Packing," MILCOM, November 2008
[15] M. Mustafa, H. Yao, N. Yazdani, P.J. Donovan, J. McLamb, A. Narula-Tam, "Transformational Satellite Communications Dynamic Bandwidth Resource Alloca-tion DAMA Algorithm Alternatives Study," MIT Lincoln Laboratory Project Report 25 November 2008.