COMPUTATIONAL FLUID DYNAMICS SIMULATIONS OF
OXY-COAL COMBUSTION FOR CARBON CAPTURE AT
ATMOSPHERIC AND ELEVATED PRESSURES
byLei Chen
M.S. Power Engineering & Engineering Thermophysics Tsinghua University, 2006
B.S. Thermal Energy & Power Engineering Tsinghua University, 2004
SUBMITTED TO THE DEPARTMENT OF MECHANICAL ENGINEERING IN PARTIAL FULFILLMENT OF THE REQUIREMENTS FOR THE DEGREE OF
DOCTOR OF PHILOSOPHY IN MECHANICAL ENGINEERING AT THE
MASSACHUSETTS INSTITUTE OF TECHNOLOGY JUNE 2013
© 2013 Massachusetts Institute of Technology. All rights reserved. The author hereby grants to MIT permission to reproduce
and to distribute publicly paper and electronic copies of this thesis document in whole or in part
in any medium now known or hereafter created.
Signature of Author . . . Department of Mechanical Engineering February 28, 2013 Certified by. . .
Ahmed F. Ghoniem Ronald C. Crane Professor Thesis Supervisor Accepted by. . . .. . . . . . .
Dave E. Hardt Chairman, Department Committee on Graduate Students
COMPUTATIONAL FLUID DYNAMICS SIMULATIONS OF
OXY-COAL COMBUSTION FOR CARBON CAPTURE AT
ATMOSPHERIC AND ELEVATED PRESSURES
byLei Chen
Submitted to the Department of Mechanical Engineering on February 28, 2013 in partial fulfillment of the requirements for the degree of Doctor of Philosophy in Mechanical
Engineering
Abstract
Oxy-fuel combustion of solid fuels, often performed in a mixture of oxygen and wet or dry recycled carbon dioxide, has gained significant interest in the last two decades as one of the leading carbon capture technologies in power generation. The new combustion characteristics in a high-O2 environment raise challenges for furnace design and operation, and should be modeled
appropriately in CFD simulation. Based on a comprehensive literature review of the state-of-the-art research on the fundamentals of oxy-coal combustion, sub-models for the critical physical processes, such as radiation and char combustion, have been properly modified for the CO2-rich
environment, and the overall performance of CFD simulation on oxy-coal combustion has been validated using Large-Eddy Simulation (LES) and Reynolds-averaged Navier-Stokes (RANS) approaches. The predicted distributions on velocity, species, and temperature were compared with experimental results from the literature in order to validate the CFD simulation. Results show that although agreeing reasonably with the measured mean axial and tangential velocity, all the RANS turbulence models used in this study underestimate the internal recirculation zone size and the turbulence mixing intensity in the char combustion zone, while LES improves the predictions of internal recirculation zone size, the entrainment of oxygen from the staging stream, and the overall flame length than the RANS approaches. Special attention was given to the CO2’s
simulations. Detailed reaction mechanism (GRI-Mech 3.0) identifies that the reaction enhances the CO formation in the fuel-rich side of the diffusion flame due to the high CO2 concentration, leading to a significantly higher CO concentration. Reasonable
CO predictions can only be obtained using finite-rate mechanisms combining with reaction mechanisms considering the above-mentioned reaction in CFD simulations.
2
H+CO OH+CO
The validated CFD approach was used to investigate the pressure’s effects in a pressurized oxy-coal combustion system. The results show that, given a fixed reactor geometry and burner velocity, the particle residence time does not change with operating pressure due to its small Stokes number; on the other hand, the coal conversion time decreases significantly because of the enhanced reaction rates at elevated pressures. Therefore, the burner can be operated at a higher burner velocity at elevated operating pressure, which results in a much higher coal throughput using the same reactor size. For instance, the thermal load can be increased from 3 MWth to 60 MWth using a pressurized oxy-coal reactor, when the operating pressure increases
from 4 bar to 40 bar. In order to investigate the slag behaviors in the pressurized oxy-coal combustor, a first-of-its-kind three-dimensional slag model has been developed, which can be applied in slagging coal combustion/gasification with any geometry. The method couples Volume of Fluid (VOF) model and Discrete Phase Model (DPM), and fully resolves the slag’s behaviors such as the slag layer buildup, multiphase flow, as well as heat transfer. The results are in good agreement with experimental observations, and can be taken as a design tool for coal furnace/gasifier development.
Thesis Supervisor: Ahmed F. Ghoniem Title: Ronald C. Crane Professor
Acknowledgements
I would like to sincerely thank my thesis advisor, Professor Ahmed F. Ghoniem, for offering me the great opportunity to study at MIT in the area of combustion and energy conversion, which is my most interested research topic. I appreciate his guidance and support over the five years Ph.D. study, from which I learnt not only the combustion theory and computational skills, but also the way to think, solve, and communicate problems in a fundamental way. His serious attitude on scientific research has set up a high standard to my future work, and will encourage me in my whole career life.
I am grateful to my thesis committee members: Professor Janos M. Beer, Professor Yiannis A. Levendis, and Professor Alexander Mitsos, for their profound insight and constructive suggestions to my research. It is my truly honor to have the masters of clean coal and energy research in my committee.
I also would like to acknowledge Enel for the financial support during my Ph.D. study. I specially thank the colleagues of Enel Ingegneria e Innovazione S.p.A., Dr. Marco Gazzino, Mr. Stefano Sigali, Mr. Nicola Rossi, and Ms. Danila Cumbo for their supportive collaborations.
Throughout the past five years I have had the pleasure working with the talented colleagues in the Reacting Gas Dynamics Lab at MIT. First, I would like to acknowledge Dr. Jongsup Hong, Sze Zheng Yong, and Chukwunwike Iloeje, who were working on different aspects of oxy-fuel research and contributed to my research progress. I am grateful to Dr. Cheng Zhang, Dr. Mayank Kumar, Dr. Simcha Singer, Cristina Botero, Dr. Santosh Shanbhogue, and Neerav Abani, for the helpful discussions on gasification and CFD modeling. Particularly, I would like to acknowledge Simcha and Sze Zheng, with whom we worked closely to investigate the oxy-fuel combustion characteristics and had productive discussions over the past five years. Many friends in the lab gave me invaluable supports, I want to thank Dr. Guang Wu, Dr. Yixiang Shi, Zhenlong Zhao, and Professor Ghoniem’s senior assistant Ms. Lorraine Rabb, for their friendships which makes the life at MIT more productive and enjoyable.
Beyond the colleagues at MIT, I would like to express my special thanks to Dr. Wenhua Li and Dr. Ligang Zheng for their encouragement to my work and life, and Dr. Genong Li at FLUENT, for his timely supports to my research.
Finally I would like to thank my parents and family, especially my wife Ling Ma and our beloved son Andrew (Xiuneng) Chen for their endless love and understanding to my study life at MIT.
Contents
Abstract... 3 Acknowledgements ... 5 Contents ... 7 List of Figures...11 List of Tables... 19Chapter 1 Introduction to Oxy-Coal Combustion ... 22
1.1. Carbon Capture Technologies for Coal-fired Power Plants... 22
1.2. Oxy-Fuel Combustion for CCS ... 26
1.2.1. Development of the Oxy-Fuel Technology for CCS ... 26
1.2.2. Atmospheric Oxy-Coal Combustion Systems with Flue Gas Recycle... 27
1.2.3. Pressurized Oxy-Coal Combustion Systems ... 31
1.2.4. Energy Efficiency Performance of the Oxy-Coal Combustion Systems ... 33
1.3. Fundamentals of Oxy-Fuel Combustion... 35
1.3.1. Heat Transfer... 36
1.3.2. Heating and Moisture Evaporation of Coal Particles ... 47
1.3.3. Coal Devolatilization and Char Formation... 51
1.3.4. Ignition of Coal Particles ... 54
1.3.5. Oxy-Char Combustion... 55
1.3.6. Chemical Effects of CO2 in Gas Phase Reactions ... 58
1.3.7. Summary ... 62
1.4. Thesis outline ... 64
Chapter 2 CFD Modeling of Pulverized Coal Combustion and the Challenges under Oxy-Fuel Conditions... 67
2.1. Overview... 67
2.2. Governing Equations and Physical Properties... 70
2.3. Turbulent Flow... 70
2.4. Radiation Heat Transfer ... 71
2.4.2. Modification of the Gray-Gas Model ... 74
2.5. Heterogeneous Reactions... 75
2.5.1. Modeling the Diffusivity’s Effect ... 76
2.5.2. Modeling the Gasification Reactions... 82
2.6. Gas Phase Reactions ... 85
2.6.1. Reduced Reaction Mechanisms ... 85
2.6.2. Turbulence-Chemistry Interactions... 87
2.7. Summary ... 88
Chapter 3 Validation of the Turbulence Models for Oxy-Coal Combustion ... 92
3.1. Overview... 92
3.2. Experimental Studies ... 94
3.2.1. Furnace and Burner Geometry... 94
3.2.2. Operating Conditions and Measurement Techniques ... 96
3.3. Modeling Approaches ... 98
3.3.1. Modeling Turbulence: RANS Simulation... 98
3.3.2. Modeling Turbulence: Large Eddy Simulation... 101
3.3.3. Coal Combustion Sub-Models... 102
3.3.4. Modeling Gas Phase Reaction ... 106
3.3.5. Modeling Radiative Heat Transfer in Oxy-Fuel Combustion... 107
3.3.6. Boundary Conditions ... 109
3.3.7. Solution Strategy... 110
3.4. Results and Discussions... 110
3.4.1. Velocity Field... 112
3.4.2. Mixing and Oxygen Diffusion ... 117
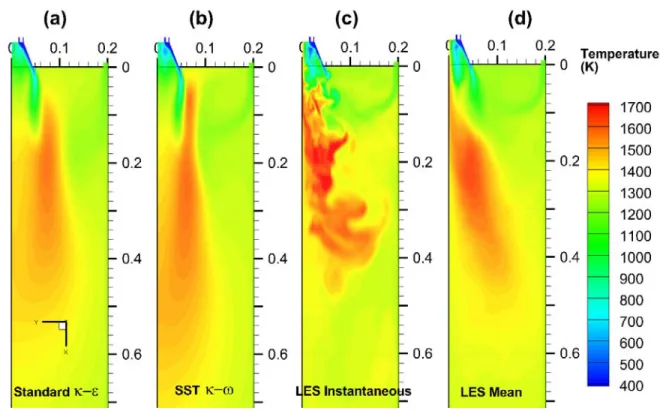
3.4.3. Temperature Distribution ... 120
3.4.4. Flame Stabilization and Oxy-Char Combustion ... 122
3.5. Conclusion ... 127
Chapter 4 Modeling the CO2 Chemical Effects in Gas Phase Reactions ... 130
4.1. Overview... 130
4.2. Experiments ... 133
4.2.2. Chalmers Swirling Flow Diffusion Flame ... 134
4.3. Modeling Approaches ... 135
4.3.1. One-Dimensional Modeling of the Counter-Flow Diffusion Flame... 135
4.3.2. CFD Modeling of the Jet-Flow and Swirling-Flow Diffusion Flames ... 135
4.3.3. Reaction Mechanisms ... 138
4.4. Results and Discussions... 141
4.4.1. Thermodynamic Analysis of the CO Concentration in Oxy-Fuel Combustion.. 142
4.4.2. One-Dimensional Counter Flow Flames ... 143
4.4.3. Jet Flow Diffusion Flame (Sandia Flame D) ... 148
4.4.4. Swirling Flow Diffusion Flames... 154
4.5. Conclusion ... 160
Chapter 5 Pressure’s Effects on Oxy-Coal Combustion... 163
5.1. Introduction to the Pressurized Oxy-Coal Combustion... 163
5.2. Pilot Scale Experimental Facility... 164
5.2.1. The Test Facility Geometry... 164
5.2.2. Operating Conditions... 165
5.2.3. Scaling Strategy for Elevated Operating Pressure ... 167
5.3. Numerical models ... 168
5.3.1. Modeling Approaches ... 168
5.3.2. Modeling the Coal Water Slurry Atomization ... 169
5.3.3. Modeling the Physical and Chemical Processes at High Pressure ... 169
5.4. Results and Discussions... 171
5.4.1. Reference Case at 4 bar... 171
5.4.2. Oxy-Coal Combustion at Elevated Pressures ... 183
5.5. Conclusions... 195
Chapter 6 Development of 3-D Slag Model ... 198
6.1. Overview... 198
6.1.1. Slagging Oxy-Coal Combustion... 198
6.1.2. CFD Modeling of the Slag Flow in Coal Combustion and Gasification ... 201
6.2. Reactor Geometry and CFD Mesh Refinement ... 203
6.3.1. The Volume of Fluid (VOF) Model ... 204
6.3.2. The Discrete Phase Model (DPM)... 205
6.3.3. Coupling the VOF and DPM methods... 207
6.3.4. Slag properties ... 208
6.3.5. Solving Strategies ... 211
6.4. Results and Discussions... 213
6.4.1. Ash Deposition and the Effect of the Turbulence... 213
6.4.2. Molten Slag Thicknesses and Flow Velocity ... 216
6.4.3. Effect of Coal Throughput on Slagging Behaviors... 220
6.5. Conclusion ... 220
Chapter 7 Conclusions... 223
7.1. Conclusions... 223
7.2. Future Work ... 225
List of Figures
Figure 1-1. Atmospheric oxy-coal combustion system with flue gas recycle proposed for carbon capture in coal power plants, figures are revised based on the work in [19-21]. ... 27 Figure 1-2. Pressurized oxy-coal combustion systems proposed for carbon capture in coal power plants,
figures are revised based on the work in [35, 36, 45, 46]. (a) Schematic of the ThermoEnergy Integrated Power System (TIPS), (b) System proposed by ENEL based on a combustion process patented by ITEA, and analyzed in recent studies by MIT... 31 Figure 1-3. Comparison of plant generating efficiency and capital expenditure [14-16, 34, 46, 56, 57] of
CO2 capture technologies. PC: conventional PC system without capture, Post: PC with post
capture, A-Oxyf: atmospheric oxy-coal with flue gas recycle, P-Oxyf: pressurized oxy-coal with flue gas recycle... 34 Figure 1-4. Spectral absorptivity as a function of wavenumber for water vapor, carbon dioxide and
methane, reproduced from reference [64]. ... 38 Figure 1-5. Comparison of total intensity measurements (symbols) and gas radiation modeling (lines) at
384 mm away from the burner inlet. Data cited from Andersson et al. [65]. ... 39 Figure 1-6. The O2 partial pressure (fraction) required at burner inlet (to achieve similar adiabatic flame
temperature as the air-fired case) for wet and dry flue gas recycle (residual O2 mole fraction in
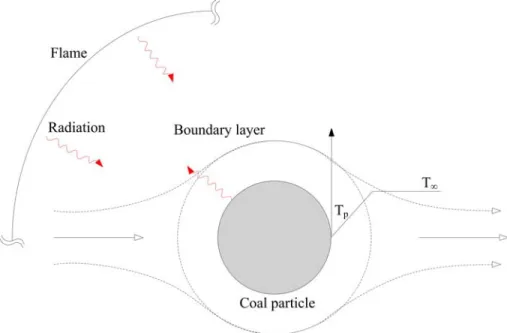
the flue gas fixed at 3.3%) [21]. The symbol ■ indicates the AFT of air-coal combustion, the red solid line — and blue dash line --- indicate the AFT of oxy-coal combustion with dry and wet flue gas recycle, respectively. ... 43 Figure 1-7. Schematic diagram of heat transfer to a single particle in coal combustion. ... 47 Figure 1-8. Predicted coal particle drying time as a function of particle size in air and CO2 gas
atmospheres. Drying processes in the primary duct during fuel transportation and in the furnace before combustion are estimated. The primary gas stream is set at 105 oC, and the gas
and flame temperatures in the furnace are set to 1000 oC and 1800 oC, respectively... 50
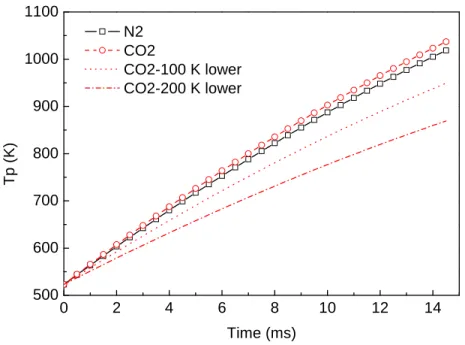
Figure 1-9. Predicted coal particle heating history in N2 and CO2 gas atmospheres. The gas temperature is
set to 1000 oC and the flame temperature 1800 oC, respectively. The gas and flame
temperature drops of 100 oC and 200 oC accounts for the possible lower temperatures under oxyfuel condition... 51 Figure 1-10. Char oxidation/gasification experiments in oxy-fuel conditions. The diagram shows three
same in both O2/N2 and O2/CO2 conditions; B: At high oxygen level and high temperatures,
reaction rates are lower in oxy-fuel conditions; and C: At low oxygen level and high
temperatures, reaction rates are higher in oxy-fuel conditions. The error bars show the range of operating conditions, colors show unchanged (black), decreased (blue), or increased (red) char consumption rate... 56 Figure 1-11. Burning velocities of methane and hydrogen mixtures at increasing equivalence ratios.
Oxygen mole fraction in the oxidizer is kept at 21% in all cases. Also plotted are the experimental data of Zhu et al. [121] in methane mixture and Westbrook [125] in hydrogen mixtures as filled symbols [124]. The symbol -⃝- indicates results using CO2, -∆- indicates
results using FCO2... 59
Figure 1-12. Experimental data of CO concentration in the methane combustion product gas at the outlet of a flow reactor as function of temperature and stoichiometry, with N2 or CO2 as bulk gas.
From the top, the graphs show the CO mole fraction under lean, stoichiometric, and fuel-rich conditions [126]. The symbol ⃟ indicates burning in N2 diluent gas, while ∆ and ∇ indicate
burning in CO2 diluent gas. ... 61
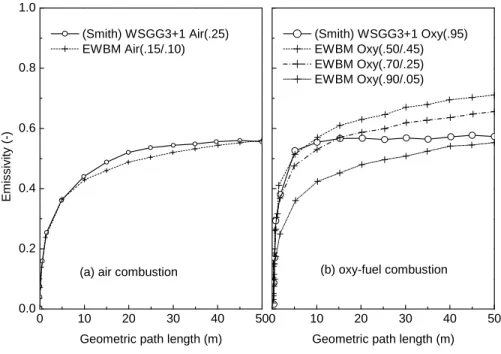
Figure 2-1. Predicted total emissivity of gas mixture of carbon dioxide and water vapor at 1500 K for: (a) conventional air combustion and (b) oxy-fuel combustion using the EWBM and the WSGG models. Values in parentheses show the molar fraction of carbon dioxide / water vapor [150]. ... 73 Figure 2-2. Species (O2, N2, CO, and CO2) mole fraction profiles in the boundary layer around a 50 um
burning char particle in the outward radial direction, predicted using the Single Film Model in air-fired and 21% O2/CO2 conditions. ... 79
Figure 2-3. Temperature profiles in the boundary layer around a 50 um diameter burning char particle with radial coordinate, predicted using the Single Film Model in air-fired and 21% O2/CO2
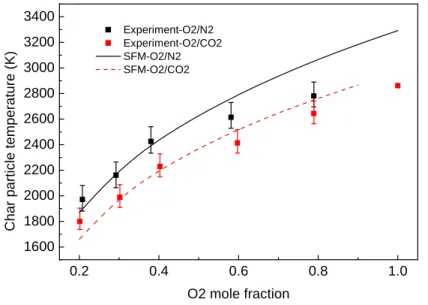
conditions. ... 80 Figure 2-4. Particle surface temperature of a 50 um char particle in O2/N2 and O2/CO2 mixtures at
Tfurnace=1400 K. Lines show the predicted results using the Single Film Model, and markers
show the experimental data in [113]. Continuous lines — and broken lines --- correspond to O2/N2 and O2/CO2 conditions, respectively. ... 80
Figure 2-5. Burnout times of a 50 um char particle in O2/N2 and O2/CO2 mixtures at Tfurnace=1400 K. Lines
show the predicted results using the Single Film Model, and markers show the experimental data in [113]. Continuous lines — and broken lines --- correspond to O2/N2 and O2/CO2
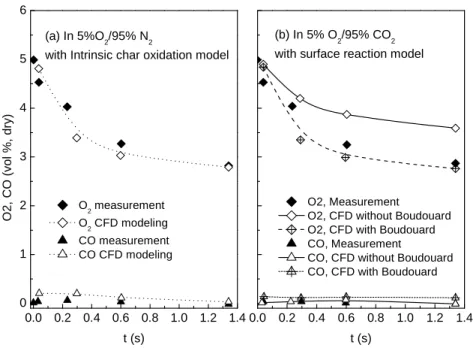
conditions, respectively. ... 81 Figure 2-6. Measured and calculated species volume fractions for the lignite-char burning with a wall
temperature of 1300 °C. (a) CFD predictions using intrinsic char oxidation model under 95% N2 and 5% O2 condition. (b) CFD predictions using surface reaction model under 95% CO2
and 5%O2 conditions [161]. ... 84
Figure 3-1. The geometry of (a) RWTH Aachen University 100 kWth test facility and (b) swirl burner, in
meter. The mass flow rate, composition and temperature of the burner streams are summarized in Table 3-1... 95 Figure 3-2. The three-dimensional mesh for Aachen’ 100 kWth oxyfuel combustion test facility. Figure
shows only the part in the vicinity of the burner. ... 96 Figure 3-3. The particle size distribution of the coal used in experiment and CFD simulations. ... 97 Figure 3-4. Comparison between the measured (scatters) and predicted (lines) velocity profiles at 0.025,
0.05, 0.2 and 0.3 m away from the burner outlet. (a) Axial velocity, and (b) tangential velocity. ... 111 Figure 3-5. Comparison between the measured (scatters) and predicted (lines) gas phase mass flow rate
and angular momentum along the axis: (a) mass flow rate in (kg/s), and (b) angular momentum in (kgm2/s2). The error bar with the LES results shows the velocity and density
covariance term in mass flow rate calculation... 112 Figure 3-6. The predicted velocity distribution in the burner quarl using uniform vector length, colored by
axial velocity. The results from (a) Standard k model, (b) RNG k k
model (c) SST
k
model, and (d) LES mean values, show different internal recirculation zone sizes and peak reverse velocity. ... 114 Figure 3-7. RANS and LES predicted velocity (scaled vector) and oxygen concentration (colored contour)
distribution in the near-burner region, showing the mixing between the staging stream and the burner streams. The figures show the results from (a) Standard model, (b) SST k
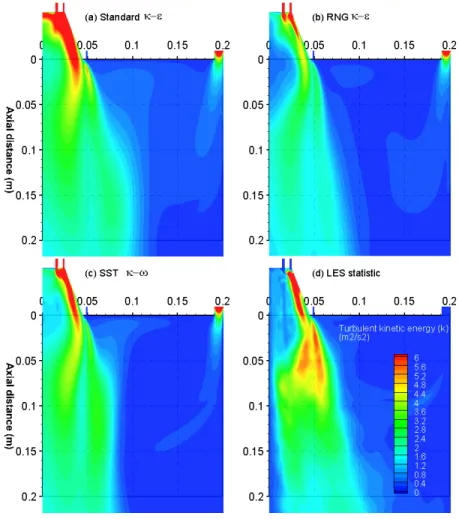
model, (c) LES in an instantaneous moment, and (d) LES mean values. Note that the LES instantaneous velocity vector scale is different from others because the instantaneous velocity magnitudes are larger than the mean values... 116 Figure 3-8. The predicted turbulent kinetic energy in the near-burner region. The figures show the
results from (a) Standard
k
k model, (b) RNG k model, (c) SST k model, and (d) LES statistic values. ... 118 Figure 3-9. Comparison between the measured (scatters) and predicted (lines) oxygen mole fraction (left) and gas temperature (right) at 0.05, 0.1, 0.2, 0.3 and 0.5 m away from the burner. The error bar of the experimental results indicates two standard deviations... 119
k
Figure 3-10. The predicted temperature distributions using RANS and LES. (a) Standard
k
model, (b) SST
k
model, (c) LES in an instantaneous moment, and (d) LES mean values. ... 121 Figure 3-11. The LES instantaneous results, showing the flame stabilization mechanism in the burner
quarl. (a) Gas temperature is shown using colored contour, and velocity is shown using uniform length vector, (b) coal particle moisture evaporation rate, (c) coal particle
devolatilization rate, (d) volatiles mole fraction, (e) O2 mole fraction, and (f) volatiles burning
rate in the quarl structure... 123 Figure 3-12. Predicted char consumption rate by oxidation and gasification reactions, and the gasification reaction’s contribution. (a) SST model, (b) LES in an instantaneous moment. ... 125 Figure 3-13. Comparison between the measured (scatters) and CFD predicted (lines) particle temperature
at 50 and 200 mm away from the burner. ... 127 Figure 4-1. Schematic of three diffusion flames in the present study: (a) A counter flow laminar diffusion
flame, (b) a jet flow turbulent partial premixed flame, and (c) a swirling flow turbulent diffusion flame... 132 Figure 4-2. The CO mole fraction at thermodynamic equilibrium in CH4/O2/N2 and CH4/O2/CO2 systems
as a function of temperature and stoichiometry... 143 Figure 4-3. Counter flow diffusion flame structures in (a) air-fired and (b) oxy-fuel combustion under a
strain rate of 60 s-1. Results are predicted using GRI-mech 3.0 detailed mechanism. Note that CO and H2 mole fractions are enlarged 5 times in the figure. ... 144
Figure 4-4. CO rate of production due to reactions (R.99), (R.167), (R.132), and (R.153) under (a) air-fired and (b) oxy-fuel conditions. Results are predicted using GRI-mech 3.0 detailed
mechanism, and the strain rate is 60 s-1. ... 145 Figure 4-5. H2 and CO rate of production due to reactions (R.84) and (R.99) under (a) air-fired and (b)
oxy-fuel conditions. Results are predicted using GRI-mech 3.0 detailed mechanism, and the strain rate is 60 s-1... 146
Figure 4-6. Comparison of the predicted CO mole fractions in 1D counter flow diffusion flame using GRI-mech 3.0, WDmult and WD2 mechanisms under (a) air-fired and (b) oxy-fuel conditions. The strain rate is 60 s-1... 147
Figure 4-7. Comparison of the predicted temperature distribution in jet flow partial premixed flames (Sandia Flame D) using skeletal, WDmult, WD2 mechanisms, as well as the infinite fast chemistry model under air-fired (left) and oxy-fuel (right) conditions. ... 149 Figure 4-8. Comparison of the predicted CO mole fraction distribution in jet flow partial premixed flames
(Sandia Flame D) using skeletal, WDmult, WD2 mechanisms, as well as the infinite fast chemistry model under air-fired (left) and oxy-fuel (right) conditions. ... 150
Figure 4-9. Comparison of the measured (scatters) and predicted (lines) axial profiles of temperature, CH4,
O2, CO and H2 mass fractions in the Sandia Flame D using skeletal, WDmult, WD2
mechanisms, as well as the infinite fast chemistry model under (a) air-fired and (b) oxy-fuel conditions. Results are shown as function of normalized axial distance (x/D) with a jet flow diameter D=7.2 mm... 152 Figure 4-10. Comparison of the measured (scatters) and predicted (lines) radial profiles of CO mass
fraction in the Sandia Flame D using skeletal, WDmult, WD2 mechanisms, as well as the infinite fast chemistry model under (a) air-fired and (b) oxy-fuel conditions. Results are shown as function of normalized radial distance (r/D) with a jet flow diameter D=7.2 mm... 153 Figure 4-11. Comparison between the measured (scatters) and predicted (lines) radial temperature in (a)
air-fired, and (b) oxy-fuel combustion. Simulation results were obtained using different gas phase reaction models and reaction mechanisms. Infinite-fast represents EDM with infinite fast chemistry). ... 154 Figure 4-12. Comparison between the measured (scatters) and predicted (lines) oxygen mole fractions
(dry basis) at 0.215 and 0.384 m away from the burner in (a) air-fired, and (b) oxy-fuel combustion. ... 156 Figure 4-13. Comparison between the measured (scatters) and predicted (lines) CO mole fractions (dry
basis) at 0.215 and 0.384 m away from the burner in (a) air-fired, and (b) oxy-fuel
combustion. ... 156 Figure 4-14. Comparison between air-fired (left) and oxy-fuel (right) combustion: (a) the oxygen mole
fractions and the carbon monoxide mole fraction shown in isoline and gray contour,
respectively; and (b) the reaction rate of shown in color contour in the vicinity of the swirl burner. The velocity field is shown using uniform vectors. Results are obtained using the WDmult reaction mechanism... 158
2
OH+COH+CO
2
OH+COH+CO
Figure 4-15. Comparison of the flame structures at x=0.05 m away from the burner in (a) air-fired and (b) oxy-fuel swirling flow diffusion flames. Figures show the predicted profiles of species mole fractions and rates of the reaction . Results are obtained using the WDmult reaction mechanism. ... 159 Figure 5-1. Geometry of the pressurized CWS oxy-fuel combustor. The center X-Y plane and vertical
traverse lines are highlighted in this figure, showing the cross section where contours and velocity fields are plotted. ... 165 Figure 5-2. Schematic diagram of the swirl burner and coal water slurry effervescent atomizer... 165 Figure 5-3. Gas velocity vector field in the combustor: (a) central cross section in XY plane. (b) central
cross section in XZ plane. ... 173 Figure 5-4. Gas velocity vector field in vicinity of the burner. Vectors of uniform length show the flow
directions, and background color show the magnitude of the axial velocity (Vx)... 173
Figure 5-5. Axial (a) and tangential (b) gas velocity profiles of traverses at different axial locations. .... 174 Figure 5-6. Net and recirculated gas phase mass and enthalpy flow rate of the YZ cross-sections at
different axial locations. ... 175 Figure 5-7. Gas temperature distribution in the central XY and YZ cross-sections in the combustor... 176 Figure 5-8. Distribution of mass fractions for gaseous species: volatile, H2, CO, O2, CO2, and H2O in the
central X-Y cross-section. Figures only show axial range of 0-3.3 m where combustion reactions take place... 178 Figure 5-9. Trajectories of sampled coal water slurry droplets (100um) in the reactor. Color shows the
particle temperature (K). ... 179 Figure 5-10. Axial velocity decay of sampled coal water slurry droplets with different initial diameters. 3
samples were presented in the figure for each diameter... 180 Figure 5-11. Mass and temperature histories of sampled CWS droplets in different sizes show the
evaporation, devolatilization, and char burning time scales... 181 Figure 5-12. Statistic of the time for evaporation, devolatilization, and 95% carbon conversion of the coal particle, as a function of the CWS droplet size. ... 182 Figure 5-13. Average residence time of CWS droplets as a function of the droplet size... 182 Figure 5-14. Comparison of the axial velocity (m/s) distributions among cases with low/median/high
velocity under 20 bar and 40 bar operating pressures. ... 184 Figure 5-15. Comparison of the temperature (K) distributions among cases with low/median/high velocity under 20 bar and 40 bar operating pressures. ... 184 Figure 5-16. Comparison of the char oxidation (C+O2) rate distribution among cases with
low/median/high velocity under 20 bar and 40 bar operating pressures. ... 186 Figure 5-17. Comparison of the char gasification (C+CO2) rate distribution among cases with
low/median/high velocity under 20 bar and 40 bar operating pressures. ... 186 Figure 5-18. Comparison of the char surface reaction rates at 4 bar, 20 bar, and 40 bar operating pressures
with 10% O2, 40% CO2 and 40% H2O (by vol.). Results indicate that the oxidation reaction
(C+O2) becomes diffusion controlled at high temperatures, in particular at elevated pressure.
Gasification reactions are kinetics controlled within the ISOTHERM reactor, and the reaction rates are times higher at 20 bar and 40 bar than the reference case... 187 Figure 5-19. Char consumption rate due to the oxidation and gasification reactions in the investigated
Figure 5-20. Statistics of water evaporation time as a function of droplet diameter in 4 bar, 20 bar, and 40 bar operating pressures with identical median burner velocity (~20 m/s). Results are the average and standard deviation values calculated using 300 droplet particle trajectories in the reactor. ... 189 Figure 5-21. Statistics of 95% char conversion time as a function of droplet diameter in 4 bar, 20 bar, and
40 bar operating pressures with identical median burner velocity (~20 m/s). Results are the average and standard deviation values calculated using 300 char particle trajectories in the reactor. ... 189 Figure 5-22. Statistic results of particle residence time in the oxy-combustor under different operating
conditions. ... 191 Figure 5-23. Comparison of the total heat loss rate (MW) through the refractory wall under an operating
pressure of 4 bar, 20 bar, and 40 bar with identical median burner velocity (~20 m/s). ... 192 Figure 5-24. Molten slag thickness (m) under an operating pressure of 4 bar, 20 bar, and 40 bar, with
identical median burner velocity (~20 m/s)... 193 Figure 5-25. Molten slag flow velocity (m/s) under the same operating conditions above... 193 Figure 5-26. Ash that captured on the side refractory wall in the form of molten slag over the total ash
mass flow rate under an operating pressure of 4 bar, 20 bar, and 40 bar, with identical median burner velocity (~20 m/s). ... 194 Figure 6-1. The slagging behaviors in the 5 MWth oxy-coal reactor, pictures were taken from the end of
the reactor during shut-down period. (a) shows the frozen slag on the ceiling of the reactor, and (b) shows the slag on the side and bottom wall of the reactor. ... 200 Figure 6-2. A schematic diagram of the slag flow on refractory wall, with steel wall and water cooling
outside. Figure is cited and modified from reference [221]. Red color arrows and curves show the heat transfer process, and dark blue arrows indicate mass transfer process. ... 200 Figure 6-3. The geometry and three-dimensional mesh of the 5 MWth oxy-coal test unit. The axial
velocity contour is shown in a XY cross section, and the slag volume fraction distributions were emphasized with the refined mesh in the near-wall region at the bottom and the back wall of the reactor. ... 203 Figure 6-4. The algorithm of the slag model integration in the 3-D CFD framework... 211 Figure 6-5. The slag buildup along with time in the transient calculation. Figure shows the slag volume
fraction on the first layer of the mesh near the wall at time 0-5h... 212 Figure 6-6. Char/Ash particle deposition flux (kg/m2s) in each of the wall finite face, (a) without and (b)
with the particle dispersion model... 214 Figure 6-7. The ash capture efficiency on the reactor walls (including the front wall, back wall, and side
wall), without and with the particle dispersion model... 215 Figure 6-8. The slag volume fraction on the first layer of the mesh near the wall, (a) without and (b) with
the particle dispersion model... 216 Figure 6-9. (a) The molten slag thickness (m), and (b) the slag surface flow velocity (m/s) in a steady state
condition... 217 Figure 6-10. The slag thickness distribution at x=4 m, with local slag volume fraction distribution on the
top, side and bottom of the reactor wall. The mesh is also shown with the results... 218 Figure 6-11. The slag volume fraction, temperature, viscosity and velocity distribution at the bottom of
the reactor wall at x=4 m. The vector in the velocity distribution shows only the flow direction, and the velocity magnitude is shown in color... 218 Figure 6-12. Coal throughput effect on the slagging behavior. (a) 4 bar 3MWth case, and (b) 40 bar 60
List of Tables
Table 1-1. Representative performance and economics data for the three main capture technologies, from
[14]. ... 24
Table 1-2. List of ongoing and proposed large scale oxy-coal combustion demonstration projects, modified from Wall et al. [23], the CCS project database of MIT Energy Initiative [30] with current updates of these projects. ... 28
Table 1-3. Comparison of selected physical properties of CO2 and N2 at 1 atm and 1000 K. Data are cited from [58-61]. ... 36
Table 1-4. Bench and pilot scale experimental studies on gas temperature and heat transfer in atmospheric oxy-coal combustion. ... 45
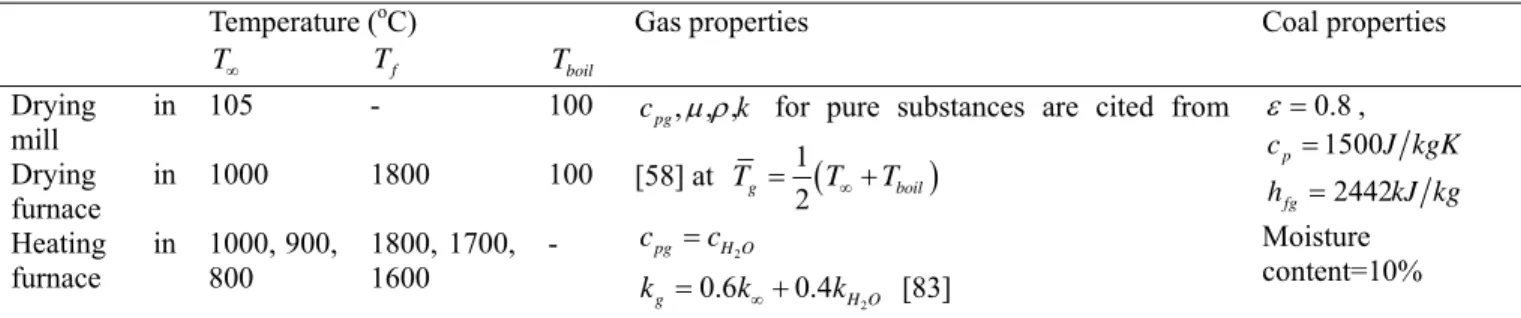
Table 1-5. Parameters used in estimation of the heating and drying processes of single coal particle... 49
Table 1-6. Lab/Bench scale experiments on coal devolatilization in atmospheric N2 and CO2 environments. ... 52
Table 2-1. Summary of CFD simulations and their sub-models for oxy-fuel combustion. ... 68
Table 3-1. The operating conditions of the oxy-coal combustion experiment at RWTH Aachen University. ... 97
Table 3-2. The proximate and ultimate analysis of the Rhenish lignite used in the experiments. ... 97
Table 3-3. The kinetics parameters and diffusion coefficients for the oxy-char surface reactions. ... 106
Table 3-4. The coefficients used in the three gray-one clear gases WSGG model for oxy-fuel combustion, adapted from reference [154]. ... 109
Table 4-1. The operating conditions of the Sandia Flame D under air-fired and oxy-fuel conditions [197, 198]... 133
Table 4-2. The operating conditions of the propane combustion experiment under air-fired and oxy-fuel conditions. ... 135
Table 4-3. A summary of the mechanisms tested in this study... 139
Table 4-4. The reduced, quasi-global, and global reaction mechanisms used for CH4 and C3H8 combustion under air- and oxy-fuel conditions (Units are in m-sec-kmol-J-K). ... 141
Table 5-1. Coal properties used in this study. ... 165
Table 5-2. Operating conditions of the oxy-coal burner and atomizer... 166
Table 5-3. Parameters of the refractory wall and cooling system of ISOTHERM combustor... 166
Table 5-4. Operating conditions of the burner and atomizer under elevated pressures ... 168
Table 6-1. Coal properties used in this study. ... 210 Table 6-2. Oxide composition of the coal ash... 210 Table 6-3. Physical properties of the coal slag... 210
Chapter 1
Introduction to Oxy-Coal Combustion
1.1. Carbon Capture Technologies for Coal-fired Power Plants
Reliable, affordable and clean energy supply is one of the basic needs of humankind. Today, our energy supply system is undergoing a long-term transition from its conventional form to a more sustainable and low carbon style, especially addressing greenhouse gas (water, carbon dioxide, methane, nitrous oxide, chlorofluorocarbons and aerosols) emissions into the atmosphere. Strong evidence suggests that both the average global temperature and the atmospheric CO2 concentration have significantly increased since the onset of the industrial
evolution, and they are well correlated [1]. Concerns over climate change have led to mounting efforts on developing technologies to reduce carbon dioxide emissions from human activities [2, 3]. Technological solutions to this problem ought to include a substantial improvement in energy conversion and utilization efficiencies, carbon capture and sequestration (CCS), and expanding the use of nuclear energy and renewable sources such as biomass, hydro-, solar, wind and geothermal energy [2].
Coal has been and will continue to be one of the major energy resources in the long term because of its abundant reserves and competitively low prices, especially for the use of base-load power generation. For instance, the share of coal in world energy consumption was 29.4% in 2009, as opposed to 34.8% for oil and 23.8% for natural gas [4]. In terms of power generation, coal continues to be the dominant fuel, contributing about 45% of the total electricity in the US in 2009 [5], and about 80% in China. Several technologies have been proposed for reducing CO2
emission from coal-fired power generation, namely post-combustion capture, pre-combustion capture and oxy-fuel combustion capture [6]:
Pre-combustion capture: Fuel is either gasified or reformed to syngas, a mixture of carbon monoxide and hydrogen, which is then shifted via steam reforming. CO2 is then separated
from the syngas by shifting carbon monoxide with steam, yielding pure hydrogen (water gas shift reaction). The Integrated Gasification Combined Cycles (IGCC) for coal is an example of pre-combustion capture system.
Post-combustion capture: CO2 is separated from the flue gases using chemical solvents [7],
sorbents (such as calcium oxide [8] or carbon fibers [9]) and membranes [10] without changing the combustion process. However, the addition of a post-combustion capture unit may change the steam cycle because large quantity of low pressure steam must be extracted from the steam cycle for the solvent regeneration process.
Oxy-fuel combustion: Instead of using air as oxidizer, pure oxygen (O2) or a mixture of O2
and recycled flue gas is used to generate high CO2 concentration product gas; therefore, the
combustion process is significantly changed. Chemical-Looping Combustion (CLC) is another combustion process that belongs to the oxy-fuel combustion category, in which pure oxygen rather than air is supplied by metal oxides for combustion, such that the mixing between CO2 and N2 is inherently avoided. This technology is not the primary focus of this
paper, and, the reader is referred to [11-13] for more details on CLC.
In general, the technologies described above can be applied to generate energy from natural gas and coal with the exemption of some low rank coals due to unresolved engineering challenges, however, because of the important role of pulverized coal in base load electricity generation and its contribution to CO2 emission, this study is primarily concerned with the
Table 1-1. Representative performance and economics data for the three main capture technologies, from [14].
Supercritical PCa SCb PC-Oxyfuel IGCCc
Performance
w/o capture w/ capture w/ capture w/o capture w/ capture
Generating efficiency 38.5% 29.3% 30.6% 38.4% 31.2%
Efficiency penalty CO2 recovery (heat): -5% Boiler/FGD: 3% Water/Gas shift: -4.2%
CO2 compression: -3.5% ASU: -6.4% CO2 compression: -2.1%
CO2 recovery (power): -0.7% CO2 compression: -3.5% CO2 recovery: -0.9%
Other: -1%
Capital Cost ($/kWe)e 1330 2140 (1314)d 1900 (867)d 1430 1890
COE (c/kWh)e 4.78 7.69 6.98 5.13 6.52
Cost of CO2 ($/t)e 40.4 30.3 24.0
a PC: pulverized coal; b SC: supercritical; c IGCC: Integrated gasification combined cycle; d Figures in parenthesis
are the expected capital cost for retrofits; e Based on design studies done between 2000 & 2004, a period of cost
stability, updated to 2005$ using CPI inflation rate.
These three major carbon capture technologies for coal-fired power plants have been studied in terms of power generation efficiency, capital costs and costs of electricity (COE) [14-16]. Representative energy efficiency and economic performance of these technology options are compared in Table 1-1. All of these estimates are based on 90% CO2 capture in rebuilt and
retrofitted scenarios. The cost of CO2 indicates the cost that is incurred to capture 1 metric ton
carbon dioxide without transportation and storage. Although the absolute numbers vary by few percentage points in these studies, all reports show the same trends. In general, all three capture technologies result in an efficiency penalty, while oxy-fuel capture and pre- capture or IGCC show advantages over post-combustion capture in terms of COE and cost of CO2. The IGCC
technology yields a higher generation efficiency and a slightly lower cost than oxy-fuel combustion technology. However, all these technologies are in their early stages of development
and still have great potential for improvement.
In particular, these studies have a common conclusion that oxy-fuel combustion is the most competitive technology option for retrofitting existing coal-fired power plants, which at the moment have the largest potential for CCS. Although the number of newly-built coal power generation units declined since 1990s’, there is a resurgence of new coal power plants in recent years. Moreover, about 98.7 GW or 29% of all the existing coal-fired power capacity were built after 1980 [17]. This situation is even more prominent in developing countries such as China and India, where the coal power generation capacity has been booming in the last two decades. It can safely be assumed that a sizable reduction of CO2 emission from existing plants would come
from retrofits. Oxy-fuel combustion systems have a natural advantage in retrofitting existing PC power plants because they can reuse most of the existing plant equipment. The advantages of oxy-fuel combustion as a retrofit technology are also indicated in Table 1-1. The capital cost for
supercritical PC retrofits with oxy-fuel is $867/kWe, which is significantly lower than the capital cost of post-combustion retrofit ($1314/kWe) and of newly-built IGCC plants ($1890/kWe).
Considering the advantages of a relatively moderate efficiency penalty and the lowest retrofit capital expenditure, atmospheric oxy-fuel combustion systems have been widely accepted as a competitive carbon capture technology. More recently, it has been adopted to substitute the original IGCC plan in the U.S. DOE FutureGen 2.0 program [18]. Previous studies have reviewed its fundamentals and characteristics [6, 19-22], as well as recent developments in pilot-scale and commercial-scale demonstration plants [23]. While successful, the technology still faces many challenges, such as air leakage into the flue gas system, the relatively low energy efficiency, the need for efficient air separation and better plant integration and flue gas cleanup, among others. In particular, significant challenges are expected in the combustion process itself,
including stability and emissions, burner design and scaling, as well as determining of optimal operating conditions.
1.2. Oxy-Fuel Combustion for CCS
1.2.1. Development of the Oxy-Fuel Technology for CCS
The idea of applying oxy-fuel processes with flue gas recycle in coal-fired plants to control the CO2 emission [24, 25] and/or produce high concentration CO2 for enhanced oil recovery
(EOR) was first proposed in 1982 [24, 26]. Following these proposals, Argonne National Laboratory (ANL) pioneered the investigation of this process in the mid and late 1980s, focusing on the system and its combustion characteristics [27-29]. Soon after, more and more researchers agreed that this system complements the two other major approaches for carbon dioxide capture, which led to a renewed interest in this technology in the 1990s. Research conducted by the International Flame Research Foundation (IFRF), CANMET, IHI, as well as other institutes and industrial parties has made considerable contributions in understanding of this process.
Along with the research and development on the air-like oxy-coal technology, pilot and large scale demonstration plants are being built around the world. Wall et al. [23] surveyed research on oxy-fuel technology, from pilot-scale tests, to industry-scale tests and full-scale demonstrations, and compiled the historical development of this technology worldwide. The year 2008 marks an important milestone with the commissioning of the world’s first 30 MWth demonstration plant in Germany. More large-scale demonstrations in industry-scale coal-fired boilers have been planned or are already underway, as shown in Table 1-2 based on the work of Wall et al. [23] and Herzog [30]. Success in these demonstrations is expected to lead to wider commercial deployment.
Recent research has also focused on extending the range of operating conditions of oxy-coal combustion to improve energy efficiency, environmental performance and economics of this technology. For instance, pressurized systems have been proposed for both oxy-coal combustion with recycled flue gases [31-36] and oxy-syngas combustion in combination with solid fuel gasification technology [37]. These approaches are described in greater detail in the following sections.
1.2.2. Atmospheric Oxy-Coal Combustion Systems with Flue Gas Recycle
The atmospheric oxy-coal combustion system shown in Figure 1-1 was first introduced as a short-term solution to retrofit existing coal-fired power plant to include the option of CCS. In most oxy-coal system studies, recycled flue gases at various recycle ratios are used to control the flame temperature in the combustor and as a result, the flue gas consists primarily of steam which is later removed through condensation, and carbon dioxide which is purified before being sent for compression and sequestration. The additional equipment required, when compared with air-fired systems, is described below:
Figure 1-1. Atmospheric oxy-coal combustion system with flue gas recycle proposed for carbon ca pture in coal power plants, figures are revised based on the work in [19-21].
Table 1-2. List of ongoing and proposed large scale oxy-coal combustion demonstration projects, modified from Wall et al. [23], the CCS project database of MIT Energy Initiative [30] with current updates of these projects.
Project name Leader Location Scale Technology MWe New/ Retrofit PowerGen CO2
Seq Start-up
Jupiter Pearl Plant Jupiter USA Pilot 22(MWth) R N NAc 2007
B&W pilot plant B&W USA Pilot PCa 30(MWth) R N N 2008
OxyCoal-UK Doosan Babcock UK Pilot PCa 40(MWth) R N N 2009
Alstom Windsor Facility Alstom USA Pilot PCa 15(MWth) R N N 2009
Schwarze Pumpe Vattenfall Germany Pilot PCa 10 N N Seq
d 2008
Callide-A CS Energy, IHI etc. Australia Pilot PCa 30 R Y Seq
d 2011
Compostilla (OXY-CFB-300)
Phase I
ENDESA, CIUDEN and Foster
Wheeler Spain Pilot CFB
b 17 N Y Seq
d 2011-2012
Jamestown Jamestown BPU USA Demo CFB 43 N N Seq
d 2013
Janschwalde Vattenfall Germany Demo PCa 250 N Y Seq
d 2015
FutureGen FutureGen Alliance USA Demo PCa 200 R Y Seq
d 2015
Compostilla (OXY-CFB-300)
Phase II
ENDESA, CIUDEN and Foster
Wheeler Spain Demo CFB
b 300 N Y Seq
d 2015
Youngdong KEPCO S. Korea Demo PCa 100 R Y Seq
d 2016
Black Hills Power Black Hills Corporation USA Demo PCa 100 N Y NAc 2016
Air Separation Unit (ASU): When retrofitting existing PC power plants, the system primarily uses existing equipment with the exception of an ASU used to produce an oxygen rich stream for combustion. Currently, the only ASU technology that can meet the volume and purity demand of a large scale coal-fired utility boiler is based on cryogenic distillation. Air is compressed, cooled and cleaned prior to being introduced into the distillation column to separate air into an oxygen-rich stream and a nitrogen-rich stream. Cryogenic air separation is energy intensive, consuming about 0.24 kWh/kg O2 with 95% oxygen purity
[15, 38]. Although the oxygen purity requirement for oxy-coal combustion (85~98%) is lower than that needed in the process industry (99.5~99.6%) [39], these cryogenic separation processes can consume more than 15% of the gross power output [15, 40-42]. Carbon Dioxide Purification Unit (CPU): CPU consists of gas cleanup units to remove water, particulate matter and other pollutant gases from the flue gas before being compressed for sequestration. Because oxy-combustion is compatible with retrofits, selective catalytic reduction (SCR), electrostatic precipitator (ESP) and flue gas desulphurization (FGD) are typically retained as means of NOx, particulate matter and SOx
removal from the flue gases. This method is also suitable for use in conjunction with amine-type absorbents for post-combustion capture plants.
It has been widely accepted that the non-condensable impurities, such as O2, may cause
corrosion in the pipeline during transportation, and this has raised doubts about the safety of the storage sites. Therefore, after the removal of acid gases such as SOx and NOx,
non-condensable N2, O2, and Ar should also be purged using a non-condensable gas purification
separate out the inert gases. Up to the time of this review, there are still no agreed upon standards regarding the required purity of CO2 for storage and sequestration. However, it
should be noted that the acceptable degree of purity of the storage-ready CO2 results from a
trade-off between efficiency losses and operational costs during purification and the safety demands of transportation and storage. For a detailed discussion of this topic, the reader is referred to [19].
Flue Gas Recycle (FGR) System: Recycled flue gas is required to moderate the combustion temperature. Considering system efficiency and operation practices, flue gases can be recycled at different locations downstream of the economizer in the form of wet or dry recycles. In the early stages of oxy-coal system studies, the requirement on CO2 purity was
not stringent and the desulfurization and de-NOx equipment were regarded as unnecessary
[43, 44]. Therefore, all the flue gas was proposed to be extracted from a single location downstream of the ESP in wet or dry forms [43]. Later on, Dillon et al. [44] proposed flue gas recycling at different locations for the primary (used for transporting coal) and secondary streams for the sake of energy efficiency: while the primary recycle has to be dried and reheated to 250-300 oC to take up moisture from the coal feed, the secondary stream can be recycled at higher temperatures without drying to eliminate thermodynamic losses caused by cooling and re-heating [44].
Today, with a stricter requirement on CO2 purity for pipeline transportation and
storage, pollution control equipment have been again taken into account in the flue gas recycle configurations. Moreover, since SO2 concentration in the flue gas may accumulate
air-firing systems, the primary recycle has to be at least partially desulphurized for medium and high sulphur coal, to avid corrosion in the coal mill and flue gas pipes.
Figure 1-2. Pressurized oxy-coal combustion systems proposed for carbon capture in coal power plants, figures are revised based on the work in [35, 36, 45, 46]. (a) Schematic of the ThermoEnergy Integrated Power System (TIPS), (b) System proposed by ENEL based on a combustion process patented by ITEA, and analyzed in recent studies by MIT.
1.2.3. Pressurized Oxy-Coal Combustion Systems
Pressurized oxy-fuel combustion systems have been proposed recently, with the objective of improving the energy efficiency by recovering the latent heat of steam in the flue gas. The flue gas volume is reduced under elevated pressure, which results in smaller
components and possible reductions in capital cost for the same power output. Several studies have reported on the technical and economic feasibility of this process [31-36, 47, 48], all concluding that the overall process efficiency improves with increasing operating pressure. This is mainly because latent heat recovery from the flue gases becomes possible at higher temperatures. Other potential advantages of pressurized oxy-fuel systems are the reduction of the auxiliary power consumption such as the recycle fan work, and the elimination of air ingress into the system. However, there are challenges associated with combustion and heat transfer characteristics at elevated pressures, and hence the burners, steam/gas heat exchangers and condensing heat exchangers must be redesigned [49].
Figure 1-2 illustrates two different pressurized oxy-coal combustion systems proposed in the literature. One of the first designs is the ThermoEnergy Integrated Power System (TIPS) proposed and studied by CANMET [31, 45] and Babcock power [36]. This system (Figure 1-2a) uses a pressurized combustion unit and heat exchangers, as well as a flue gas condenser (FGC). Downstream of the radiative boiler and convective heat exchangers, steam in the flue gases is condensed in the FGC, where most of the latent heat in the flue gas is recovered by the feedwater in the steam cycle. The rest of the flue gas, which is essentially CO2, is purified and compressed to the sequestration specifications. In contrast,
in the pressurized system proposed by ENEL based on a combustion process patented by ITEA [50-52], and analyzed by MIT (Figure 1-2b) [34, 35], the hot flue gases from the pressurized combustor is quenched to about 800 ºC by the recycled cold flue gas, eliminating the need for a radiant heat exchanger and thus incurring a lower capital cost. It should be noted that in these pressurized oxy-coal systems coal is fed in the form of
coal-water slurry (CWS). Since the pressurized system takes advantage of the latent heat recovery from the steam in the flue gas, using a coal-water slurry does not significantly decrease the overall energy efficiency.
For the pressurized oxy-fuel power plants with CO2 enriched flue gas streams,
desulphurization and NOx removal solutions have been proposed with potentially lower
cost and higher energy efficiency, using lead chamber chemistry and nitric acid chemistry at elevated pressures. For instance, Air Products [53, 54] proposed utilizing two high pressure countercurrent reactive absorption columns (see Figure 1-2 (b)) while Iloeje et al. [55] combines them into a single high pressure column to remove SOx as H2SO4 and NOx
as HNO3. Both solutions claim to have significantly reduced the cost of CO2 purification
with the latter having an advantage in terms of reduced power consumption and capital cost. 1.2.4. Energy Efficiency Performance of the Oxy-Coal Combustion Systems
An important question to address at this juncture is the comparative performance of the atmospheric and pressurized oxy-fuel combustion systems described above. Figure 1-3 shows the capital expenditure ($/kWe) and efficiency (HHV%) of these systems for newly-built power plants, compared to the performance of supercritical pulverized coal systems without capture and with post-combustion capture. Data are summarized from independent studies carried out by NETL [15], MIT [14, 34, 35], CANMET [45, 56], ThermoEnergy [32, 46, 57], and Kanniche et al [16]. It is noteworthy that estimates in the open literature vary according to their assumptions and approximations. For instance, fuel type, size and configuration of the power plants, percentage of CO2 captured, and parameters of the steam
studies are averaged in Figure 1-3, with the minimum and maximum values shown as error bars; and they should only be compared qualitatively.
PC Post A-Oxyf P-Oxyf
0 1000 2000 3000 4000 5000 6000 7000 8000 Capital cost Generating efficiency Capital cost ($/kW e)
PC Post A-Oxyf P-Oxyf 0
10 20 30 40
Generating efficiency (%)
Figure 1-3. Comparison of plant generating efficiency and capital expenditure [14-16, 34, 46, 56, 57] of CO2 capture technologies. PC: conventional PC system without capture, Post: PC with post capture,
A-Oxyf: atmospheric oxy-coal with flue gas recycle, P-A-Oxyf: pressurized oxy-coal with flue gas recycle.
System efficiency estimates showed a loss of about 10-15% percentage points when post-combustion capture is added to the base case PC power plant. On the other hand, the atmospheric oxy-fuel combustion shows an advantage of 1-5 percentage points when compared with post-combustion capture; while the pressurized system gains a further 3 percentage points efficiency. The main advantage of pressurized oxy-fuel system is the higher saturation temperature of water at elevated pressures, which enables more thermal
energy recovery and the recuperation of latent enthalpy, as stated previously. Although the power consumption of the ASU is higher in the pressurized combustion system, the power savings in the CO2 compression unit and in the recycled flue gas compressor is even higher,
culminating in a better overall efficiency [34].
There are significant variations in capital costs estimates in these studies due to inflation since 2004. The MIT study [14] showed lower cost estimates for the PC without capture, post-combustion, and atmospheric oxy-fuel systems, because it was based on the cost of 2000-2004; while Pomalis et al. [56] estimated higher costs. The economic studies may only be viewed as relatively comparable values, but not absolute values before they are evaluated from commercial scale deployments, especially for the pressurized oxyfuel systems. It should be noted that these data are for newly-built power plants, in fact, the capital cost estimates for retrofitted atmospheric oxy-coal power plants are significantly lower than any of these options as discussed in section 1.1.
1.3. Fundamentals of Oxy-Fuel Combustion
This section reviews the thermodynamics, transport and chemistry processes that take place during oxy-fuel combustion of coal [22]. Experimental and numerical studies of single coal particles or a group of coal particles are reviewed with emphasis on the impact of a CO2-rich environment. We start with a discussion on the heat transfer characteristics in
oxy-fuel combustion and how to match the heat flux with that in the conventional air-fuel combustion, followed by a description of the stages and processes that a coal particle undergoes as it is entrained into the furnace: transportation, heating and moisture
evaporation, devolatilization, ignition and burning of the volatile matter, flame propagation, char combustion, and the CO2’s chemical effects on gas reactions. The physical properties
of N2 and CO2 relevant to oxy-fuel combustion are summarized in Table 1-3. The effects of
these properties will be discussed in greater detail in each of the following sub-sections.
Table 1-3. Comparison of selected physical properties of CO2 and N2 at 1 atm and 1000 K. Data are cited from [58-61].
Physical process Physical property Unit CO2 N2 CO2/N2
Thermodynamic Density kg m 3 0.5362 0.3413 1.57
Specific heat capacity kJ kgK 1.2343 1.1674 1.06
Volumetric heat capacity kJ m K 3 0.662 0.398 1.66
Gas-water interfacial tensiona N m 71.03 71.98 0.987
Momentum transfer Kinematic viscosity m s 2 7.69e-5 1.2e-4 0.631
Heat transfer Thermal conductivity W mK 7.057e-2 6.599e-2 1.07
Thermal diffusivity m s 2 1.1e-4 1.7e-4 0.644
Absorptivity /emissivity 0.1478 ~0 -
Mass transfer Mass diffusivityb 2
m s 9.8e-5 1.3e-4 0.778
a Water gas interfacial tensions are evaluated for CO
2/water and air/water interfaces at 298.15 K. b Mass diffusivity refers to the binary diffusion of O
2 in CO2 and nitrogen.
1.3.1. Heat Transfer
Extensive studies have been conducted on retrofitting existing coal-fired power plants for oxy-fuel combustion. Most studies agree that the first priority in the retrofit effort is to maintain the same heat transfer characteristics in the furnace as in air-fired combustion. Matching the heat transfer in the furnace can lead to combustion stability, carbon burnout, and slagging and fouling tendencies [29].
1.3.1.1. Radiation Heat Transfer
Radiative heat transfer plays an important role in boilers and furnaces. The characteristics of radiative heat transfer in oxy-combustion are distinct from conventional air-coal combustion because the flue gas compositions are different. A simplified scaling analysis can be used to estimate the radiative heat transfer rate from an oxy-fuel combustion flame. The entire flame is considered to be a uniform source of radiation, and its total radiative energy release rate can be approximated as:
4
rad f f
q A T (1.1)
where is the average emissivity for the flame, and Af and Tf are the flame surface
and temperature, respectively. The flame temperature is the overwhelming factor because of its 4th order dependence [62]. Therefore, to match the radiative heat flux between air and oxy combustion, one must achieve gas temperatures in the latter that are close to those found in the former.
On the other hand, for the same flame temperature, radiation heat transfer is enhanced when the emissivity is higher. Unlike symmetric diatomic gases such as N2, triatomic gases
such as CO2 and H2O are not transparent to radiation. Their partial pressures are
significantly higher in oxy-fuel combustion flue gas than those in air-fuel combustion, and correspondingly, the absorptivity and emissivity of the flue gas substantially increases.
When a radiation beam of specific wavelength travels through a gas, a portion of the radiation intensity, , is absorbed by the gas. The change in the spectral radiation intensity, dI within an infinitesimal beam length ds is:
dI I ds (1.2) where is the spectral absorption coefficient, which is a function of the wavelength, gas
composition, gas temperature and pressure [63]. The spectral absorptivity and emissivity can be derived by integrating the above equation (1.2) over the beam length, : s
1 exp s (1.3) 0 600 1200 1800 2400 3000 3600 4200 4800 0 20 40 60 80 100 g 1/, cm-1 CO2 H2O CH4 Tempearture (K) 0.31 0.77 3.9 0.8 2 10 3.2 2 10 833 833 1389Partial Pressure * Path Length (atm*m) Partial Pressure (atm) Total Pressure (atm) Gas
Figure 1-4. Spectral absorptivity as a function of wavenumber for water vapor, carbon dioxide and methane, reproduced from reference [64].
Figure 1-4 shows the spectral absorptivity, , of the different gas components produced in a combustion process [64]. Since triatomic gases (CO2 and H2O) have much
higher partial pressures when flue gases are used as the diluent instead of nitrogen, the absorption and radiation in oxy-combustion are stronger than in conventional air-fuel combustion with identical gas temperatures. A close look at Figure 1-4 shows that
absorption is not continuous over the entire spectrum; instead it is concentrated in a number of moderately wide spectral bands. The effective absorptivity and emissivity of a gas mixture can be obtained by integrating the above equation over the full spectrum. However, direct computation of the gas absorptivity is difficult, and gray gas or band models are widely used in the CFD modeling, which will be discussed later.
-4000 -200 0 200 400 600 800 10 20 30 40 Radiation intensity (kW /m 2 sr) Radial distance (mm) Air-total OF 25 - total OF 27 - total OF 29 - total Air - gas OF 25 - gas OF 27 - gas OF 29 - gas
Figure 1-5. Comparison of total intensity measurements (symbols) and gas radiation modeling (lines) at 384 mm away from the burner inlet. Data cited from Andersson et al. [65].
Soot and particle (coal, char and fly ash) radiative emission and absorption play as important a role as the triatomic gases in coal combustion [66, 67]. Experimental studies in oxyfuel combustion have confirmed this trend. Andersson and coworkers [65, 68-70] investigated the radiation intensity of propane-fired and lignite coal-fired oxy-fuel flames in
the Chalmers’100 kW test facility. The total radiation intensity was measured using a narrow angle radiometer, and the gas radiation was estimated using Malkmus Statistical Narrow Band Model (SNBM). Results of the calculated gas and the measured total radiation intensities at the flame zone are shown in Figure 1-5. It can be seen that the portion of the gas radiation in the total radiation intensities under OF25 condition (OF25 denotes oxy-fuel combustion with O2 concentration of 25% in the burner gas) is
significantly higher than in air-combustion. Measurements shows that the temperature distribution in the flame zone under OF25 condition is very close to that under the air-firing condition, and that the H2O partial pressure increases only slightly from air to OF25
condition, therefore, the higher gas radiation in oxy-fuel combustion is attributed to its 5 times higher partial pressures of CO2. However, as another important radiation source, the
particle radiation contributes about 60-70% of the total radiation in both air-fired and oxy-fired cases, which does not change much in oxy-fuel combustion. This study suggests that in lignite oxy-fuel combustion, if the gas temperature is maintained the same as in air combustion by increasing the O2 concentration to 25% (OF25), the measured total radiation
intensities are similar (OF25-total and Air-total) although gas radiation is enhanced. This is because a large fraction of radiation is emitted by particles, which have similar contribution in both combustion environments.
1.3.1.2. Convective Heat Transfer
The convective heat flux of the flue gas, q , can be approximated as follows: conv
conv
q (1.4) h T
between the bulk gas and the heated object. The convective heat transfer coefficient is influenced by the flow velocity and gas properties such as viscosity, thermal conductivity, heat capacity and density, which are also functions of temperature. The ratio of convective heat transfer coefficients of the flue gas in oxy-fuel combustion ( ) to that in air-fuel combustion ( ) can be expressed in terms of dimensionless numbers - the Reynolds number and the Prandtl number - and the fluid thermal conductivity [
oxy h air h 29]: Re Pr Re Pr m n oxy oxy oxy oxy air air air air
h k
h k
(1.5)
where m and n are empirical factors that vary for different geometries. The slightly higher thermal conductivity of CO2 does not significantly change the conductive heat transfer
when compared with air-combustion. However, for convective heat transfer at identical velocity, its lower kinematic viscosity results in a larger Reynolds number and thus a higher convective heat transfer coefficient.
Woycenko et al. [71, 72] studied convective heat transfer coefficients in oxy-coal and air-coal combustion. They found that the ratio increases with increasing recycle ratio because of the changes in the thermal properties of the flue gas and the increase in the gas velocity. Moreover, this value is ~1.15 when the wet recycle ratio is 70%, at which the adiabatic flame temperatures are approximately the same.
/
oxy air
h h
Recall that in Equation (1.4), the convective heat flux is a function of the temperature difference ( ), which on average decreases with increasing recycle ratio. Therefore, an acceptable operational range of the flue gas recycle ratio exists in which one can approximately match the convective heat transfer in oxy-coal combustion to that of air
T
combustion [19, 73]. Thus the existing coal-fired power plant can be retrofitted to function as an oxy-coal plant without replacing the boiler or heat exchangers.
1.3.1.3. Matching the Heat Transfer in Oxy-Fuel Boilers
There are several constraints that need to be considered when retrofitting a conventional air-fired power plant to oxyfuel combustion, including the combustion temperature, the furnace outlet temperature, and the heat transfer in radiative and convective heat exchangers. Based on the above analyses, it appears that matching the gas temperature profiles in the boiler is a starting point in the effort to maintain similar heat transfer characteristics in oxy-coal combustion. A good indication that the temperature profiles are matched is when a similar adiabatic flame temperature (AFT) is achieved. Wall et al. [21] calculated the theoretical O2 mole fraction (or flue gas recycle ratio) necessary to
maintain the same AFT under air-coal and oxy-coal combustion conditions using the equilibrium approximation. Approximately 20% excess air in air-coal combustion and 3-5% excess O2 in oxy-coal combustion are used to ensure that all the calculations are done
on the same basis of about 3.3% (v/v) residual O2 in the flue gas. Figure 1-6 shows the
computational results of the AFT in air-fired and oxy-fired conditions with increasing oxygen fractions for both wet and dry flue gas recycle. The results suggest a temperature drop of about 400 K and 800 K, respectively, in wet and dry recycling oxy-fuel combustion with oxygen concentration of 21% by volume when compared with that of the air-fired condition. The authors did not indicate the coal type in their calculation; it should be noted that the results are depend on the approximate and ultimate analysis of coal.
0.20 0.24 0.28 0.32 0.36 0.40 1000 1200 1400 1600 1800 2000 2200 2400 2600 Adiabatic flam e tem perature (K )
O2 fraction at burner inlet (-)
oxy-dry oxy-wet air
Figure 1-6. The O2 partial pressure (fraction) required at burner inlet (to achieve similar adiabatic flame
temperature as the air-fired case) for wet and dry flue gas recycle (residual O2 mole fraction in the flue
gas fixed at 3.3%) [21]. The symbol ■ indicates the AFT of air-coal combustion, the red solid line —
and blue dash line --- indicate the AFT of oxy-coal combustion with dry and wet flue gas recycle, respectively.
Considering that the radiative and convective heat transfer characteristics in oxy-fuel combustion are rather different from those in air-fuel combustion, a matched gas temperature might be close to, but not precisely, the optimum operating condition in order to obtain a matched distribution of heat fluxes in different heat exchanger components. Hence, studies have also been conducted in order to find the optimum recycle ratios for a matched heat transfer distribution in the furnace (radiative section) and in the convective