Congestion Reduction in the Emergency Department of
Massachusetts General Hospital
by
Philip T. Ebben
B.S, Mechanical Engineering, University of Minnesota - Twin Cities, 2013
Submitted to the MIT Sloan School of Management and the Department of Mechanical Engineering in Partial Fulfillment of the Requirements for the Degrees of
Master of Science in Mechanical Engineering And
Master of Business Administration
In conjunction with the Leaders for Global Operations (LGO) Program at the MASSACHUSETTS INSTITUE OF TECHNOLOGY
June 2018
@2018 Philip Ebben. All rights reserved.
The author hereby grants to MIT permission to reproduce and to distribute publicly paper and
electronic copies of this thesis document in whole or in part in any medium now known or hereafter created.
Signature of Author:
Signature redacted
MIT Sloan School of Management and the Department of Mechanical Engineering
/ I May 11, 2018
Certified by:
Signature redacted
Retsef Levi, Thesis Advisor J. Spencer Standish (1945) Professor of Operations Manager
Certified by:
Certified by:
Accepted by:
_______________Signature
redacted
Duane Boning, Thesikdvisor Clarence J. LeBel Professor, Electrical Engineering and Computer Science
Signature redacted
Kamal ?oucef-Toumi, Thesis Reader Professor, Department of Mechanical Engineering
_ ___
Signature redacted
RohartIbeyaratne Chairman, Committee on Graduate Students, Department of Mechanical Engineering
tedby:
Signature redacted
MASSACHUSETTS INSTITUTE| P Maura Herson
OFTECHNOLOGY
JUN 25 2018
LIBRARIES
Director, MBA Program, MIT Sloan School of Management Accep
Congestion Reduction in the Emergency Department of
Massachusetts General Hospital
by
Philip T. Ebben
Submitted to the MIT Sloan School of Management and the Department of Mechanical Engineering on May 11, 2018, in partial fulfillment of the requirements
for the degrees of
Master of Business Administration
And
Master of Science in Mechanical Engineering
Abstract:
The MGH Emergency Department (ED) and General Medicine Floor currently experience heavy patient volume and rising patient wait times, despite recent capacity expansions. While several projects have been piloted to divert patients towards alternative care paths, MGH management wants to better understand what types of patients are being admitted to the hospital and what features are deterministic of patient admission. This thesis addresses this information gap by using binary logistic regression models to assess predictive and significant patient features for admission. Our analysis uses both patient demographic information and decision point data gathered in the Emergency Department of patient visits. On out-of-sample data, our predictive model achieves an area under the receiver operating characteristic of 0.82, and we conclude that the predictive features for admission are within good clinical practice. Further analysis of patient care suggests that provision of IV antibiotics in the outpatient setting could reduce MGH admissions by approximately 307 days per year, with additional possible reductions in excess of 1,000 bed-days for different provisions of care. We also assess the outpatient usage of MGH patients and conclude that 75 percent of cellulitis, pneumonia and urinary tract infection patients are not seeing a clinician in the outpatient setting prior to ED presentation. This analysis indicates that more proactive management of these patients could prevent both their visit to the ED and potentially their admission. We demonstrate that statistical methods based on real time patient data. can contribute to effective healthcare planning and operations.
Thesis Advisor: Retsef Levi
Title: J. Spencer Standish (1945) Professor of Operations Management Thesis Advisor: Duane Boning
Title: Clarence J. LeBel Professor, Department of Electrical Engineering and Computer Science Thesis Reader: Kamal Youcef-Toumi
The author wishes to acknowledge the Leaders for Global Operations Program for its support of this work
Acknowledgements
This study would not have been possible without the invaluable support and contributions of many people. To my advisors and readers, Retsef, Duane, and Kamal, I am indebted for your guidance throughout the research process and your thoughtful edits and reworkings of this thesis. Dr. Peter Dunn, Bethany Daily, and Cecilia Zenteno, thank you for your support of the MGH-MIT collaboration, your patience with my initial lack of understanding of healthcare, and your obvious commitment to improving MGH.
Kimia Ghobadi, thank you for numerous late-night emails, calls from Canada, and steadfast support for the past twelve months. Your flexibility was truly appreciated. To my fellow interns, Alexandra Qi and Jonathan Zanger, I am fortunate to have shared this experience with you. A special thank you to Jonathan, who has a rare gift for both deep technical knowledge and the ability to explain concepts in simple terminology. I have taken advantage of your teaching abilities numerous times.
Another thank you to the clinicians and MGH employees who were indispensable to data gathering and modeling input. Beth Grabowski, Cassie Kraus, Bob Seger, and Karen Lynch - you were all so cooperative and helpful with mining and understanding the data. To doctors Brian Yun and Marjory Bravard - your professionalism and commitment to patient care was inspiring, and your ability to translate medical terminology into model inputs for my work was invaluable. I'm so thankful for your enthusiasm to take on some of the mundane tasks required to help me understand the ED data.
Finally, I want to thank my lovely wife, Hannah. Your patience and commitment to me throughout the LGO program were undeserved and a testament to your self-sacrificial character. No matter what worldly accomplishments I achieve in this life, they cannot hold a candle to the joy of being your husband.
Table of Contents
CHAPTER 1: INTRODUCTION...10
1.1 MASSACHUSETTS GENERAL HOSPITAL ... 10
1.2 MGH-MIT COLLABORATION... 10
1.3 EMERGENCY DEPARTMENT CONGESTION ... 10
1.4 PROJECT OVERVIEW ... 11
1.5 VOCABULARY REFERENCE ... 13
CHAPTER 2: LITERATURE REVIEW ...
14
CHAPTER 3: M GH EMERGENCY DEPARTMENT ...
16
3.1 CAPACITY AND DEMAND FLUCTUATION ... 16
3 .2 E D P R O C E SSE S... 17
3.3 PROJECT MOTIVATION ... 21
3.4 CURRENT AVOIDABLE ADMISSION PILOTS... 22
CHAPTER 4: DATA AND PATIENT POPULATION ...
24
4.1 DATA SOURCES: EPIC AND D4Q ... 24
4.2 PATIENT POPULATION ... 24
4.3 FOCUS DIAGNOSES ... 25
4.4 DESCRIPTIVE STATISTICS ON DIAGNOSIS GROUPINGS ... 26
CHAPTER 5: ANALYSIS...
27
5.1 PREDICTIVE MODELING - GOAL AND PURPOSE ... 27
5.2 METHODOLOGY - FEATURES... 28
5.3 REGRESSION MODEL ... 30
5.4 MODELING PERFORMANCE... 31
5.5 DISCUSSION OF RESULTS ... 36
5.6 VARIABLE CHECK - LASSO TECHNIQUE ... 36
5.7 MODEL FALSE POSITIVES AND FALSE NEGATIVES... 36
5.8 UNDERSTANDING THE CARE OF ADMITTED PATIENTS... 37
5.9 OUTPATIENT CARE SETTING ... 42
CHAPTER
6:FUTURE W ORK AND CONCLUSIONS...
48
6.1 FUTURE W ORK ... 48
6 .2 C O N C LU SIO N S... 48
APPENDIX A
-
REGRESSION MODEL FEATURE DESCRIPTIONS...
49
APPENDIX B
-
LASSO TECHNIQUE:...
51
APPENDIX C
-
OUTPATIENT VISIT TYPES AND DEPARTMENTS:...
53
Chapter 1: Introduction
Chapter 1 provides a background on Massachusetts General Hospital, an introduction to the congestion problem experienced in the Emergency Department, and a thesis overview. We also provide a table of useful vocabulary references for this healthcare study.
1.1 Massachusetts General Hospital
Massachusetts General Hospital (MGH) is the third oldest general hospital in the United States, and is located in Boston, Massachusetts, in the West End neighborhood. Widely regarded as one of the leading medical research programs and consistently ranked in the top five hospitals in the United States by U.S. News & World Report, MGH annually admits approximately 49,000 inpatients (an inpatient is defined as a patient who is admitted to the hospital, typically for at least one overnight stay) and sees around 105,000 emergency room visits per year [1]. MGH has 999 beds and approximately 1.5 million outpatient visits per year (an outpatient is defined as a patient who receives treatment but is not admitted to the hospital, such as an emergency room visit or a primary care visit) [1]. MGH is also a research powerhouse as the largest hospital-based research program in the United States, with an annual research budget of more than $850 million [1]. Approximately 1,200 clinical trials are occurring at MGH at a given moment [1].
In 1994, MGH and Brigham and Women's Hospital founded Partners HealthCare, established to form an integrated health care delivery system [2]. Partners HealthCare includes community hospitals, primary care and specialty physicians, community health centers, and other health-related entities [2]. Since its founding, Partners HealthCare has expanded to include other Bostonian hospitals, and now includes North Shore Medical Center, Newton-Wellesley Hospital and Faulkner Hospital [2].
1.2
MGH-MIT Collaboration
Massachusetts Institute of Technology (MIT) has had a long historical research partnership between MGH and MIT's Sloan School of Management. The purpose of the MGH-MIT Collaboration is to apply operations research and management techniques to improve the hospital's most urgent operational challenges. The Collaboration team consists of MGH leaders, postdoctoral fellows from the Sloan Operations Management group, faculty from MIT, and MIT students. The Collaboration has focused on improving performance in many areas of hospital operations, including projects such as surgical patient flow, Emergency Department congestion reduction, and case management workload prediction [3]-[5]. The research presented in this document is part of the work done under this collaboration.
1.3 Emergency Department Congestion
Originally built for 60,000 patients per annum, the MGH Sumner Redstone Department of Emergency Medicine now annually treats 105,000 patients, and that number is increasing each year [1,6]. To ease patient congestion, MGH completed a $500 million expansion in 2014, and it currently stands as a Level 1 Adult Trauma Center, Level 1 Pediatric Trauma Center, and Level 1 Burn Center [6]. Like most Emergency Departments (EDs), the MGH ED operates 24 hours per day, 365 days per year. As one of the most advanced emergency rooms in the world, the MGH ED generally sees the most complicated and critical patients out of the Partners HealthCare
system. Typically, the complex patients at other Partners HealthCare facilities will be transferred to MGH, not vice versa.
Although the ED was recently expanded, the volume of patient arrivals has been steadily increasing, and is projected to continue increasing in upcoming years. With current trends, the estimation is an average of 340 visits per day by 2020, and the total number of annual ED visits is expected to surpass 120,000 (Figure 1). Internal reports and past research in the MGH-MIT Collaboration has documented steadily increasing patient wait times in the ED, as well as increases in the number of times that patients are waiting in the ED for hospital admission with no available
bed [4].
ED Visit Volume Projected through FY20
ED Visits * Avg Visits/Day
160,000 400 140,000 323 332 340 350 314 32 297 303 120,000 280 287 300 268
~
246 251 249 2 100,000 232 -* 250 2) 221 > 215 22 80,000 200 a 60,000 - 150 40,000 :..100 20,000 50FY06 FY07 FY08 FY09 FY10 FY11 FY12 FY13 FY14 FY15 FY16 FYI7 Proj FY18 Proj FYl9Prj FY20 Proj
Figure 1 - Projected ED visit volume at MGH. Bight axis denotes average daily visits to the ED, and left axis shows total ED visits for each fiscal year. Sourced from MGH Emergency Department Crowding
Mitigation Update, June 2017 [7]
1.4 Project Overview
The general goal of this project is to reduce ED congestion at MGH by using data analysis of electronic medical records. Past research on congestion by the MGH-MIT collaboration has focused on a particular set of diagnoses called Ambulatory Care Sensitive Conditions (ACSCs, discussed more in Chapter 2).
This thesis focuses on a subset of ACSCs, and is driven by two specific hypotheses for the
particular diagnoses:
i) There are alternative outpatient care paths (existing and to be developed) that could provide equally safe care for some patients that are currently being admitted. ii) Early and timely outpatient intervention could prevent the admission of patients with certain diagnoses who currently arrive to the ED already too sick to be cared for in alternative settings to the hospital.
Based on these hypotheses, this thesis seeks to answer three questions related to overcrowding
at MGH:
1. Which patient features upon presentation in the ED cause clinicians to admit patients?
2. What care, if provided in the outpatient setting, would most reduce MGH bed-days in General Medicine? In other words, what care is provided to an admitted patient that, if provided in a different setting, would make that patient an unnecessarily admitted patient?
3. How is the outpatient setting currently being utilized by patients leading up to an ED presentation?
With respect to the above questions, (3) is relevant for reducing unnecessary ED visits and admissions. We assume that some less-acute patients are going through the ED and are being admitted who could possibly be provided for in the outpatient setting. By understanding how the outpatient setting is being utilized, MGH can better plan for these potentially avoidable patients. Questions (1) and (2) regard the idea of preventable admissions. Chapter 2 provides more background research on the topic of avoidable patients, but for introductory purposes, this study defines "preventable admissions" as patients who did not necessarily need to be admitted to the hospital, and "preventable visits" as patients who could have been provided for outside of the ED. We close the information gap of (1) by developing a binary logistic regression model that is applied to incoming patients, determining which features best predict whether the patient will be admitted. The data used for our analysis is comprised of electronic medical records from hospital data servers. The model takes into account both past patient demographic information and current ED laboratory data from the visit. To assess admitted patient care which could be provided in the outpatient setting (2), we group patients by usage of primary therapeutics, and Pareto rank the therapeutics that are most commonly used on the General Medicine floors of MGH. Finally, to answer (3), we look at the presentations to outpatient care in the week leading up to ED visits. Due to limited outpatient data, we restrict this outpatient care study to patients who are owned by MGH primary care physicians. Being "owned" by an MGH primary care physician simply means that a patient's primary care provider works directly at an MGH campus or health center,
and is thus affiliated with MGH.
Our predictive model on patient admissions achieves an area under the receiver operating characteristic of 0.82 on an out-of-sample patient population, and we conclude that the admission-correlated features display good clinical practice. We also estimate that the provision of IV antibiotics in the outpatient setting could reduce MGH admissions by approximately 282 bed-days annually.
The thesis is structured as follows: Chapter 2 provides a brief literature review on preventable admissions, preventable visits, and telemedicine studies. Chapter 3 provides a detailed review of patient flow through the Emergency Department and past efforts to reduce congestion at MGH. Chapter 4 is an introduction to the data used for this study and initial descriptive statistics. Chapter 5 provides the key analyses to the predictive model and care usage. Finally, Chapter 6 concludes and offers possible future work.
1.5 Vocabulary Reference
Terminology will be defined throughout this thesis, but for a simple reference, some common healthcare vocabulary is provided here.
Vocabulary Dictionary
Term Meaning
MGH-owned patient A patient whose Primary Care Provider works directly at an MGH campus or health center. Inpatient A patient admitted to a hospital bed.
Outpatient A patient who receives medical treatment without being admitted to the hospital. A patient who is transferred directly to the MGH Emergency Department from another Transfer Patient healthcare facility, typically by ambulance or helicopter.
An admitted patient who is still physically in the Emergency Department but waiting for a Boarder hospital bed to become available.
Encounter A patient-specific visit to a hospital. If a patient visits a hospital multiple times, he will have a unique encounter number for each visit.
Chapter 2: Literature Review
Chapter 2 provides an academic literature review of past research on reducing hospital congestion and emerging technologies that may alleviate congestion in the healthcare field. We develop a more nuanced idea of "preventable" admissions that will be used throughout the rest of this study.
There are two common strategies for reducing ED congestion in healthcare:
Strategy 1 -Reducing hospital congestion that is often the cause for ED congestion Strategy 2 - Reducing the number of ED visits
Each of these strategies view congestion reduction in a slightly different light. The first strategy is often performed by identifying patients who are less acute and could potentially receive care elsewhere, rather than going through a full hospital admission. Due to the bottlenecking effect of bed wait-times, high hospital congestion has been shown to contribute to ED congestion, and identifying patients who could be discharged rather than admitted to the hospital can lower ED congestion [8]. Efforts to lower hospital congestion can range from telemedicine programs to home hospital options to in-department care management teams [9]. The healthcare literature commonly refers to these patients as "avoidable" or "preventable" admissions, since these patients could potentially be cared for post-ED without taking a hospital bed [10].
On the other hand, the second strategy sees congestion as a consequence of late intervention. Under this strategy, reducing congestion can be approached by caring for patients before they even arrive to the ED. When we use the term "avoidable" and "preventable" admissions under this strategy, most healthcare research considers the term to mean those patients who may have been clinically appropriate admissions upon arrival to the ED, but whose admission could have been avoided with effective outpatient care [10]. Typically, these conditions are termed ambulatory care-sensitive conditions (ACSCs), and while there can be some dispute about what exactly constitutes an ACSC, past work at MGH has considered the following seven conditions to be
ACSCs [4]:
1. Bacterial Pneumonia
2. Cellulitis
3. Chronic Obstructive Pulmonary Disorder
4. Dehydration 5. Diabetes
6. Heart Failure
7. Urinary Tract Infection
While this latter definition of "preventable admissions" is useful for the second strategy, it is not as useful for a study on direct ED operations. For example, an admission for heart failure may potentially be avoidable with better outpatient care, but it does not change the fact that when a patient is experiencing decompensated heart failure, she probably needs to go to the ED and be admitted. From the ED's perspective, it is too late to reduce congestion once a heart failure patient has reached a severe symptomatic state and has arrived at the door. Some researchers have pointed
out that certain ACSC related hospitalization factors can definitely be addressed with primary care, but some of the solutions probably lie outside of primary care's scope [11].
Since ACSC patients are not necessarily excessive admissions, identifying all patients with ACSCs as "preventable admissions" does not seem to be useful vocabulary for this study. Rather, this study adopts a simpler definition of "preventable admission," that definition simply being the event where a. patient is admitted to a hospital bed unnecessarily, or in excess of their needs [12]. One challenge with this approach is that it can be very time intensive and subjective to determine what constitutes what is essentially an admission error. In a 2017 working paper on ED decision making, Freeman et al. take an approach where the authors assume that a decrease in short-stay, observational admissions means there was a proportional decrease in preventable admissions [12]. Note that, in Freeman's research, preventable admissions are not known directly, but rather are expressed as a percentage of a more easily acquired number, that number being short-stay admissions. Other attempts to classify preventable admissions include using admission indicators drawn from claims data, but these sometimes display stark discrepancies with clinician opinion [13].
Logically flowing from the definition of "preventable admission," to create useful vocabulary for Strategy 2, our study adopts the phrase "preventable visit" to mean an unnecessary visit to the ED which could have been assessed in a non-ED setting (an urgent care appointment, for example). Under these definitions, it is possible for a patient to be both a preventable admission
and an unpreventable visit. Some studies estimate that ten percent of national ED visits are for matters that could have been addressed in a lower-cost setting [14].
As mentioned previously, with regards to reducing hospital congestion under Strategy 1, an area that has grown in popularity with preventable admissions is the idea of telemedicine. Definitions vary slightly, but the core of telemedicine is "the delivery of health care services at a distance, using information and communication technology" [15]. Telemedicine could potentially be used by healthcare providers to deliver medical information that would otherwise be obtained via an admission, helping avoid high admissions rates. Many applications connect patients with providers. Others connect clinicians with medical specialists, minor treatment clinic usage, and assessing unplanned hospital transfers, often on mobile devices. In the academic literature, telemedicine pilots are typically evaluated on one of three evaluation perspectives: i) clinical outcomes, ii) economics and iii) satisfaction [16]. Limited evidence exists on telemedicine's impacts on the patient and provider, but many studies show high user satisfaction with telemedicine projects [17]. One of the areas that is considered as promising in the literature is the use of telemedicine with skilled nursing facilities and nursing homes to reduce hospital admissions [18]. Not only have surveys shown a relatively welcoming outlook, but some studies show significant reduction in ED usage by the elderly with certain telemedicine implementations [19].
Another common attempt at Strategy 1 is home hospital programs. To help keep medical costs down and reduce congestion in hospitals, home hospital programs are somewhat recent attempts in the Boston area. In addition to MGH's pilot home hospital programs, Brigham and Women's hospital recently performed a randomized controlled trial between home and usual care with patients suffering from infections, heart failure exacerbations, COPD exacerbations, or asthma exacerbations [20]. Patients in the Brigham and Women's pilot received at least one daily visit from an attending internist and two daily visits from a registered nurse. The study showed a 52% reduction in median direct cost for home patients.
Chapter 3: MGH Emergency Department
Chapter 3 provides an overview for capacity, how patients flow through the Emergency Department, as well as the layout of the ED. The Emergency Department at MGH is one of the most fundamental means of inpatient admission to the hospital, accounting for approximately 50 percent of inpatient admissions.
3.1 Capacity and Demand Fluctuation
The ED sees fairly consistent arrival patterns and discharge patterns throughout the year. Generally, fewer patients arrive on weekends, and Monday is the busiest day of the week (Figure 2). On a daily basis, the median ED census fluctuates between 60-75 patients in the morning to 85-110 patients at night. The ED median census is above the total ED bed capacity (61 beds not including pediatrics) for almost all hours of the day (Figure 3). Figure 3 also shows that the peak congestion hours are usually around 5:00 or 6:00 PM, and the least utilized hours are around 6:30
AM.
FY16 Overall Census by Hour of Day and Day of Week
- Median - P75 - FY15 Median Census -- - Monitored ED Bed Capacity -- -Total ED Bed Capacity 160 140 - -120 -100- --- -80 60 - --- - - -- --- - --- - - --- ---- - ---4 0 - - - ---- - -20 -0 0 0 0 00ID0 00 00 0 000 0 0 00 0 0 0 00D0 0 00 00 00 00 0 0 N O 0 0000 000a 0
~00
00 00 0 C0 0 ID 0 00 O0 0 :Sun Mon Tue Wed Thu Fri Sat
Figure 2 -FY16 census by day of week. P75 is the 75th percentile of census. Monitored capacity is the number of beds with constant monitoring, while Total Bed Capacity is the physical number of beds
FY16 Overall ED Census by Hour
--- Median Census -+ P75 Census -+- FY15 Median -- Median Arrivals
-Median Discharges -- - Monitored ED Bed Capacity - - - Total ED Bed Capacity
140 120 100 $ 80 60 --- ---- --- ---40 20 -0 oD oD C> 0) 0C 0 0 0 0 0 0 0 0) 0 0 0 0 0 0 0 oC o 0 0f 0T 0 (0 1 00 0) 0 0 0% M I* 0' 0D 0 0 0 03 0D 01 0 N N1 04 N
Figure 3 - ED arrivals, discharges, present by hour. P75 is the 75th percentile of the census. Monitored
capacity is the number of beds with constant monitoring, while Total Bed Capacity is the physical number of beds available. Chart sourced from MGH ED Observation Unit Census Report, 2016 [21]
3.2 ED Processes
Generally, a patient arriving to the ED gets routed through three consecutive steps: i) Reception; ii) Triage; and iii) Evaluation. After these three steps, the patient is usually sent to one of the department's six treatment areas:
i) Acute ii) Urgent iii) Fast Track
iv) Clinical Decision Unit (CDU)
v) Acute Psych Service (APS)
vi) Pediatric Emergency Department (PED)
Details of these areas will be provided in the following section. It is possible for a patient to skip the three routing steps if they need immediate medical attention, and to go directly to a treatment area. These treatment areas, as the names suggest, denote the type, urgency, and level of care needed by the patient. Figure 4 displays the patient flow in the ED.
Step 1 Patient Expedited to Appropriate Treatment Area (As Necessary) Step 2 Step 3
Reception Waiting Area Triage Pre-Eval Eval
Patient Assessed Patient Waits Patient Assessed Patient Waits Patient Assessed
by Greeter RN by Triage RN by Attending MD2
5 Beds + EKG 9 Beds
Patient Arriving by Ambulance or
Helicopter? Yes Ambulatory
Patient Sent to
Patient Assessed Appropriate
by Triage RN Treatment Area
'
Treatment Areas 3 Acute 18 Beds urgent 22 Beds Clinical Decision Unit (CDU) 9 Beds + 4 Treatment Areas Fas Track 6 Beds Acute Psychiatric Service (APS) 6 Beds Pediatric Emergency Dept (PED) 5 BedsFigure 4 -ED operational flow chart (modified from Hoffman, 2017 [4])
'RN is the abbreviation for Registered Nurse
2MD is the abbreviation for Medical Doctor or Physician 3
Patients are shifted between the different treatment areas as necessary due to the evolving nature of medical conditions
18
Patient
Disc or
/1Transferred No
Admission e inpatient Bed
Required? - Requested
Maybe
\4ED Observation
IBed Requested
3.2.1 Reception
Reception is the first patient-facing aspect of the ED. Reception is seen by any walk-in or referral patients, and is only missed by patients who arrive via ambulance or helicopter. At reception, a nurse meets the patient and guides them to a screening or waiting room. After reception, patients move on to triage.
3.2.2 Triage
Triage is a key function of the ED, and is a way to prioritize cases based on patient acuity and need. The ED reception area has five screening areas, and triage is a brief (five to ten minute) clinical assessment that consists of taking the patient's chief complaint, checking vital signs, and assessing the patient's mental health. After triage, the patient moves on to evaluation.
3.2.3 Evaluation
Evaluation is a more complete patient examination that may include imaging (e.g., MRI, CAT scans or X-rays). After this assessment, patients will be sent to one of the six key treatment areas of the ED: Acute, Urgent, Clinical Decision Unit (CDU), Fast Track, Acute Psychiatric Service (APS), or Pediatric Emergency Department (PED). It is also possible that the patient will be transferred to another medical facility for specialty care.
3.2.4 Treatment Areas
There are six unique patient treatment areas in the ED, comprising 66 beds total. They range in their target patient populations, level of care, and admission rates.
Acute:
The Acute area has eighteen beds and treats the ED's most critical patients. Oftentimes these are trauma cases where the patient may need resuscitation. Once stabilized, these patients are usually admitted to the hospital.
Urgent:
The Urgent area has twenty-two beds, and is the care unit for patients who need care but who are one step below needing to go to the Acute area. Urgent case examples include chest pain, difficulty breathing, abdominal pain, and neurological issues [4]. Depending on how the patient
responds to treatment, these urgent cases may be admitted or sent home.
Clinical Decision Unit (CDU):
The Clinical Decision Unit is generally meant for patients who do not need immediate medical care, but who would benefit from further monitoring or diagnostic testing prior to deciding where the patient should go. According to past research, about half of all CDU patients result in being directly released, and the remaining half go to either ED Observation or to an inpatient service
[4].
In some respects, the CDU is used as a buffer waiting room while clinicians are evaluating patients and trying to decide if the patient necessitates an admission, or if there are simply not enough beds and less acute patients need a physical place to stay. Technically, the CDU has nine beds
and four "treatment areas" (physical spaces where monitoring can occur), but oftentimes excess patients will be seated or rolled into the CDU area on a mobile cot, expanding beyond the nine-bed capacity limit.
Fast Track:
Fast Track is a treatment area for patients who have minor issues that are not critical. Examples may be lacerations, broken bones, or the flu. Fast Track patients are almost never admitted as a rule, and they are usually discharged home within two hours of seeing a provider. Pediatric Emergency Department (PED):
The Pediatric Emergency Department is a designated area for anyone under the age of nineteen. PED has access to three hundred physicians, fifty medical specialties, and fifteen surgical services, and cares for over 14,000 patients per year [22]. Because pediatric care can display unique challenges and issues that are less common in adults, having a separate designated PED within the ED is a common clinical practice at hospitals.
Acute Psychiatric Service (APS):
Acute Psychiatric Service treats patients with substance-use emergencies and psychiatric needs, and is another designated area, due to unique patient presentations. The APS treats both children and adults, and the main objective is to stabilize patients before deciding where the patient should transition for further care.
3.2.5 ED Observation Unit (Obs)
In lay terms, the ED Observation Unit, otherwise called the Obs unit, is an area where patients can be observed, treated and diagnosed for up to 24 hours before a clinician must make an admission or discharge decision. The ED Observation Unit is a critical part of the ED, designed to offer a gateway decision to admission that will increase the accuracy of the corresponding clinical decisions. Past research has shown that these late-process decision gateways reduce short-stay admissions, likely reducing admission errors [12]. This option helps clinicians manage patients who may or may not need to be admitted depending on patient responses to a particular antibiotic, diagnostic results (e.g., imaging), or blood lab tests. The Obs unit has 32 beds. Its utilization follows a cyclical pattern, reaching capacity nearly every day around 7:00 AM, with reduced utilization in the late morning (see Figure 5). The bulk of discharges happens in the middle of the day, while arrivals are fairly steady between 2:00PM and 2:00AM.
ED Obs is not meant to be a holding place for patients who will ultimately be admitted for an extended period of time. Rather, ED Obs is meant to mitigate short term admissions of primarily two types of patients. First, those patients who can reasonably be discharged within a day. Second, those patients where it is unclear whether they need to be admitted, but further testing is required to determine admission. It may be undesirable to admit the first patient type for 24 hours or less to the hospital because the logistical toll of bed placement, transfer orders and case management may keep the patient as an inpatient longer than medically necessary. Concurrently, a patient undergoing heart failure who certainly needs admission is typically not sent to ED Obs, because he warrants an inpatient stay, and it is not operationally efficient for
him to spend his first twenty-four hours of a seven day hospitalization in the ED Obs unit, since he is going to be admitted anyway.
To ensure that the Obs unit is being used effectively, the ED keeps data on how many observation patients go home versus being admitted. The rough target number is that 80 percent of Obs patients should be discharged home.
May - October 2016 Overall ED OBS Census and Discharges by Hour
-4-Median Census -- P75 Census -+- Median Aivals -+- Median Discharges - - - EDOBS Bed Capacity 35
25
20
o
1510
5iur E -- -bs cesu an dis-harges Char sore- f G ED Observation Unit
o0 0 0 N 0 0000 0000
o C) C= C) C- UD CD CD CD ) 0D C) CD)
~
CD CD 0 CD CD 0D D C CD)(N N (N (
Figure 5 - ED Obs census and discharges. Chart sourced from MGH ED Observation Unit
Census Report, 2016 [21]
3.3 Project Motivation
Past research at MGH has documented many of the congestion issues facing the emergency department [4]. For example, one useful metric is the average amount of time it takes for an admitted patient in the ED to physically move to their inpatient bed after the bed has been requested. Between 2014 and 2015, this wait time increased by 20 percent to 3.1 hours. The number of patients in 2015 who had to wait more than two hours for a bed after an admission decision increased from 74 percent in 2014 to 80 percent of admitted patients in 2015 [4]. After an admission decision is made, if a patient waits longer than two hours for an inpatient bed, these patients are known as "boarders".
This increase in boarders also corresponds with an increase in the number of times MGH experienced Code Help or Capacity Disaster status. These codes are activated when boarders are "present in the ED and the department is either unable to care for existing patients in, or accept new patients to, a licensed treatment area" [4]. When Code Help occurs due to high patient congestion, the ED begins to turn away certain transfer patients in a tiered order. These transfer refusals can lead to a harmful outcome where the hospital may accept less-acute patients during temporary demand lulls, only to "later be forced to refuse [acute] patients due to a lack of space" [4].
3.4 Current Avoidable Admission Pilots
It is also worth noting that the MGH ED has been working on pilot projects to help provide less acute patients with alternative care paths to a hospital admission. A brief description of these pilots and their use is provided here, in order of least patient acuity to highest patient acuity. We note whether each of these pilot projects are focusing on preventable admissions or preventable visits to the ED.
3.4.1 Visiting Nurse Association (least acute patients)
Meant to reduce preventable admissions to General Medicine, patients can be sent home with the Visiting Nurse Association (VNA), a 501(c)3 nonprofit that is dedicated to caring for patients
in their homes. Anecdotally, this seems to be the most common pilot used at MGH.
3.4.2 Skilled Nursing Facility (SNF)
Patients can be sent to a skilled nursing facility to help avoid a preventable hospital admission. One agreement that helps MGH promote this option is the Medicare waiver agreement. An SNF is considered a rehab benefit, and Medicare policy normally requires a patient to stay in the hospital for three days before rehab benefits are financially covered. However, Medicare has agreed that MGH can waive the three day requirement (since this would financially incentivize a potentially unnecessary patient admission) and send a patient to an SNF.
3.4.3 Partners Mobile Ops Unit (PMOU)
Partners Mobile Ops Unit was an initiative that started in 2013 with the intent to provide nursing care at the patient's home. An example might be an elderly patient who had a fall, and where the radiography looked clinically acceptable, but the patient lives alone. A nurse practitioner (NP) might go visit the patient, as a nurse practitioner can write prescriptions. The NP might visit for a couple of days and then refer out registered nurses to administer the prescribed medications. Again, PMOU is meant to help avoid preventable admissions.
3.4.4 Home Hospital Program (HHP)
The Home Hospital Program, also meant to avoid preventable admissions, is one of the most recent pilot projects at MGH, beginning in 2016. The Home Hospital Program is one level of acuity higher than PMOU, because it includes the capabilities for doctors to complete house visits, whereas the most advanced clinician in PMOU is an NP. The HHP is designed to pull patients out of the ED and to provide them with care at their homes. It should be noted that the HHP is not run constantly, but rather it has coverage approximately during regular office hours (although, at the time of this thesis writing, there was some debate about expanding hours).
There are several key players to make the HHP run effectively. An NP is continuously looking at the history of patients who are in the ED, and this NP is in frequent communication with a dedicated registered nurse (RN) who is physically in the ED. If the NP identifies someone who, from a clinical perspective, may be a suitable candidate for the program, she calls the RN, at which time the RN goes and speaks with the patient to understand the home situation of the patient. If the patient is able to walk around the home, has access to food, does not live alone, and meets other social criteria, they may be a suitable candidate. The RN would next consult
with the attending ED doctor, and if the doctor deems it appropriate, and the patient agrees, the patient may go home with a referral to HHP. Once cleared, a doctor or an NP must physically travel to the patient's house to admit them to the HHP and write prescription orders at the house. Due to social and clinical factors, the Home Hospital process is very time intensive, and there are many late-stage decision gates that could disqualify the patient from being admitted to the service. For example, in interviews with the RNs in the ED, we were told that for every admission to HHP, there are approximately four patients where the RN performs an investigation into social status, home situation, and self-care ability, but the patient was disqualified for HHP. Over half of these non-placements are when the patient simply refuses to go home. Reasons for this are plentiful: maybe their primary spouse or caregiver does not want the patient to return, perhaps the patient is not comfortable going home, or it is even possible that the patient is too ashamed for a clinician to see their living situation. The remaining non-placements could have been an investigation by the RN, only to find that the attending doctor feels strongly in favor of admitting the patient to the hospital.
Since ramping up the HHP in April 2017, within the first six months of the program, less than thirty patients had moved through the pilot.
3.4.5 Transfer to Newton Wellesley (most acute patients)
Transferring patients to another hospital aims to both reduce preventable admissions and shorten an ED visit, so it can be considered a pilot for both preventable admissions and a sort of visit shortening act. MGH started a pilot of transferring to Newton Wellesley Hospital in late 2016. Necessarily, this is only viable when Newton Wellesley is underutilized, and the ED RNs typically say that patients who have come to MGH don't want to be transferred. However, this pilot option has the greatest potential for critical care, since a, full clinical staff can see the patient at Newton Wellesley.
Chapter 4: Data and Patient Population
Chapter 4 provides a brief overview of the electronic medical record data used in this study, as well as an understanding of the patient population used for the analysis. We also elaborate on the patient diagnoses chosen and corresponding descriptive statistics.
4.1 Data Sources: Epic and D4Q
In early 2016, MGH adopted an integrated electronic medical record system known as Epic Systems. Epic is a healthcare software system that tracks patient healthcare experiences, such as outpatient visits, medical history, hospital encounters, and general patient information. It is used across Partners HealthCare, so any visit to a Partners hospital or outpatient facility is electronically recorded and stored on a server. Many of the information servers are updated in real time, and nearly all relevant patient data is electronically stored.
Categorically, there are four main data types that this research uses:
1. Billing Data
2. Encounter Data
3. Outpatient Phone Data
4. Quadramed Nursing Workload Data
Billing data is collected through Enterprise Performance Systems Inc. (EPSi), which is a financial and cost accounting web-based platform used by fourteen of the largest eighteen hospitals in the United States [23]. The billing data for this work was used to confirm clinician diagnoses for the outpatient setting.
Encounter data is provided through Epic, and this data is used for all demographic and hospital encounter data. These include anything from patient info (age, past ED visits, primary care provider) to care provided and medications given during the hospital visit. It also includes hospital logistics, such as what hospital rooms the patient resided in, the amount of time spent in different treatment areas, and the physicians attending to the patient.
Outpatient phone data is also provided through Epic, and is gathered by the MGH Clinical Reporting team. Outpatient phone data is comprised of electronic records of phone calls made to the outpatient clinics at MGH. This data includes the date and time of a phone call, the clinic that received the call, the patient making the call, and the employee who answered the phone.
Quadramed data is gathered by the MGH Patient Care Services Information Systems team. This data consists of nursing scores assigned to inpatients throughout their hospital stay. These scores help the scheduling team to plan nurse staffing each week. We use this data to approximate the amount of nursing care that patients needed throughout their hospital stay.
4.2 Patient Population
Because MGH completed its switch to Epic in April 2016, the patient pool that is analyzed for this project includes all patients who visited the MGH Emergency Department between May 2016 and July 2017. Patient encounters earlier than May 2016 did not have reliable data on accessible servers, and the selected population seemed sufficient for showing statistically relevant
features for admission. This patient pool consists of approximately 120,000 different encounters over 14 months. It should be noted that this patient pool is best described as any encounter which
went through the MGH Emergency Department. This includes non-MGH-owned patients
(patients with a primary care provider who does not work at an MGH facility), transfers from other facilities, and any referrals. Any patient who came through the door of the ED is included in this pool. This patient population was later narrowed to particular diagnoses pools for analysis.
4.3
Focus Diagnoses
The focus group of patients for this study have diagnoses with the following attributes: i) Some reasonable fraction of the patients are admitted and some fraction are
discharged.
ii) The patient diagnoses are sensitive to outpatient care management, in that proactive outpatient intervention might prevent an ED visit or an admission. iii) The typical patient stay is less than five days.
The rationale for these attributes is that these patients are most promising in the context of preventable admissions and preventable visits. These patients are good qualifiers for Strategy 1 and Strategy 2 discussed in Chapter 2.
The process to determine these diagnoses is to give clinicians a Pareto chart of patient diagnoses in the ED which had between a 1:4 and a 4:1 ratio between patients discharged and patients admitted. Clinicians then would choose what diagnoses in particular they believe hold clinical promise for assessing alternative care paths. Upon initial groupings of the patient clinical impressions, Figure 6 shows the patient diagnoses that had both reasonably high patient populations and relatively similar volumes of patients being discharged and admitted. There are about 2,000 encounters of each, with significant populations in each going home, going to
Patient Focus Diagnoses
(5,638 encounters total, May 2016-July 2017)
Urinary Tract Infection
- Pneumonia-cellulitis
-0
30% 60% 10% 65% 23% 12% 23% 46% 31%s5o
10oo Quantity 150 Patient.Location.Post.ED ED ObservationHome or Self Care Hospital Admission
200O
Figure 6 -Final diagnoses for analysis
4.4
Descriptive Statistics on Diagnosis Groupings
A few high level descriptions of the patient population are useful, so that the reader has a general understanding of the patient population on which the analysis is being performed.
0 10% of the population was transferred from an outside facility. Of these transfers, 45% were from acute facilities (non-MGH hospital EDs)
* 42% of the patient population were admitted, with an average length of stay of six days
* 48% of the population has an MGH Primary Care Provider
0
'U
Chapter 5: Analysis
Chapter 5 outlines the regression modeling methodology used to analyze data in this thesis, provides results of predictive features, and comments on results. We also provide descriptive statistics on the outpatient care setting and inpatient care that are most commonly used by inpatients.
5.1 Predictive Modeling - Goal and Purpose
In our regression modeling, the dependent variable which the model predicts is whether the patient was ultimately admitted or discharged from the ED. As Figure 7 shows, while there are four different routes through the ED and hospital, there is no distinction made in the model between patients who passed through the ED Observation unit and those who did not. The model is only predicting whether the patient was ultimately admitted, based on patient information known at the time of the clinical decision to admit.
Hospital
Admission
Emergency Room Treatment Area
Model Inputs
Home
or Self Care
Model Outputs
Figure 7 - High-level view of predictive model of admissionThe primary goal of predicting patient admissions is to look at statistically relevant variables and to determine if any of the variables point to operational concerns at the hospital. For example, one suggestion brought up in interviews with doctors is the idea that non-English-speaking patients may have a higher admission rate due to lack of translators in the ED. The hypothesis is that if a translator is not present and it is difficult to communicate with a patient, a doctor may take a conservative route and admit a patient until more information can be gathered. Incorporating these features into the model can highlight operational improvements to be made in the hospital, such as hiring more translators. This would mitigate potentially avoidable admissions.
A secondary goal is to leverage the model predictions and specifically to identify potential improvement opportunities. For example, suppose the model predicts that a patient is likely to
be discharged, and the patient actually was admitted. This may indicate that the admission is preventable, since many patients with similar profiles were discharged. Review of these patients with clinicians could give insights into model updates or ED operations that should be rectified.
5.2 Methodology - Features
While patient data is collected throughout an entire hospital visit, only information known a
priori to a patient admission is used when trying to simulate clinical decisions made by the ED
attending. Otherwise, the model is unrealistic and not legitimately predictive, since it is leveraging data ex post, data unavailable to the ED at the time of the clinical decision.
After consulting with clinicians and assessing what sort of data is kept on patients, we decide to use the following types of input data:
Patient Demographic Data - Data pertaining to the patient prior to ED arrival. This includes information like state of residence, primary language spoken, known health concerns, age, etc. Environmental Data - Data pertaining to the ED environment upon patient presentation. This includes data such as time of arrival, crowdedness of the Observation unit, etc.
Visit Data - Data pertaining to the ED visit. This constitutes data such as blood lab work or key care provided in the ED that would impact a clinician's decision to admit or not.
To turn these variables into meaningful data for a predictive model, nearly all the variables are binary features, numerically 0 or 1. Some of the categories are straightforward to translate into binary variables (e.g., in-state versus out-of-state residence), but others require more clinical domain knowledge. For example, ED lab data requires understanding of clinical interpretations of the labs. Conveniently, all of the lab data that the clinicians recommended using have binary outcomes: specifically, if the lab result is above a certain threshold, this constitutes a "likely to admit" state, and if the lab is not past the threshold, the patient is deemed "normal." The list of features is shown in Figure 8, categorizing the data type and variable type that comprise the independent data in the model.
Feature Description Variable Type Lab Threshhold Acute Transfer Non-acute transfer Payer - Medicare Payer - Medicaid Payer - Self-pay Age -36 to 65 Age - 66-80 Age - over 80
Hypertensive Patient History Diabetes History
Substance Abuse History Heart Disease History
Chronic Kidney Disease History Non-English speaker
Multiple ED visits for same diagnosis Multiple ED visits for any diagnosis Patient had recent PCP visit (2 weeks) Patient has MGH PCP
Patient Out of State
Median Income of patient's zip code Patient arrived outside of office hours Patient arrived on weekend
Obs unit was crowded at admission Creatinine level
White Blood Cell Count Lactate
Troponin
Venous Blood Gas pH
C02 level Sodium Potassium Binary Binary Binary Binary Binary Binary Binary Binary Binary Binary Binary Binary Integer Binary Integer Integer Binary Binary Binary Integer Binary Binary Binary Binary Binary Binary Binary Binary Binary Binary Binary NA NA NA NA NA NA NA NA NA NA NA NA NA NA NA NA NA NA NA NA NA NA > 1.5 > 15.0 > 3.0 > .03 < 7.3 < 18.0 < 130 or > 150 > 5.0 Demographic/History Data ED Environment Data ED Lab Results
Figure 8 -List of predictive model features
The Lab Threshold column shows the lab results which would cause the binary variable to flip between 0 (Lab Threshold condition is false) and 1 (condition is true). For instance, after surveying doctors, the clinical focus group agreed that it would be concerning if a patient's creatinine level was above 1.5, resulting in a binary value of 1, but below this level, it would not be an obvious issue. The feature descriptors are meant to be somewhat self-explanatory, but a complete description of the feature names can also be found in Appendix A.
5.3
Regression Model
For the predictive modeling, binary logistic regression was used on the different patient populations. The general form of logistic regression is shown in Equation 1:
1
1+ e(Po+flt)
Equation 1 - General function for logistic regression
In Equation 1, p(x) represents an m x 1 vector of admission outcomes for m patients. 80 represents an m x 1 vector of bias term in the regression, fl, represents an m x n matrix where n is the number of coefficients chosen for the model. Finally, t is an n x 1 column vector of the actual coefficient values for which we solve.
The general analysis conducted is as follows:
1. Join demographic, environmental, and lab data from a patient visit. 2. Convert the data into proper variable types according to Figure 8. 3. Separate patients into UTI, Pneumonia, and Cellulitis diagnoses groups.
4. For each patient group, remove sparse columns that have fewer than 1% occurrences in the group.
5. For each patient group, randomly split data into 80% training, 20% testing.
6. Build regression model from the training data and perform parameter estimation on test data.
7. Compute area under the receiver operating characteristic (AUROC) on validation data and track statistically significant variables.
8. Repeat steps 5 through 7 twenty times, and count the number of times variables are selected as significant.
Sparse columns needed to be removed in some of the models. For instance, Venous Blood Gas pH is a measurement that is very rarely taken on cellulitis patients. Because this data column is so sparse, it is removed from the regression so that the problem is not ill-posed for the regression. By repeating the data split twenty times, confidence grows in both the mean area under the ROC curve and in the statistically significant features in the model. Essentially, the hypothesis is that if a variable is selected as statistically significant (with greater than 95% confidence) sixteen out of twenty times, this model feature is important. Due to the randomness of the training and test split, some features may show up as significant in some of the model runs, but only the truly significant ones will be selected nearly always.
For the predictive model, binary logistic regression was used on four patient populations: 0 Patients with an ED clinical impression of Urinary Tract Infection
0 Patients with an ED clinical impression of Pneumonia * Patients with an ED clinical impression of Cellulitis
0 The full grouping of all patients with any of the three diagnoses
5.4 Modeling Performance
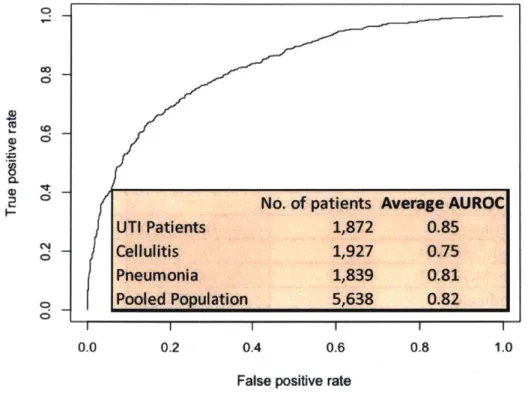
There are two key results to the predictive model. First, the features that are selected as statistically significant indicate which factors are strongly correlated with patient admissions. Second, the area under the receiver operating characteristic (AUROC) on the out-of-sample data indicates how closely the model maps current practice. The out-of-sample AUROC results are given as the average of the twenty model runs for each patient population in Figure 9.
0
0
C;
0 0t
2
0SNo. of patients Average AUROC
UTI Patients 1,872 0.85 Cellulitis 1,927 0.75 Pneumonia 1,839 0.81 o
Pooled Population
5,638
0.82
C| ; I I 0.0 0.2 0.4 0.6 0.8 1.0False positive rate
Figure 9 - Average AUROC on 20 random runs of out-of-sample data for different patient populations. Note that the curve shown is a single AUROC from one of the twenty Pooled patient models. Figure 9 shows that the UTI patient population model performed the most accurately on the test data. Interestingly, the pooled population model performed very well (0.82), which suggests that the important coefficients for the different populations do not need to be extremely numerically different from each other.
The next relevant question is: what are the important variables? For this analysis, a p-value below 0.05 is considered significant. Figure 10 through Figure 13 below show a rank ordering of
how frequently variables were chosen that appears at least sixteen times in significant.
to be significant in the logistic regression models. Anything the twenty random samplings for this p-value is considered


![Figure 4 - ED operational flow chart (modified from Hoffman, 2017 [4]) 'RN is the abbreviation for Registered Nurse](https://thumb-eu.123doks.com/thumbv2/123doknet/14454282.519311/18.1188.139.1033.115.509/figure-operational-chart-modified-hoffman-abbreviation-registered-nurse.webp)
![Figure 5 - ED Obs census and discharges. Chart sourced from MGH ED Observation Unit Census Report, 2016 [21]](https://thumb-eu.123doks.com/thumbv2/123doknet/14454282.519311/21.917.96.788.239.590/figure-census-discharges-chart-sourced-observation-census-report.webp)