4
Complexity and Obfuscation in Evolving Platform Pricing
byBanda Shruti
B.Tech. Computer Science and Engineering, National Institute of Technology, Warangal, 2012
Post Graduate Diploma in Management, Indian Institute of Management, Calcutta, 2014
Submitted to the System Design and Management Program in Partial Fulfillment of the Requirements for the Degree of
Master of Science in Engineering and Management at the
Massachusetts Institute of Technology February 2018
@ 2017 Banda Shruti. All rights reserved
The author hereby grants to MIT permission to reproduce and to distribute publicly paper and electronic copies of this thesis document in whole or in part in any medium
now known or hereafter created.
Signature of Author_
Signature redacted
Banda Shruti System Design and Management Program Graduate Student September 13, 2017
Certified
by_
Signature
red acted______
Catherine Tucker Sloan Distinguished Professor of Management Thesis Supervisor Accepted by MASAcu S IN STE OF TECHN4OLOGY
JUN 2 0 2018
Signature redacted
*1
Joan S RubinComplexity and Obfuscation in Evolving Platform Pricing
by
Banda Shruti
Submitted to the System Design and Management Program
on September 8, 2017 in Partial Fulfillment of the Requirements for the Degree of Master of Science in Engineering and Management
Abstract
Two-sided platforms include some of the largest and fastest-growing businesses of the past decade. They are composed of three parts: two distinct groups of end-users and a platform. Two-sided platforms face unique challenges such as design, pricing, governance rules etc. The pricing decision specifically has been the subject of rigorous research. As the value that each group derives from using the platform depends on the size of the other side of the market, the platform's pricing strategies of the two groups are closely linked. A platform pricing strategy includes decisions about which side of the platform to charge, how much to charge them and an overall approach to attract and benefit both sides of the platform. Though the study of platform strategies has been quite popular among many economists, they have focused on analyzing the strategies from a static perspective. Because platforms have evolved their pricing strategies over time to be competitive in the market and have faced challenges, the process deserves attention. This thesis therefore analyzes the evolution of pricing strategies of platforms such as eBay (sellers and buyers) and Uber (riders and drivers) and the challenges they overcame to stay ahead in the market. We study that eBay initially used a complex pricing strategy but simplified it to compete in the market with Amazon and other e-commerce firms. Uber, in contrast, began with a simple "taxi-meter" pricing but changed
their pricing strategy to account for the multiple variables such as demand, supply, location etc. The study concludes that to stay relevant in the market and to be successful, platforms need to evolve their pricing strategy over time depending on various market conditions. Though there is not one fixed pattern of how platforms evolve their pricing, their strategies consider simplicity, data availability and transparency while making pricing decisions. Future platforms can use these learnings while designing their pricing strategies.
Thesis Supervisor: Catherine Tucker
Acknowledgements
I would like to thank everyone that contributed to the success of this thesis, especially
the following people:
. Professor Catherine Tucker for teaching the "Pricing" class at Sloan which motivated me to pursue a thesis on pricing strategies. She encouraged my idea of working on platform pricing strategies and provided me with a wealth of information and guidance on the topic. She also gave me valuable feedback on my thesis and helped me improve it.
. My friends Olawale Akinwale, Eva Belmont, Grace Gu, Aysha Alomair and Sam
Raymond for helping me with discussions about my thesis and providing me with moral support.
. My family (Mom, Dad and Brother) for their love and support that they provided
during my MIT student life and encouraged my decision to pursue another Master's degree.
Table of Contents
A b s tra c t ... 3
Acknow ledgem ents ... 6
1. Introduction... 9
1.1 Research objective... 11
2 . A p p ro a c h ... 1 2 3. eBay as a platform ... 15
3.1 Com pany background... 15
3.2 Data collection ... 1 6 3.3 Initial pricing structure... 16
3.4 Current pricing structure ... 17
3.4.1 Seller Transaction fees ... 17
3.4.2 Subscription fees ... 18
3.4.3 Prom oted listings fees ... 19
3.5 Pricing Strategy evolution ... 19
3.5.1 Changes to facilitate fixed price model over auction model ... 19
3.5.2 Sim plified final value charges ... 26
3.6 Overall findings ... 32
4. Uber as a platform ... 33
4 .1 B a c k g ro u n d ... 3 3 4.2 Data collection ... 36
4.3 Initial pricing structure... 36
4.4 Pricing evolution ... 37
4.4.1 Dynam ic pricing strategy... 38
4.4.3 Price discrimination or "Willingness to pay" - 2017: ... 52 4 .5 O v e ra ll fin d in g s ... . . 5 6 5 . C o n c lu s io n ... 5 8 6 . A p p e n d ix ... 6 1 7 . B ib lio g ra p h y ... . . 6 2
Table of Figures
Figure 1: S um m ary of platform s ... 14Figure 2: Auction share on eBay over time. Source: (Einav, Chiara, & Jonathan, 2016) 20 Figure 3: Insertion fees for fixed price listings for "Books, Music, DVD, Movies and V id e o g a m e s "... 2 2 Figure 4: Insertion fees for fixed price listings for "other categories"... 23
Fig ure 5: "B uy it now " tier pricing ... 23
Figure 6: Fixed price listing fee in subscription stores... 24
Figure 7: Insertion fees for fixed price items in stores ... 24
Figure 8: Final value fees for auction style in 2010; Source: eBay... 27
Figure 9: Final value fees for no store listings over the years... 28
Figure 10: Final value fees for stores over the years... 29
Figure 11: Final value fees for stores based on product category... 30
Figure 12: Final value fees for eBay vs Amazon... 31
Figure 13: Uber network model. Source: David Sacks Twitter account ... 35
Figure 14: Uber's pricing in Jan 2011, Source: uber.com from 2011 ... 37
Figure 15: Demand supply curve: Increase in demand ... 39
Figure 1 6: Dem and and Price increase ... 40
Figure 17: Fine print on the Uber pricing website in Sept 2012... 43
Figure 18: Uber Surge price screen... 44
Figure 19: Uber Surge price screen in 2015 ... 47
Figure 20: New surge pricing form at ... 48
Figure 21: Uber upfront pricing overcharging the passenger ... 49
1. Introduction
There has recently been a growing interest in two-sided markets in both literature and business practice. A two-sided market is composed of three parts: two distinct groups of end-users and a platform. The first two groups derive utility from interacting with each other, and the platform enables and facilitates such an interaction. Two-sided platforms thus connect two distinct groups of users and create a surplus for them by realizing
interactions or transactions between the two groups (Schiff, 2007).
There are many examples of two-sided platforms. Traditional two-sided platforms include shopping malls and newspapers which are enabling merchants and advertising agencies to sell products to buyers and display advertisements to readers. Microsoft's Windows for PC, Apple's IOS and Google's Android for cell phones are operating system platforms, where the end users download and use applications from third-party developers. E-commerce websites such as Amazon, eBay and Alibaba connect the online trading between buyers and sellers. Sony's PlayStation and Microsoft's Xbox are game consoles on which developers create games that are played by countless gamers. The two-sided nature of many Internet and high-technology markets, as well as new payment systems and media outlets, suggests that these markets are becoming increasingly important (Rysman, 2009).
As the above examples illustrate, two-sided platforms include some of the largest and fastest-growing businesses of the past decade. This popularity is because successful platforms create enormous value by reducing search costs or transaction costs (or both) for their participants. As a result, they often occupy privileged positions in their respective industries.
An important feature of most two-sided platforms is that the value they provide to customers on one side of a platform typically increases with the number of participating customers on another side. This characteristic is known as the presence of "cross-side network effects," or sometimes referred to as "indirect network effects". The current research on two-sided markets stems from network economics and complementary product pricing (Rochet & Tirole, 2003). It shows that businesses that aim to create successful marketplaces for matching buyers and sellers have several simultaneous problems to address. They need to bring buyers and sellers to find each other, either by developing a centralized assignment mechanism or by enabling effective search. They need to set the right prices that balance demand and supply, or, alternatively, ensure that prices are set competitively in a decentralized fashion. This requires them to set a suitable initial price structure to bring different groups onto the platform. They might need to evolve their pricing structure to externalities and other factors, to keep different
groups simultaneously deriving value from the platform. Hence pricing plays an important role in the success of a two-sided platform.
1.1 Research objective
This thesis analyzes the evolution of pricing strategies of successful platforms such as eBay (sellers and buyers) and Uber (Riders and Drivers) and the challenges these platforms overcame to stay ahead in the market. It looks at the different strategies these firms considered over the years by analyzing the data collected on their pricing structures. It highlights their decisions from the perspective of the economics of two-sided markets. It finally looks at the implications of these pricing changes on the different sides of the platform and their effects on the platform itself.
The rest of this paper focuses on two-sided platforms that have overcome the initial growth barriers and have successfully built their platforms over the years. Data on each platform was collected and analyzed to show qualitatively and quantitatively the evolution of pricing. The platform ordering is as follows:
1. The first example, eBay, provides a platform for buyers and sellers to interact and
transact online. Seller fees depend on the number of users willing to buy from eBay and the popularity of the platform. Buyers may or may not be charged since
their presence provides the value on the platform to the sellers.
2. The second platform is Uber. Uber is not a conventional logistics company. It is a cost-saving platform that matches car owners having surplus carrying capacity with customers who need to travel between places that may or may not have other conventional transportation. Uber as a platform grew by charging the user full price and subsidizing the drivers. Therefore, the riders pay full price while car owners are rewarded by dynamically charged fares paid under real-time supply and demand conditions. The exchange between surplus capacity and demand and the reduction of information costs made Uber successful.
2. Approach
The research is based on the data gathered from a variety of resources. The qualitative data on pricing is collected from blogs, newspaper articles, books and journals from sources such as Factiva, Statista etc. The quantitative data on pricing for each platform is collected from the Wayback machine (Internet archive) mainly from the pricing page archives of individual websites. Overall statistics about the companies were collected from investor presentations, company blogs and memos or the company financial documents such as 1 OK. The approach was as follows:
1. Literature research:
a. Understand how the two platforms have evolved and the changes they had in their pricing strategies over time.
b. Understand how pricing has impacted the interactions of the two affiliated
sides with the platform and the reactions the two sides had to the changes in pricing.
2. Data collection and analysis:
a. Collect data of pricing evolution over the years to analyze the price changes since the inception of the platform.
3. Final report:
a. Present my findings on the two companies and the insights that future platforms can learn from these findings.
Connecting Buyers sellers and
buyers
Sellers - Buyers increase value of the platform.
Connecting Riders Riders and
Drivers
Drivers
- More sellers increase
the number of goods
sold on the platform.
- More sellersencourage other
sellers to use the
platform.
- Riders increase
coverage (Drivers)
- More Drivers impliesshort pickup times
- Greater quality impliesbetter prices for riders.
(Pipes to Platforms,
2014)
Figure 1: Summary of platforms
3. eBay as a platform
3.1 Company background
In 1995, Pierre Omidyar started the consumer auction website that became eBay. It is
said that he recognized the platform's potential when he put a broken laser pointer up
for sale, and sold it for $14.83 to a buyer who turned out to be a collector of broken laser
pointers (Rupley, 2015). The Internet is a powerful tool that helped buyers and sellers
find each other and with information costs getting cheaper, it paved way to platforms
such as eBay that seamlessly connect two different parties for transaction. Today eBay
brings more than 170 million sellers and buyers together in the online e-commerce
domain to trade with each other (Statista, 2017).
As in many multi-sided platforms, eBay experiences interdependence or externalities
between buyers and sellers that are on the platform. The externality could be either
usage or membership. eBay buyers care about how many merchants are selling on the
platform while sellers care about how many users/transactions happen through the
platform. Since it is important to have both buyers and sellers on the platform, eBay has
tried several strategies by changing business models, promotions etc. to increase its
usage and membership. In the early days of electronic commerce, one of eBay's
innovations was to introduce the use of proxy bidding, which enabled dynamic auctions
to run over a period of days without buyers being attentive at every minute (Einav, Chiara, & Jonathan, 2016). The Internet also enabled peer-to-peer markets such as eBay to try
a wide array of different pricing mechanisms as it developed and became an e-commerce giant.
3.2 Data collection
To understand how pricing has evolved on eBay's platform, data on its pricing was collected from years 2001 to 2017 to analyze the various changes that eBay experienced over the years. Data prior to 2001 was not completely available. The overall spreadsheet data for eBay can be found here: http://bit.y/2qWCJRv
3.3 Initial pricing structure
As the largest online marketplace, eBay subsidizes the buyer side of the market by making buying free, and charges various types of fees to the sellers. When eBay first started in 1995, it had an auction based model that let sellers sell their items on eBay through bidding.
1. Insertion fee when the seller lists an auction item on the platform.
2. Final value fee based on the selling price of the item listed
This can also be observed in the 2001 pricing data since the pricing has not changed much since 1995.
3.4 Current pricing structure
Today, eBay has multiple type of fees that it charges the sellers as part of its pricing structure. The most important ones are listed below.
3.4.1 Seller Transaction fees
The following are the current transaction fees that a seller must pay to eBay:
1. Insertion fee is charged when a seller lists an item on the platform for sale.
2. Listing upgrade fees if a seller adds optional features to the listing.
3. The seller needs to pay for a final value fee based on the selling price (for
non-stores) and based on product category for stores. (2017 pricing from eBay data).
Two sided platforms charge a small amount of access fees and transaction based service charge, which are like the insertion fee and the final value fee charged by eBay respectively. But another unique pricing by eBay is the optional upgrade fees. It offers sellers different upgrading features, such as Featured Plus, Item Subtitle, Bold, Border, Gallery, and Highlight, which allow sellers to differentiate their listings from regular listings. From a platform's perspective, such optional upgrade fees are an additional source of revenue since the marginal cost of providing such services is minimal. For sellers, upgrade options make their listings more visible to the potential buyers and put them in a better position in interaction with the buyers and in probability of sealing a deal, which may also reflect in a higher selling price.
3.4.2 Subscription fees
Additionally, if a merchant wants to create an eBay store which would be a central shopping destination, they are charged a subscription fee for each month.
1. There are 3 store types: Basic, Premium, and Anchor.
2. There are 2 store subscription durations: monthly (charged monthly, automatically renews monthly) and yearly (charged monthly, automatically renews yearly)
3.4.3 Promoted listings fees
The seller is charged a certain percentage of the final sale price per item when it is sold within 30 days of click on an ad of that listing.
3.5 Pricing Strategy evolution
3.5.1 Changes to facilitate fixed price model over auction model
eBay recognized the importance of price in maintaining liquidity and gross merchandise volume (GMV). But because in the 1990s there was no way to manage price at scale, especially for antiques, their first category, eBay adopted the auction model. Auctions were appealing because they allowed prices to respond to market conditions. But this put the burden of setting a price on the buyer. By 2001 eBay had become a dominant platform for consumer auctions, and was the third-ranked website in terms of time spent by customers. (Blogger, 2013). Around 2008, the share of listings and transaction
volume attributable to auction sale had fallen well below fifty percent on eBay's platform (Einav, Chiara, & Jonathan, 2016). Researchers at Stanford and eBay hypothesized that the time and effort it took to win an auction encouraged buyers to directly buy the goods
instead. Though auctions enabled price discovery and buyer competition, it was less convenient for buyers and they also had high transactional costs.
1 0.9 --- -0.8 -_-_-_ 0.7-0.6 0.5----0 .4 -- -- -0.3
0.2 - Share of active listings - Share of revenues
0.1 -_-_ _ _____ ___ ___ _
0
Jan-03 Jan-04 Jan-05 Jan-06 Jan-07 Jan-08 Jan-09 Jan-10 Jan-11 Jan-12
For each month, the figure shows the average daily share of active e8ay listings (black) and transaction revenues (gray) from pure auction listings out of all pure auction and posted price listings. Less common formats, such as hybrid auctions, are not included. The sharp drop in Fall 2008 coincides with a decision in September 2008 to allow "good till canceled" posted price listings (see Section 7).
Figure 2: Auction share on eBay over time. Source: (Einav, Chiara, & Jonathan, 2016)
With little data in 90's, eBay had no choice but to cede pricing to the buyers and sellers through the auction model. But when there was enough data, they had three primary considerations when deciding the right pricing strategy. First, if there was high transparency in the overall market then actively managing price becomes critical.
Second, if demand for a product varied with time then managing prices actively would be critical to success of platform. And finally, if products were at a low enough price point where consumers won't consider their buying decision carefully (as in auctions) then actively managing prices could optimize into much greater profitability (Alex,
2017). The data showed that customers were inclined towards fixed price over auction
model (Figure 2). "Clearly there's a strong buyer preference for fixed price," announced Lorrie Norrington, president of eBay Marketplace, in 2008. (Flynn, 2008).
Hence, eBay announced a major shift (that has continued since) towards fixed price sales. To facilitate the business model shift, they used pricing as a tool and made the following changes to their pricing structure:
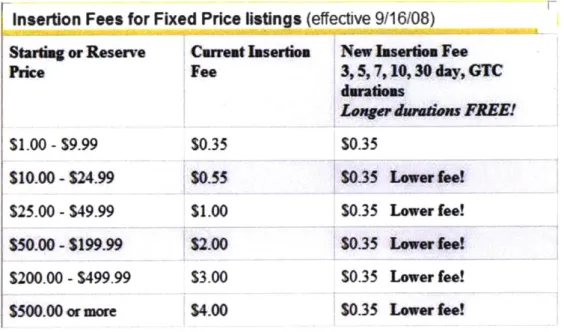
1. Figure 3 and 4 show how eBay introduced a flat 35 cent insertion fee (for 30 days)
and flat 15 cents (for books Music etc.) to list items under fixed price which is a reduction of nearly 70% in upfront fees.
2. Figure 5 shows that they introduced a new pricing plan for sellers who offered fixed price items in "buy it now" format instead of an auction model.
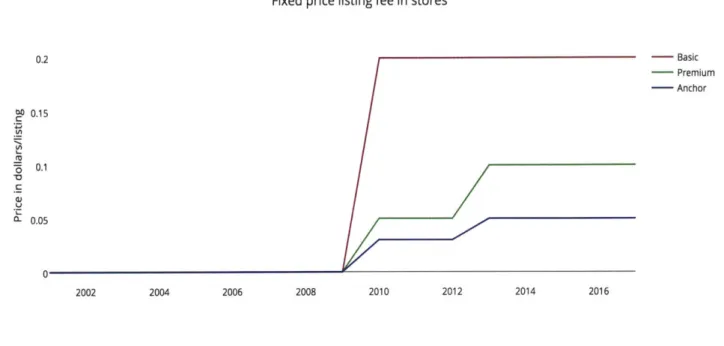
3. Figure 6 and 7 show that insertion fee for fixed price items in subscription stores
were as low 3 cents per item. Subscription rates offer basic, anchor and premium store pricing options, depending on the size of a seller's business.
They thus introduced changes to their pricing to favor the fixed price format and helped its customers easily to move to the new format. They also added new pricing features such as "buy it now" that encouraged sellers to adopt the fixed price format.
Insertion Fees for Fixed Price listings (eff Books, Music, DVDs & Movies mad Video G=es Starting or Reserve Carrent Insertion
Price Fee $1.00 - $9.99 $10.00 -S24.99 $25.00 -$49.99 $50.00 -$199.99 $200.00 -$499.99 $500.00 at more $0.25 $0.35 $1.00 $2.00 $3.00 $4.00 ective 9/16/08)
New Inserion Fee 3,5,7,10,30 day, GTC durahioms
Lonjer duwdons FREE! $0.15 Lower fee! $0.15 Lower fee! $0.15 Lower fee! $0.15 Lower fee! $0.15 Lower fee! $0.15 Lower fee!
Figure 3: Insertion fees for fixed price listings for "Books, Music, DVD, Movies and Video games"
1-Insertion Fees for Fixed Price listings (effective 9/16/08)
Stareg or Reserve Carreat Inserion New Iseriim Fee prie Fee 3,5,7,10,30 day, GTC
duratioms
Longer dawdons FRIE!
$1.00 - $9.99 $0.35 $0.35
$10.00 - $24.99 $0.55 $0.35 Lower fee!
$25.00 -$49.99 $1.00 $0.35 Lower fee!
$50.00 - $199.99 $2.00 $0.35 Lower fee!
$200.00 -$499.99 $3.00 $0.35 Lower fee!
$500.00 or more $4.00 $0.35 Lower fee!
F-Figure 4: Insertion fees for fixed price listings for "other categories"
"Buy it now" pricing < 5000 or more149.99
< $24.99 <S9.99 0.25 0.2 0.15 0.1 0.05 0 2002 2004 2006 2008 2010 2012 2014 2016 Year tier pricing
21
Fixed price listing fee in stores
- Basic - Premium - Anchor 0 0.15 0 0.1 aJ - 0.05 0 2002 2004 2006 2008 2010 2012 2014 2016
Figure 6: Fixed price listing fee in subscription stores
Insertion Fee foi
2008 In Year 2001 2002 2003i 2004 2005, 2006 2007 2008 december
Basic NA NA NA NA NA NA NA NA NA Premium NA NA NA NA NA NA NA NA NA Anchor NA NA NA NA NA NA NA NA NA 2009 20101 2011 2012 2013 20141 2015. 2016 2017 NA $0.20 $0.20 $0.20 $0.20 $0.20 $0.20 $0.20 $0.20 NA $0.05 $0.05 $0.05 $0.10 $0.10 $0.10 $0.10 $0.10 NA $0.03 $0.03 $0.03 $0.05 $0.05 $0.05 $0.05 $0.05
Figure 7: Insertion fees for fixed price items in stores
The novelty of online auctions had waned and eBay rivals like Amazon were giving it tough competition with their strong fixed-price offerings (Sage, 2008). Hence the move from auction to fixed price was intended to help eBay compete more effectively with Amazon.com and other big online retailers. eBay used the above-mentioned changes in its pricing to encourage sellers to use the fixed price format. The announcement was also timed to increase sales during the holiday shopping season in 2008 and aimed at reducing its dependence on its auction business, which was growing
more slowly than fixed-price sales.
Following the move towards fixed price format, recommending a price at which an item will likely sell was critical for eBay to sell products. If the price were too high, then nobody would buy the product and everyone would make less money (eBay usually receives both an up-front listing fee, and a commission on the sale; the seller only receives money if the item sells). So, the overall platform makes less money. Moreover, if sellers might go elsewhere because items don't sell, or they won't list the next item. But if the buyer ends up buying the product then the seller now gets money, eBay would have the buyer's payment on file and their email address, and both buyer and seller would have reason to buy and sell something else again. Hence to facilitate this price setting, eBay had many tools to help the seller set the price such as advanced search that helped a seller determine a fair value for the product by using the data from previously sold items.
eBay also made changes to its search ranking algorithm to favor the fixed price format. In February 2008, eBay changed its search ranking algorithm. Instead of displaying the soonest-to-end listing at the top - a natural strategy for auctions with a fixed ending time, but less natural for posted price listings - it implemented a relevance ranking. Then in September 2008, eBay allowed 30 day posted price listings to be "rolled over" with automatic payment of the monthly listing fee. This marked the huge shift of the platform from auction strategy to fixed price strategy.
3.5.2 Simplified final value charges
Year 2010 changes
Since the beginning of the platform eBay had various "tranches" or levels or tiered for final value fees until 2010. For example, in 2010 (Figure 8), Sellers paid a higher rate (8.75%) on the first $25 of the closing price, a lower fee (3.5%) on the amount between
Final Value Fi
Closing Price Item not sold
So.01 -S25.00" $25.01-$1,000.00 Equal to or Over $1000.01
es: Auction style
Final Value Fee No Fee
8.75% of the closing value
8.75% of the initial $25.00 ($2.19). plus 3.50% of the remaining closing value balance(525.01 -51.000.00) 8.75% of the initial $25.00 ($2.19), plus 3.50% of the initial $25.01 - $1,000.00 ($34.12), plus 1.50% of the remaining closing value balance(S1000.01 - closing value)
Figure 8: Final value fees for auction style in 2010; Source: eBay
eBay in 2010 introduced free auction listings and dramatically reduced listing fees for fixed-priced auctions. These changes were made to make eBay.com pricing simpler and align eBay's success with its sellers in a success based pricing strategy. They changed the tier based final value fees to a final flat fee of 9% on the sale price and never more than $50 dollars (Figure 9).
Final Value fees
2008 in
Year 2001 2002 2003 2004 2005 2006 2007 2008;december 2009 20101 2011 2012 2013 2014 2015 2016 2017
Closing Closing Closing Closing Closing Closing Closing Closing Closing Closing Sale Sale Sale Sale Sale Sale Sale Sale
Type value value value value value value value value value value price price price price price price price price
$0-$25 5% 10% 5.25% 5.25% 8% 5.25% 5.25% 5.25% 8.75% 8.75% 9.00% 9.00% 9.00% 10% 10% 10% 10% 10% 5.25% 5.25% 5.25% 5%+ 10%+ + + 8%+ 5.25% + 5.25%+ 8.75%+ 8.75%+ $25- $1,00 2.5% 7% 2.75% 2.75% 5.00% +3% 3.25% 3.25% 3.50% 3.50% 9.00% 9.00% 9.00% 10% 10% 10% 10% 10% 10%+ 5.25% 5.25% 5.25% 5%+ 7%+ + + 8%+ 5.25% + 5.25%+ 8.75%+ 8.75%+ $100-1000 2.5% 5% 2.75% 2.75% 5.00% + 3% 3.25% 3.25% 3.50% 3.50% 9.00% 9.00% 9.00% 10% 10% 10% 10% 10% 10%+ 5.25% 5.25% 5.25% 5%+ 7%+ + + 8%+ 5.25% + 5.25%+ 8.75%+ 8.75%+ 2.5%+ 5%+ 2.75% 2.75% 5.00%+ + 3%+ 3.25% 3.25%+ 3.50%+ 3.50%+ Over $1,000 1.25% 3% + 1.50 +1.50 3.00% 1.50 +1.50 1.50 1.50% 1.50% 9.00% 9.00% 9.00% 10% 10% 10% 10% 10%
Figure 9: Final value fees for no store listings over the years
They also gave 100 free listings per month for items that start with a price of 99 cents or less after which the seller will pay a flat fee of 9% of the sale price and never more than $50. The new fee structure made the auction format cheaper for small sellers and fixed-price sales less expensive for larger vendors. (Morrison, 2010). This price change was only for the sellers without a store on eBay. Final value fees for store sellers were still complicated with several levels. (Figure 10)
Final Value feesfor forst
Year
TQ7I
2 2007 2008 1ecember 2009 2010: 2011 20121 2013 20141 2015 20161 2017 8.75 %10%of 10%of 12%of 12%of of
closing closing closing closing closing 7.5% 7.5%
$0 - $25 NA NA NA NA NA NA value value value value value (0-50) (0-50) NA NA NA NA NA 7.5% 7.5% (0-50)+ (0-50) + 4% 4% 10%+ 10%+ 12%+ 8.75%+ (50-1000 (50-100 $25-$1,00 NA NA NA NA NA NA 7% 7% 12%+8% 8% 4% ) 0) NA NA NA NA NA 7.5% 7.5% (0-50) + (0-50) + 4% 4% 10%+ 10%+ 12% + 8.75%+ (50-1000 (50-100 100-1000 NA NA NA NA NA NA 7% 7% 12%+8% 8% 4% ) 0) NA NA NA NA NA 10%+ 10%+ 12% + 7.5% 7.5% 7%+5% 7%+5% 12%+8% 8%+4% (0-50)+ (0-50)+
(upto (upto + 4% (upto (upto 4% 4%
1000) + 1000) + 1000) + 1000) + 8.75%+ (50-1000 (50-100
over $1,000 NA NA NA NA NA NA 3% 3% 2% 2% 4%+2% )+2% 0) + 2% NA NA NA NA NA
Figure 10: Final value fees for stores over the years
Year 2013 changes
eBay announced in 2013 that for sellers who sell only a few items a year, eBay offered
50 free listings per month (Rao, 2013). If the item was sold, the company took 10 percent
of the sale price (Figure 9). eBay further simplified its final value fees for stores based on each sale determined by the product categories. Hence, they discontinued the price structure shown in the Figure 10 to a simpler version for the stores. The fees until 2013 was based on the item's price and the new final fees ranged from 4 percent to 9 percent, depending on the product category. The new price structure is shown in the Figure 11.
___ Final Value fees for stoi
Ydecemt
Year 005 2006 2 2008 er 20091 2010 2011! 2012 2013 2014 2015 20161 2017 Coins & Paper Money,
Stamps IA NA NA NA NA
Musical Instruments & Gear A NA NA NA NA
Motors Parts & Accessories A NA NA NA NA
Computer/Tablets & Netw6rking and Video
Game Consoles 'A NA NA NA NA
Camera & Photo Accessories, Cell Phone
Accessories, and more A NA NA NA NA
Consumer Electronics,
Cameras & Photo, and more A NA NA NA NA
Clothing, Shoes &
Accessories A NA NA NA NA
Books, DVDs &
Movies,Music,Video Games A NA NA NA NA
Business & Industrial A NA NA NA All other categories A NA NA NA NA
NA NA NA NA NA NA NA NA NA NA NA NA NA NA NA NA NA NA NA NA NA NA NA NA NA NA NA NA NA NA NA NA NA NA NA NA NA NA NA NA NA NA NA NA NA NA NA NA NA NA NA NA 6% 6% 6% 6% 7% 7% 7% 7% 8% 8% 8% 8% NA NA NA NA 4% 4% 4% 4% NA NA NA NA 9% 9% 9% 9% NA NA NA NA 6% 6% 6% 6% NA NA NA NA 9% 9% 9% 9% NA NA NA NA NA NA NA NA NA NA NA NA 9% 9% 9% 9% 9% 9% 9% 9% 9% 9% 9% 9% 6% 7% 8% 4% 9% 6% 9% 9% 9% 9%
Figure 17: Final value fees for stores based on product category
EBay's made this move as sellers on Amazon's marketplace become increasingly upset with fee increases. In the new fee structure announcement, they also included a table comparing their charges to Amazon's fees (Figure 12). This was also the first time that eBay offered free listings to the sellers.
De*Wo & Af4n.Onee ~mmkosmfat Mai uW&ssad Mosasfte&Aee~e Cel PheaAeemadm 4% Pevsonal Computer 6% 6% 4.% CAme Ue..e 3% 1% 6% 3% 6% 3% 3% LOS 72% 72% % n2% I.
Avimmewe Pft & Amse1e
Ch~q~uedinSIuus Sp-e aulhene e h~uby 3% 12% U6% 3V~%jjR%"**e
Plane. -af aft eaeftmim de see m@Ns up emaevm w1f Amin enkgutee
Figure 72: Final value fees for eBay vs Amazon
The summary of the changes made to both Non-store merchants and storefront were as follows:
Non-store merchants - Insertion fee ($0.50) + final value fees (depending on amount of
item) and maximum 10% capped at 250 + 50 free listings.
Merchants with storefront - insertion fee (based on store) + monthly subscription fee +
final value fee based on category + 2500 free listing/ month. (eBay, springupdate2013, 2013)
listing fees, one reason why its marketplace had gained strongly against eBay. But the complexity of eBay fees was keeping the sellers from transacting on eBay and preventing them from having full transparency into profitability. To help sellers decide on which pricing to choose (between fixed price and auction based) eBay also had an online fee calculator that takes input the various categories and outputs the final fee that the seller is expected to pay.
http://pages.ebay.com/sellerinformation/news/Feellustrator21 O.html
3.6 Overall findings
1. Though eBay started off as an auction platform, based on its platform data it
moved to a fixed price format and evolved its pricing to favor the fixed price format.
2. To keep up with competition from several e-commerce sites and Amazon, it simplified its pricing structure and provided sellers a platform to easily sell their products without any hassle.
These changes show that the market conditions and competition play a major role in the pricing strategy of a firm and they influence a firm to modify existing strategies.
4. Uber as a platform
4.1 Background
Uber was founded by Garrett Camp, Oscar Salazar, and Travis Kalanick, and was launched in 2010 in San Francisco. In late 2008, Kalanick attended the LeWeb technology conference with Vayner Media's Gary Vaynerchuk, StumbleUpon founder Garrett Camp, and Camp's former flame Melody McCloskey. It was during this conference that he first heard the idea for Uber.
It is said that on one New Year's not long before, Camp and a few friends had spent $800 hiring a private driver. While Camp made a fortune selling StumbleUpon, he still felt that a grand was too steep a price for one night of convenience. He mulled over ways to bring down the cost of black car services ever since. He realized that splitting the cost with a lot of people - say a few dozen elite users in Silicon Valley could make it affordable. The idea morphed into Uber, essentially a premium service for more high-end customers. (Shontell, 2014). So, when Uber was founded it started off only with 'black cars', i.e. private limos. In 201 2, Uber launched the UberX program which allowed almost anyone to sign up as a driver. This greatly increased Uber's popularity and contributed to Uber being one of the fastest growing and most valuable startups in the market.
can launch the smart phone app and instantly finds limos equipped with the service. One click hails them, Uber advertises the job to nearby drivers and the nearest driver comes and picks the user up. At the end of the journey, the driver charges your account. No standing in the rain trying to hail a cab. No grabbing for cash or fiddling with credit cards.
Uber thus positioned itself for the time-sensitive rather than price-sensitive consumer. Its rates were higher than of a regular taxi, but the fast response drove the value for consumers. Uber currently operates in 633 cities worldwide (Wikipedia, 2012). The reason for such an expansion was the platform's network effects that facilitated its growth. A simple network effects model for Uber's growth as a platform can be represented as follows:
Lower
More
Prices
Demand
Less Driver
Faster
Downtime
Pickups
More
Geographi
Coverage
Saturatio
More
Drivers
c / n1Figure 73: Uber network model. Source: David Sacks Twitter account
Figure 13 shows the Uber's network model where each arrow represents a positive value transfer. The diagram shows that drivers are motivated by more demand from riders. More drivers on the platform leads to more geographic coverage which in turn leads to faster ride pickups. Since there is high geographic coverage, there is less driver downtime leading to lower prices. For this virtuous cycle to propel Uber's growth, it must make sure there are more drivers on the platform to serve customers at low prices and more demand to keep the drivers returning to the platform. Uber has used several pricing strategies to reap the benefits of this virtuous cycle as described in the next few sections of the thesis.
4.2 Data collection
Uber's pricing data from 2001 to 2017 was collected from the internet archive. Various levels of service and geographic pricing data was collected. "Fine prints" under the pricing data were also collected to understand Uber's strategy changes. With the help of literature research and the data collected, the changes to Uber's pricing strategy were analyzed. The overall spreadsheet data for Uber can be found here: http://bit.ly/2xzVTQn
4.3 Initial pricing structure
Like any other two-sided market, Uber enlarges its network by subsidizing one side of the market (drivers) and charging the other side the full price (riders) (Tirole & Rochet,
2006). Specifically, car owners pay nothing to register and switch on their availability on
the Uber mobile app and Uber charges its passengers for their rides. In the beginning, Uber charged passengers based simply on time and distance, much like a taxi meter. They had the pricing structure as shown in Figure 14:
" A base price
" The cost incurred per mile (distance) " The cost for idle minute (time)
0 A minimum charge that a user would be charged for any ride.
Uber had flat rates for special cases such as routes between cities or for routes between the city and the airport.
When the ride is over, Uber will automatically charge your credit card on file. No cash is necessary. Please thank your driver, but tip is already included. Uber's fare is comprised of a time and distance calculation:
$4.90
+
9
+per mile idle minute
=
Uber fare
$15.00 minimum. NO TIP NECESSARY -included in the fare.$65.00 flat rate between San Francisco International Airport (SFO) and San Francisco. $85.00 flat rate between Oakland International Airport (OAK) and San Francisco.
Figure 14: Uber's pricing in Jan 2071, Source: uber. com from 2077
4.4 Pricing evolution
The taxi meter pricing that was followed in the initial days was soon improved to accommodate the market conditions and changes to demand and supply on the platform. The first change was the introduction of dynamic pricing strategy discussed the following section.
$8.00
4.4.1 Dynamic pricing strategy
Uber is fundamentally a marketplace, which means that the supply of cars on its platform is controlled not by the company but by the legion of independent contractors and transportation providers with whom they work. Uber's drivers are all independent agents that are either self-employed, or work for someone who owns multiple cars. Uber does not own cars and does not employ drivers. Each day, and each hour these drivers decide whether to open the Uber application and accept requests for rides from Uber customers. These drivers are not bound by exclusivity and so many of them work on multiple services, and even have regular customers that they engage off the Uber platform. This means the supply on the platform is not constant and demand fulfillment depends on the number of drivers working at any given time.
December 2010:
On the New Year's Eve, Uber knew that they would be overwhelmed with demand. To make sure cars are always available for customers and to incentivize the drivers to come on road, Uber raised their existing rates to 2X to be able to offer rides to as many people. (Jen, 2012). This was the first time it implemented "Surge pricing".
January 2012:
Uber noticed that on Friday and Saturday nights in Boston, it experienced a spike in unfulfilled requests. The root cause for this was that the drivers were clocking off to go home creating a supply-demand imbalance. This resulted in a lot of unhappy customers. So, they ran an experiment where they offered drivers a higher price to stay on the system longer. (Gurley, 2014) They confirmed that higher prices increased on road supply of drivers by 70-80% and eliminated two-thirds of the fulfilled requests. The supply curve for Uber was highly elastic and drivers were motivated by price to stay longer. Increase in Demand % $ D -- --- ---- 0' E, E I N D $ 0 0, Quwntity demanded and
supphed (in units)
* Nw Equilibrium
is determined at E,
* Equilibrium PVke
rises from OP to OP,
1 Equilibrium Quantity
rises
from OQ to O1x
Figure 15: Demand supply curve: Increase in demand 08
Y
P,
Using the supply and demand curve in Figure 15 as a model, Uber's dynamic pricing model can be easily explained. When demand outstrips supply, dynamic pricing algorithms increase prices (P to P1) to help the market reach equilibrium (E1). Since
these situations are always temporary, eventually supply outstrips demand as more drivers are encouraged to come onto the road and as the supply opens, the price falls back to normal (Figure 16). If demand were to spike with no resulting price increase it would result in an economic shortage. Without a price increase, Uber's unfulfilled rate would skyrocket, and most customers would be left without a ride. More absolute rides are fulfilled precisely because supply increases.
Y DS * ~* E P - -- E 101 S D, S' i D S 0
New Equilibrium
is determined
at E,
EquilIblrum Price
remains
same at
OP
Equilibdum Quantity
rises from O to
00
1X
demanded and supplied (units)
Figure 76: Demand and Price increase
0~
Dynamic pricing had been implemented by several industries such as airlines, hotels and rental cars. Except in Uber's case, the supply (Drivers) is not fixed. While hotel rooms and airplane seats are fixed, Uber's supply shrinks at times such as in the Boston weekend nights' situation, because the drivers would prefer not to be working at those times. The exact events that increase demand for needing a driver also causes supply to shrink. In these cases, the supply curve is moving left at the exact same time that the demand curve is moving right. As a result, the need for a price catalyst to increase supply in the Uber case is vital.
Thus, Uber implemented its dynamic pricing policy to be used when demand is materially outstripping supply. Dynamic pricing changes are currently driven algorithmically when wait times increase dramatically, and "unfulfilled requests" start to rise. This means that the fare a rider sees is based on variables subject to change over time. These variables include (but are not limited to) the estimated time and distance of the predicted route, estimated traffic, and the number of riders and drivers using Uber at a given moment (Uber, 2016). The pricing structure now looked as follows:
* A base price
" The cost incurred per mile (distance)
" A minimum charge that a user would be charged for any ride.
* Surge pricing of X times the total
Uber accomplished two functions with this increased price model. One was an increase in supply that got more cars onto the platform. The other thing was that the price increase temporarily reduced demand resulting in less fulfilled rides and maximizing the number of completed rides. Uber observed that the converse of "Surge pricing" was also true for the platform. As mentioned by Uber's CEO Travis (Angelova, 2013), a price decrease on the platform resulted in materially increased demand. Uber thus rewarded the drivers by dynamically pricing fares paid by ride hailers based on real-time supply and demand conditions. The drivers who serve busy areas get paid more and it helped to direct drivers' attention to where they are needed most, which helps users.
By 2012 Uber started issuing a statement on its pricing page under fine print (Figure 17)
to inform the customers of the changes in its pricing.
Tip is included in the price. -Flat rates apply to direct trips between specified locations. Additional stops may result in a higher fare. -Applicable tolls and surcharges may be
added to your fare. -At times of intense demand, our rates change over time to keep
Figure 17: Fine print on the Uber pricing website in Sept 2072
They also educated the customers by sending emails to registered users, tweeting about it from their account and answering questions on Quora. Uber tried to be as pro-active as possible in communicating to the customer about the dynamic pricing (Jen, 2012). When a rider hails a cab, to ensure that he is aware of the price increase they showed a screen (Figure 18) or sent a text that alerted him of any increase in price. The user had to hit the "OK" button before he/she could go to the next screen and a car is dispatched at the "surge" price.
New
Year's Eve Surge Pricing
Current rates are 6.25x higher tha normal to maintain
availablity. Clck OK to request a
car.
Check again In a bt for cheaper
UCo"
Figure 18: Uber Surge price screen
Customer reaction/backlash:
Taxis charged people based on the time and distance. For decades, people were used to that concept. Charging prices dynamically based on supply and demand conditions was new to customers. Because of high demand and the accompanying ever-higher prices, Uber's supposedly simple and straightforward transaction now became complex. Consumers saw that their ride home could be seven times the price of their
became (reasonably) upset when the bill arrived. Either way, they weren't happy. To satisfy one side of its market - the taxi drivers - Uber upset the other side - its customers. People have protested that it exploits them during emergencies and holidays.
On New Year's Eve 2011, prices soared to as much as seven times standard rates with
a minimum fee of $175, fueling negative feedback from users (Shah, 2012) (Hughes, 2012). Even fixed rate routes were dynamically priced (Gallagher, 2012) and this led to customers expressing their anger on various social media platforms. Surge pricing triggered outrage again during a snowstorm in New York in December of 2013. Uber has been criticized for its extreme surcharges during emergencies such as Hurricane Sandy (Bosker, 2012), the 2014 Sydney hostage crisis (Mazza, 2014), and the June 2017 London Bridge attack (News, 2017), especially when taxis offered to transport riders for free; however, in many cases Uber later refunded surcharges incurred by riders during these events. In 2014, Uber announced that it would not implement surge pricing during emergencies in the United States (Popper, 2014). More recently Uber committed to cap surge pricing during several blizzards in New York City (Blystone, 2017).
4.4.2 Up-front pricing system - 2016:
Until 2016, Uber showed users the per mile or the per minute charges for each of its cars and left the price estimation job to the user. It notified its customers of surge when the
prices are higher than the quoted per mile charges (Figure 19).
0eeoo AT&T LTE 5:10 PM 1 94%111 X SURGE PRICING
Demand is off the charts! Fares have increased to get more Ubers on the road.
I
$9 MINIMUM FARE $0.52 / MIN $2.60 / MILESAVE UP TO 50%, TRY uberPOOL
NOTIFY ME WHEN SURGE DROPS
Figure 19: Uber Surge price screen in 2075
But in June 2016, Uber detailed in a blog post that it introduced a new pricing system where passengers in major markets are now required to enter a destination, and the fare they're quoted is a guaranteed price for that ride. Uber stopped showing the rider how much surge pricing is going on as in Figure 19. Instead on surge rides, the app now says, "fares are higher due to increased demand" (Figure 20). Uber also removed the option to notify riders when surge pricing stopped. It thus replaced the original system, which was still ultimately based on time and distance, with an "upfront" pricing model that asks riders to agree to a price when they book a ride, but it also decoupled driver earnings from what passengers paid and still pays drivers based on minutes and miles.
Economy
Fares are higher due to increased demand
POOL T 164.43 Pm Paytm uberGO i 248.80 O Mc uberX i 248.80 , 1-4
Figure 20: New surge pricing format
By guaranteeing customers a certain fare before they book, the company said it provides
more transparency. Uber said that the Upfront fares are calculated using the expected time and distance of the trip and local traffic, as well as how many riders and nearby drivers are using Uber at that moment. However, drivers are still paid a metered fare based on actual miles and minutes, and cannot see the passengers' fare.
Criticism:
When Uber implemented this upfront pricing, it had not informed its drivers about this decision. The drivers received the exact right amount based off mileage and time, but
upfront fare. With upfront pricing, Uber was found to have systematically overcharging passenger and not sharing the revenues with the drivers (Perea, 2016).
Your Last Trip NEEDHELP7
September 22, 12:34 PM BERNL HEIGH
/
V HUNTERS POINT ISITACI VALL FME $19.20 uber a uRate your trip
THURSDAY, 09/22
US$12.65
TRIP EARNINGS
Fare US$15.81
Uber Fee -US$3.16
Estimated Payout USS12.65
0 Daly City, CA 940152 USA
0215 Lane St, San Francisco, CA 94124. USA
(D
1W My
Figure 21: Uber upfront pricing overcharging the passenger
Figure 21 shows how a passenger was charged an upfront fee of $19.20 while the driver was only paid $12.65 and he was shown that the fare was $15.81. The following was the breakdown of this ride:
. Driver's payout: $12.65
* Uber booking fee: $1.55 (Uber started charging booking fee for all rides starting 2013) (Dough, 2016)
* Driver Received: $15.81 (Gross) " Passenger (me) Paid: $19.20
- Uber kept $1.84 difference
Uber was giving the passenger a projected fare based on its calculations and charging the driver based on the actual ride. But the difference between the actual ride price and the upfront price estimated was being kept by Uber.
Harry Campbell, founder of The Rideshare Guy blog popular among drivers, calculated the difference between the fares riders paid and that being reported to drivers across
165 rides. The largest sample of 82 UberX rides showed the ride sharing app pocketed
an extra $162.56. UberPool rides, however, were a huge source of financial loss. Over 49 UberPool rides, the company lost $108, according to The Rideshare Guy's calculations. Factoring in the extra $30.98 from a combined 34 rides through UberX VIP, UberXL, UBerBlack and UberSUV, the company profited $85.54 across 165 rides. Based on back of the napkin estimates, The Rideshare Guy calculated Uber could be making an additional $7.43million each month, just in New York alone (Campbell, 2017).
UberX
UberPOOL
UberXL
UberBlack
UberSUV
UberX VIP
Sum
$162.56
-$108.00
$5.84
$5.38
$14.56
$5.20
$85.54
82
49
16
11
3
4
165
Figure 22: Uber's extra earnings from 765 NY rides Source: The Rideshare Guy blog
Uber however declined to disclose what the company's data showed about the fare discrepancy, and whether Uber was profiting from the difference. "There are times when the rider fare is higher or lower than what a driver earns," it said (Hook, 2017). But they declined to comment on whether upfront pricing has made or lost money for Uber since
4.4.3 Price discrimination or "Willingness to pay" - 2017:
Uber had initially been charging the customers based on time and distance. Then Uber started estimating how much a ride would cost and showed an upfront pricing. Now in 2017, it introduced/launched a more sophisticated version on surge pricing called "route-based" pricing. It's a break from the past, when Uber calculated fares using a combination of mileage, time and multipliers based on geographic demand.
Fares are now calculated based on what customers are "willing to pay" (WTP describes the maximum amount a consumer wouldpay for a product or service.), based on factors such as destination location etc. (Tongo, The economics behind Uber's new pricing model, 2017). It means that Uber calculates riders' propensity for paying a higher price for a particular route at a certain time of day. (Griswold, 2017). For instance, someone traveling from a wealthy neighborhood to another tony spot might be asked to pay more than another person heading to a poorer part of town, even if demand, traffic and distance are the same. Uber is basically charging higher prices to customers who it thinks will be willing to pay more. The company uses the massive fine grained data it collects on customers and demand to make educated guesses about individual price sensitivity. It applies machine-learning techniques to estimate how much groups of customers are willing to shell out for a ride. Their sophisticated neural network system
takes several factors like booking location, destination, previous history, trends, dependency, etc. into account before calculating the estimated fare for each customer.
Uber confirmed that the company is not just raising fares when the demand for rides exceeds the supply of drivers, but is also charging higher prices to customers who it thinks will be willing to pay more (Newcomer, 2017). This kind of pricing is known as "Price discrimination". Price discrimination has been used in the industry previously by Airlines and other e-commerce companies. Some of the examples are as follows:
1. The airline industry has been implementing price discrimination for decades.
They price discriminate almost every aspect of the ticket fare by considering factors such as route, type of seat booked, time of a booking etc.
2. Cheap movie tickets on certain days of the week are another example of price discrimination that charge customers based on when they watch the movie.
3. Amazon in early 2000s used price discrimination to offer goods at lower prices
to people identified as new customers (Ramasastry, 2005).
This pricing strategy allows companies to extract more revenue from consumers while simultaneously expanding the market (Tongo, The economics behind Uber's new pricing model, 2017). The difference between what the company charges a customer and what
the customer will pay is called the "consumer surplus. Price discrimination allows companies to take all the consumer surplus and transfer it to themselves.
Price discrimination is a practice of charging different "types" of customers different prices for the same product or service. A company needs to understand the price sensitivity of individual groups of customers to be able to implement such a model. Economists generally refer to three types of price discrimination - first degree, second degree, and third degree.
" First degree- Each consumer paying the maximum price they are willing to pay
and the firm extracting all their WTP.
" Second degree - Providing discounts on bulk purchases.
* Third degree - selling the same good or service to different segments of a
market, based on WTP.
It is this third type of price discrimination that Uber is adopting. The data that Uber collects is not yet granular to do first degree discrimination but is still based on "groups of customers" rather than individuals. They are separating based on route, and some routes are clearly more popular with higher-income customers (and that is why it is effective to price discriminate). But Uber's trend is clearly in the direction of price
discrimination at the individual level. Price discrimination would in theory increase Uber's customer base by charging less to lower income passengers who might normally find Uber's fares too high, and more to higher income people who can afford the extra cost. Decoupling driver earnings from rider payments also means Uber can keep prices low in lower-income neighborhoods without worrying that drivers will avoid those pickups because they pay too little.
Uber is trying to increase its revenue and build a sustainable business, Daniel Graf, Uber's head of product commented about Price discrimination. "Pricing will always evolve," Graf said. "Our goal is still the same: more trips, more affordable, more reliable on the rider's side. On the driver's side, we want to give you reliable earnings with context." (Carson, 2017). They also addressed the drivers' concern about the gap in the fare the rider pays and what the driver receives by reporting the price a passenger pays on each ride. The company sent its drivers an updated terms of service agreement reflecting the new fee system.
Response to price discrimination:
People have taken to social media to express criticism and avoiding Uber for price discrimination. Customers also are complaning that the new pricing seems to target people who are well-off and already willing to pay pricier UberX fares.