Perceived priorities for prevention: change between 1996
and 2006 in a general population survey
Jean-Franc¸ois Etter
Institute of Social and Preventive Medicine, University of Geneva, CMU, Case Postale, CH-1211 Geneva 4, Switzerland Address correspondence to Jean-Franc¸ois Etter, E-mail: [email protected]
A B S T R AC T
Background We assessed change between 1996 and 2006 in the opinions of the general public on priorities for the prevention of health problems.
Methods Postal questionnaire surveys in 1996 and 2006, in representative samples of the general population of Geneva, Switzerland. Participants indicated, for each of 13 health problems, a priority rating for the spending of prevention resources.
Results There were 742 participants in 1996 (response rate 75%) and 1487 in 2006 (response rate 76%). According to participants, in 2006, resources should be spent, with priority, for: the prevention of sexual abuse of children (67% answered ‘high priority’), illegal drugs (58%), AIDS (55%), tobacco smoking (45%), road traffic accidents (43%), alcoholism (42%), family violence (42%), suicide in young people (39%),
mammography screening for breast cancer (37%), abuse of medications (27%), cannabis use (24%), poor diet (22%) and lack of physical activity (20%). Between 1996 and 2006, the largest change was observed for tobacco smoking (þ18.6% answered ‘high priority’), poor diet (þ11.4%), lack of physical activity (þ10.8%) and AIDS ( –10.8%, P , 0.001 for all change scores).
Conclusions Smoking, poor diet and lack of physical activity were more likely to be perceived as priorities in 2006 than in 1996, whereas priority ratings decreased for AIDS. The prevention of sexual abuse of children was perceived as the highest priority by all respondent groups.
Keywords AIDS, community surveys, prevention, public opinion, smoking
Introduction
The main modifiable causes of death in the United States are, by far, tobacco (435 000 deaths annually) and poor diet and inactivity (365 000).1 Other important causes include alcohol (85 000 deaths), motor vehicles (43 000 deaths), sexual behavior (20 000) and illicit drugs (17 000).1Mortality from these causes could largely be prevented by adequate prevention and education measures, by structural changes, or by a wider delivery of clinical services. A recent review showed that the following five clinical services would produce the largest impact on mortality, if 90% of the target populations were covered: tobacco-use screening and brief intervention, colorectal cancer screening, influenza vaccine in adults, breast cancer screening and cervical cancer screening.2 In spite of the wealth of health information now available to the public, it is not clear how the public ranks prevention services in terms of priorities. It is important to know how the public perceives the relative importance of prevention measures and services, because this will determine their acceptability, usage and impact. In a democracy, public
opinion may also influence the allocation of resources. Because of limited resources, physicians, policy-makers and insurance companies need to choose among preventive ser-vices and between preventive and curative serser-vices. Ideally, these choices should primarily be based on science, in par-ticular on cost-effectiveness studies, and on the perceived needs of the public, even though in reality, political decisions may deviate from this ideal.3,4The aim of this study was to assess the general public’s opinions about which health pro-blems should receive prevention funds in priority, and to assess change between 1996 and 2006 in these opinions.
Methods
We conducted two mail surveys, the first in 1996 and the second in 2006, in two cross-sectional, representative samples of the general population of Geneva, a mostly
Jean-Franc¸ois Etter, Senior Lecturer in Public Health
urban canton of French-speaking Switzerland. The intended samples included 1000 people in 1996 and 2000 people in 2006, aged 18 – 70 years. The samples were drawn at random from the publicly available part of the population register of Geneva. This part of the register includes 86% of the population and excludes the personnel of the United Nations and other international organizations, diplomats, elected politicians and people who asked not to be listed. Non-respondents received up to five reminder mailings. The questionnaires covered tobacco and alcohol use, opinions about prevention measures and demographic characteristics.
We also asked the following question: ‘Resources available to prevent health problems are limited. Your opinion is useful to identify domains for which prevention resources should be attributed. Please indicate the domains that you think are a priority’, followed by a list of 11 items in 1996 and 13 items in 2006 (the questions on sexual abuse of children and on cannabis use were asked in 2006 only) (Table 1; Fig. 1). For each item, answers were given on 5-point Likert scales ranging from 1 ¼ low priority to 5 ¼ high priority. A sixth response option read: ‘No opinion’. We present unadjusted results, as well as differences between 1996 and
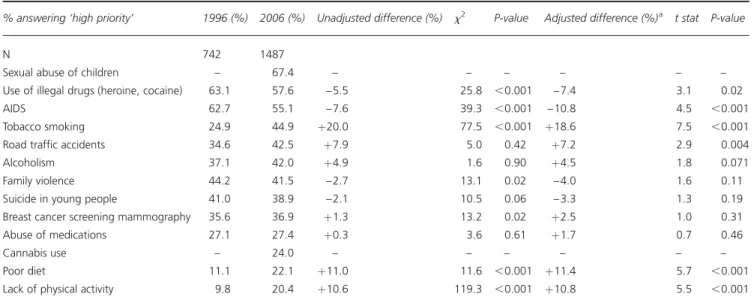
Table 1 Perceived priorities for prevention funding, general population, Geneva, 1996 – 2006
% answering ‘high priority’ 1996 (%) 2006 (%) Unadjusted difference (%) x2 P-value Adjusted difference (%)a t stat P-value
N 742 1487
Sexual abuse of children – 67.4 – – – – – – Use of illegal drugs (heroine, cocaine) 63.1 57.6 – 5.5 25.8 ,0.001 – 7.4 3.1 0.02 AIDS 62.7 55.1 – 7.6 39.3 ,0.001 – 10.8 4.5 ,0.001 Tobacco smoking 24.9 44.9 þ20.0 77.5 ,0.001 þ18.6 7.5 ,0.001 Road traffic accidents 34.6 42.5 þ7.9 5.0 0.42 þ7.2 2.9 0.004 Alcoholism 37.1 42.0 þ4.9 1.6 0.90 þ4.5 1.8 0.071 Family violence 44.2 41.5 – 2.7 13.1 0.02 – 4.0 1.6 0.11 Suicide in young people 41.0 38.9 – 2.1 10.5 0.06 – 3.3 1.3 0.19 Breast cancer screening mammography 35.6 36.9 þ1.3 13.2 0.02 þ2.5 1.0 0.31 Abuse of medications 27.1 27.4 þ0.3 3.6 0.61 þ1.7 0.7 0.46
Cannabis use – 24.0 – – – – – –
Poor diet 11.1 22.1 þ11.0 11.6 ,0.001 þ11.4 5.7 ,0.001 Lack of physical activity 9.8 20.4 þ10.6 119.3 ,0.001 þ10.8 5.5 ,0.001
aDifferences adjusted for age, sex and school years in multivariate linear regression models.
2006 after adjustment for age, sex and school years in multi-variate linear regression models (Table 1). We used t-tests to compare means, x2 tests to compare proportions and x2 tests for trend to assess linear trends. The surveys were approved by the Geneva ethics commission for research in public health.
Results
We collected 742 questionnaires in 1996 (75.2% of 987 valid addresses) and 1487 in 2006 (76.5% of 1945 valid addresses). The average age was 42.3 years in 1996 and 41.0 years in 2006 (t ¼ 2.5; P ¼ 0.014), the proportion of men was 48% in 1996 and 55% in 2006 (x2¼ 9.7; P ¼ 0.002), and the average number of school years was 13.4 in 1996 and 15.3 in 2006 (t ¼ 9.8, P , 0.001).
In 2006, the prevention of sexual abuse of children was perceived as the highest priority (Table 1). The use of illegal drugs and AIDS came next, followed by tobacco smoking and road traffic accidents. The areas least perceived as priori-ties were cannabis use, poor diet and lack of physical activity. The largest increases in priority ratings between 1996 and 2006 were observed for tobacco smoking (after adjustment, þ18.6% answered ‘high priority’), poor diet (þ11.4%), lack of physical activity (þ10.8%) and road traffic accidents (þ7.2%). The largest decreases were observed for AIDS (– 10.8%) and illegal drugs ( –7.4%) (Table 1). Differences between 1996 and 2006 were not substantially affected by adjustment for age, sex and school years (Table 1).
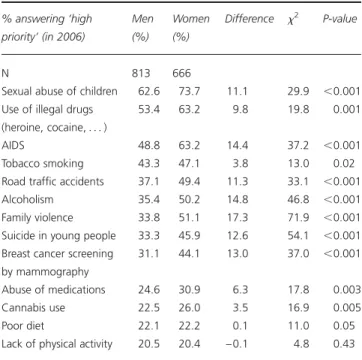
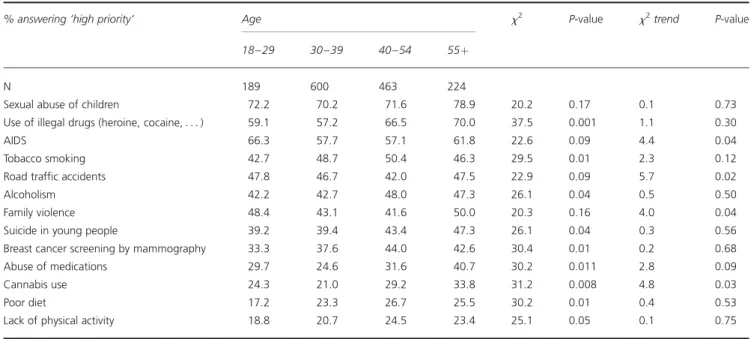
In 2006, the largest differences between the answers of men and women concerned family violence, alcoholism, AIDS, mammography screening, suicide in young people and road traffic accidents, which were all rated higher in women (Table 2). The largest differences among education levels (measured by school years) were observed for sexual abuse of children, tobacco smoking, AIDS, illegal drugs and suicide. Linear trends were observed for some, but not all of these associations (Table 3). The largest differences among age groups concerned illegal drugs, including canna-bis, the abuse of medications, poor diet and mammography screening, which were all rated as higher priorities by older participants than by younger ones (Table 4).
Discussion
Between 1996 and 2006, there was a substantial increase in the proportion of people answering that tobacco, poor diet and lack of physical activity were priorities for prevention. This is positive, because these three factors are, by far, the major avoidable causes of death in developed countries,1
and thus, represent the largest potential to improve mortality and morbidity. For instance, if screening and brief interven-tion for tobacco use were provided to 90% of adults, it would save as many quality-adjusted life years as increasing to 90% the delivery rate to adults of the following clinical preventive services combined: influenza vaccine, aspirin che-moprophylaxis, screening for colorectal, breast and cervical cancers, and screening for problem drinking.2
The change in opinions about tobacco may reflect the increase in public spending for tobacco prevention in Switzerland in recent years,5 or the increase of media cover-age on tobacco, related to policy developments, in particular the debate on smoking bans. The change observed between 1996 and 2006 may also be attributed to a more general trend in opinions about tobacco, and to some extent to the introduction of new smoking cessation drugs (in Switzerland, bupropion was introduced in 2000 and vareni-cline was authorized in 2006 and introduced in 2007).
The proportion of participants who listed diet and physical activity as priorities doubled between 1996 and 2006. This may reflect changes in policy and media coverage, influenced by the results of epidemiologic research. However, these topics were perceived as the lowest priorities in both surveys. This is a concern, because the prevalence of overweight and obesity has been continuously increasing in Switzerland in the past decade,6and these two factors represent the second avoidable cause of death, just after tobacco.1
Table 2 Perceived priorities for prevention funding, by sex, general population, Geneva, 2006 % answering ‘high priority’ (in 2006) Men (%) Women (%) Difference x2 P-value N 813 666
Sexual abuse of children 62.6 73.7 11.1 29.9 ,0.001 Use of illegal drugs
(heroine, cocaine, . . . )
53.4 63.2 9.8 19.8 0.001 AIDS 48.8 63.2 14.4 37.2 ,0.001 Tobacco smoking 43.3 47.1 3.8 13.0 0.02 Road traffic accidents 37.1 49.4 11.3 33.1 ,0.001 Alcoholism 35.4 50.2 14.8 46.8 ,0.001 Family violence 33.8 51.1 17.3 71.9 ,0.001 Suicide in young people 33.3 45.9 12.6 54.1 ,0.001 Breast cancer screening
by mammography
31.1 44.1 13.0 37.0 ,0.001 Abuse of medications 24.6 30.9 6.3 17.8 0.003 Cannabis use 22.5 26.0 3.5 16.9 0.005 Poor diet 22.1 22.2 0.1 11.0 0.05 Lack of physical activity 20.5 20.4 – 0.1 4.8 0.43
In 2006, fewer people than in 1996 said that AIDS and illegal drugs were high priorities. This may reflect the 11-fold decrease in AIDS mortality in Switzerland during the past decade (from 686 deaths in 1994 to 60 in 2005).7 The 1996 – 2006 change in opinions about AIDS prevention is relatively modest, compared with the magnitude of the decrease in AIDS mortality in Switzerland, but AIDS mor-tality increased dramatically worldwide in the same time.8
The associations between opinions and age or education level were not very strong, but differences in opinions
between men and women were often substantial. The largest differences between men and women concerned domains where women are often the victims of men, in particular family violence and alcoholism, and problems that mothers may find particularly hard to bear, such as road traffic accidents, that mainly affect young people,9,10 and suicide among young people, which is the second cause of death in the 10 – 24 years old in Switzerland.10 Family violence was the fourth most important topic according to women, but this is a largely underfunded
Table 3 Perceived priorities for prevention funding, by school years (quartiles), Geneva, 2006
% answering ‘high priority’ School years (quartiles) x2 P-value x2trend P-value
0 – 12 13 – 15 16 – 17 18þ
N 324 355 282 452
Sexual abuse of children 71.3 74.9 64.9 61.1 50.7 ,0.001 6.6 0.01 Use of illegal drugs (heroine, cocaine, . . . ) 61.4 61.1 52.1 56.2 34.2 0.003 0.4 0.54 AIDS 55.6 59.2 56.7 51.5 37.4 0.001 0 0.91 Tobacco smoking 42.3 47.6 39.7 48.0 42.0 ,0.001 6.9 0.009 Road traffic accidents 44.4 42.5 37.6 43.4 29.2 0.015 0.1 0.79 Alcoholism 43.2 45.9 37.6 40.9 31.1 0.009 0 0.93 Family violence 42.6 47.9 36.9 38.3 31.9 0.007 0.7 0.41 Suicide in young people 44.4 44.8 33.7 32.3 32.8 0.005 13.6 ,0.001 Breast cancer screening by mammography 38.0 43.9 31.9 33.4 25.4 0.05 0.4 0.53 Abuse of medications 32.1 31.5 22.0 24.1 24.0 0.07 4.0 0.045 Cannabis use 28.4 26.8 20.2 19.9 19.9 0.18 7.5 0.006 Poor diet 21.6 21.1 22.3 23.0 17.4 0.29 4.7 0.031 Lack of physical activity 19.8 20.0 21.6 21.0 18.6 0.23 3.8 0.052
Table 4 Perceived priorities for prevention funding, by age, general population, Geneva, 2006
% answering ‘high priority’ Age x2 P-value x2trend P-value 18 – 29 30 – 39 40 – 54 55þ
N 189 600 463 224
Sexual abuse of children 72.2 70.2 71.6 78.9 20.2 0.17 0.1 0.73 Use of illegal drugs (heroine, cocaine, . . . ) 59.1 57.2 66.5 70.0 37.5 0.001 1.1 0.30 AIDS 66.3 57.7 57.1 61.8 22.6 0.09 4.4 0.04 Tobacco smoking 42.7 48.7 50.4 46.3 29.5 0.01 2.3 0.12 Road traffic accidents 47.8 46.7 42.0 47.5 22.9 0.09 5.7 0.02 Alcoholism 42.2 42.7 48.0 47.3 26.1 0.04 0.5 0.50 Family violence 48.4 43.1 41.6 50.0 20.3 0.16 4.0 0.04 Suicide in young people 39.2 39.4 43.4 47.3 26.1 0.04 0.3 0.56 Breast cancer screening by mammography 33.3 37.6 44.0 42.6 30.4 0.01 0.2 0.68 Abuse of medications 29.7 24.6 31.6 40.7 30.2 0.011 2.8 0.09 Cannabis use 24.3 21.0 29.2 33.8 31.2 0.008 4.8 0.03 Poor diet 17.2 23.3 26.7 25.5 30.2 0.01 0.4 0.53 Lack of physical activity 18.8 20.7 24.5 23.4 25.1 0.05 0.1 0.75
area of prevention, compared with other important health problems.11
Sexual abuse of children was rated by all groups as the highest priority for prevention. This may reflect that people understand that sexual abuses of children create a lot of suffering and morbidity, and also that the public perceives that too few resources are devoted to this problem.
Interestingly, the least educated people were the most likely to answer that suicide in young people and sexual abuse of children were high priorities (the latter association was observed only among men), and the most educated people were the least likely to answer that AIDS was a priority.
Surprisingly, mammography screening was rated relatively low even among women, although breast cancer is the leading cause of cancer death in women in Switzerland and in Europe.12The association between education and priority for mammography screening was not particularly strong, even among women. There has been a debate about the effectiveness of breast cancer screening, and it is quite poss-ible that ambiguity about health messages affect peoples’ perceptions of cancer screening procedures.13
The largest gap between actual causes of disease and death and the public’s perceptions of prevention priorities concerned poor diet and lack of physical activity. This indicates that there is much room for education and infor-mation on diet and physical activity, even though opinions on these topics improved considerably over 10 years. Gaps between patients’ expectations and evidence-based rec-ommendations were also observed for other preventive ser-vices, in previous reports.4 Physicians should take a leading part in the effort to educate the public about prevention, because they are a trusted and influential source of health information.14
Study limitations
The list of 13 health problems was arbitrary and omitted important preventive services, in particular immunization, screening for several cancers, and important modifiable causes of death, such as infectious diseases. A second limit-ation is that questionnaire items were developed for this survey and were not validated, e.g. with test – retest reliability. In addition, the rest of the questionnaire covered tobacco and alcohol, which may have produced artificially high pri-ority ratings for these two topics, compared with the other topics listed. Finally, the response rate was relatively high for a mail survey in the general population,15 even though one quarter of the intended sample did not answer. The exist-ence and direction of any potential non-response bias is difficult to predict.16
Conclusions
Substantial changes were observed between 1996 and 2006 in the public’s opinion on priorities for prevention, perhaps reflecting policy changes, themselves influenced by epide-miologic research results. However, there was a gap between the major causes of morbidity and mortality and the public’s perception of priorities for prevention, which suggests that education efforts should be intensified. This is one of very few surveys assessing the public’s prioritization of preven-tion services for some of the major causes of death, and assessing change over time in these opinions.
Competing interests
None.
Funding
De´partment de l’e´conomie et de la sante´, Canton of Geneva, Switzerland
References
1 Mokdad AH, Marks JS, Stroup DF et al. Actual causes of death in the United States, 2000. J Am Med Assoc 2004;291:1238 – 45. 2 Maciosek MV, Coffield AB, Edwards NM et al. Priorities among
effective clinical preventive services: results of a systematic review and analysis. Am J Prev Med 2006;31:52 – 61.
3 Beaulieu MD, Talbot Y, Jadad AR et al. Enhancing prevention in primary care: are interventions targeted towards consumers’ and providers’ perceived needs? Health Expect 2000;3:253 – 62.
4 Oboler SK, Prochazka AV, Gonzales R et al. Public expectations and attitudes for annual physical examinations and testing. Ann Intern Med2002;136:652 – 9.
5 Office Fe´de´ral de la Sante´ Publique (OFSP). Rapport annuel 2006 du Fonds de pre´vention du tabagisme. Berne: OFSP, 2007.
6 Morabia A, Costanza MC. The obesity epidemic as harbinger of a metabolic disorder epidemic: trends in overweight, hypercholestero-lemia, and diabetes treatment in Geneva, Switzerland, 1993 – 2003. A J Public Health2005;95:632 – 5.
7 Office fe´de´ral de la Sante´ Publique (OFSP). Sida information. Bulletin OFSP2006;18:324 – 5.
8 Joint United Nations Program on HIV/AIDS (UNAIDS). AIDS Epidemic Update: Special Report on HIV/AIDS: December 2006. Geneva: UNAIDS, 2006.
9 Mayhew DR, Simpson HM, Pak A. Changes in collision rates among novice drivers during the first months of driving. Accid Anal Prev2003;35:683 – 91.
10 Schlueter V, Narring F, Mu¨nch U et al. Trends in violent deaths among young people 10 – 24 years old, in Switzerland, 1969 – 1997. Eur J Epidemiol2004;19:291 – 7.
11 Hawkins D, Humes M. Human rights and domestic violence. Polit Sci Quart, 2002;117:231 – 57.
12 Boyle P, Ferlay J. Cancer incidence and mortality in Europe, 2004. Ann Oncol2005:16; 481 – 8.
13 Han PK, Moser RP, Klein WM. Perceived ambiguity about cancer prevention recommendations: associations with cancer-related per-ceptions and behaviours in a US population survey. Health Expect 2007;10:321 – 36.
14 Mirand AL, Beehler GP, Kuo CL et al. Explaining the de-prioritization of primary prevention: physicians’ perceptions of their role in the delivery of primary care. BMC Pub Health 2003;3:15. 15 Asch DA, Jedrziewski MK, Christakis NA. Response rates to mail
surveys published in medical journals. J Clin Epidemiol 1997;50: 1129 – 36.
16 Etter JF, Perneger TV. Analysis of non-response bias in a mailed health survey. J Clin Epidemiol 1997;50:1123 – 8.