D. F. Garvin and N. F. Weeden
From the Department of Horticultural Sciences, Cor-nell University, New York State Agricultural Experi-ment Station, Geneva, New York Dr. Garvin is cur-rently at the U.S. Plant, Soil, and Nutrition Laboratory, USDA-ARS, Cornell University, Ithaca, NY 14583 Re-search reported herein was supported by a Charles Bullis Plant Hybridation fellowship to D.F.G. Journal of Heredity 1994:85:273-278; 0022-1503/94/15.00
A genetic map of tepary bean (Phaseolus acutifolius A. Gray) may be useful to plant breeders attempting to transfer desirable genes from this species to other Phaseolus species. In order to expand the genetic information available for tepary bean, the inheritance of and linkage relationships among 23 morphological, isozyme, and RFLP markers were determined. All but one of the characters segregated In a monogenic fashion, and low levels of segregation distortion were observed. New two-locus linkages identified included Aat-21Gpi-c2, Aco-2/Dla-3, and Dla-31Idh-x. Nine of the 23 loci exhibited linkage to other loci analyzed and could be assigned to one of three distinct linkage groups. Two tepary bean linkage groups (Adh-1/Aat-2, Aco-2/Dia-3) appear to be conserved in common bean, although the linkage estimates for Adh-1IAat-2 are dramatically different in these species. The Adh-1/Aat-2 linkage also appears to be conserved in lentil and pea. Additionally, the Gpl-d/Pgd-3 linkage has a possible counterpart in soybean, and the Fdh-1IQpi-c1 linkage in tepary bean is maintained in chickpea.
Plant breeders have long recognized that exotic germplasm may serve as a source of valuable genes with which to enhance crop performance. Common bean
(Pha-seolus vulgaris L.) breeders have identified
the tepary bean, Phaseolus acutifolius A. Gray, as a source of genes which might improve the drought and heat tolerance of common bean (Thomas et al. 1983). The tepary bean consists of two distinct vari-eties (var. acutifolius and tenuifolius) dis-tinguished by differences in leaflet mor-phology. Domesticated landraces of tepary bean also exist. This species is extraor-dinarily well adapted for growth in hot, dry climates, reportedly tolerating ground temperatures as high as 53°C (Nabhan et al. 1981). In addition to drought and heat tolerance, the tepary bean also has attract-ed the attention of plant breattract-eders because of its resistance to bacterial diseases and other pests (e.g., Coyne and Schuster 1973; Omwega et al. 1989; Shade et al. 1987). Several attempts to transfer genes from tepary to common bean have been made, with limited success (Waines et al. 1988). Genetic maps are currently available for a number of legumes, including common bean (Nodari et al. 1993; Vallejos et al. 1992), soybean (Glycine spp.) (Keim et al. 1990), cowpea (Vigna unguiculata), and mung bean (Vigna radiatd) (Fatokun et al. 1992). Although most of these maps have
been generated only recently, they al-ready have proven useful for identifying molecular markers for commercially im-portant monogenic traits (Diers et al. 1992) and for analyzing the genetic basis of more complex characters (Fatokun et al. 1992; Keim et al. 1990).
A tepary bean genetic linkage map may be useful in an interspecific bean breeding program involving this species, both for selection of desired genes and for elimi-nation of deleterious genetic material (Tanksley and Rick 1980). However, to date there is a paucity of genetic information available for this potentially useful crop. To begin to fill this void and build a frame-work for future gene mapping in tepary bean, we report here the inheritance and linkage relationships of 23 characters in tepary bean, including 14 new isozyme, morphological, and DNA marker loci. Materials and Methods
Plant Material
Seed samples were obtained from Dr. J. G. Waines (University of California, River-side). Accessions were originally from the University of California, Riverside legume collection, the Centro Internacional de Agricultura Tropical (CIAT, Cali, Colom-bia), or the United States Department of Agriculture (USDA, Pullman,
Table 1. Tepary bean parents nsed to generate segregating progenies Accession Origin Classi-fication L177 L320 L474 L556 L581 G40100 G40115 PI201268 P1319443 Sonora, Mexico Arizona, U.S.A. Arizona, U.SA Jalisco, Mexico Sonora, Mexico Durango, Mexico U.SA. Chiapas, Mexico Sonora, Mexico wild acutifoltus wild lenuifolius wild tcnuifolius wild tenuifolius acunfoliuf wild tenuifolius wild lenuifolius acutifoliuf acutifoliuf ' Domesticated landraces.
ton). Designations for each are reflected by the prefix L, G, or PI, respectively, in the name of the accession. Plants from se-lected accessions (Table 1) were crossed to generate F, hybrids. F, hybrids were subsequently grown to maturity and al-lowed to self-pollinate to generate F2 pop-ulations. Some F2 populations were grown to maturity to obtain F3 seed. Between 40 and 58 individuals from six different pop-ulations were used in our analysis.
Data Collection
Three morphological characters were scored for segregation in F2 families. The first, stem anthocyanin (SAN), was scored on F2 plants with fully expanded primary leaves. Individuals were scored for the presence or absence of red coloration on the stem. The second morphological char-acter scored, leaf anthocyanin (LAN), was scored on F2 plants at the same stage as for stem anthocyanin. The positive LAN phenotype is characterized by the pres-ence of a distinct red hue on the abaxial surface of the primary leaves, while the alternate phenotype is the absence of such coloration. The third morphological char-acter scored was pod dehiscence (DPO). This trait was scored for segregation using pods from individual F2 plants. Scoring was based upon the extent to which pod valves curled along their axis when dehisced, with positive dehiscence characterized by at least 360° of curling in the valves after pods were split open.
Isozyme polymorphisms were scored for segregation primarily in F2 populations. However, the F3 generation was used to infer F2 genotypes in a few cases. Imbibed seeds and leaf tissue were prepared for starch gel analysis by grinding in either a 0.1 M potassium phosphate buffer, pH 7.0, containing 10% PVP, 10% glycerol, and 0.1 % mercaptoethanol, or a 0.05 M Tris maleate buffer, pH 8.0, containing 0.1% mercapto-ethanol and 0.2% Triton X-100. Paper wicks were dipped in the sample slurry and
ap-plied to a vertical slice in the gel. Two starch gel systems were used. The first was a histidine citrate gel, pH 6.5 (Stuber et al. 1977). The second was a discontinuous Tris citrate/lithium borate system, pH 8.1 (Se-lander et al. 1971). The histidine citrate gel was run for 4-5 h at 275 volts, whereas the Tris citrate/lithium borate system was run for 5-6 h at 35 milliamps (275 volts maximum). Gel electrophoresis was con-ducted at 4°C.
After electrophoresis, gels were sliced horizontally, and slices were stained for enzyme activity at 37°C. The enzyme sys-tems analyzed included aspartate amino-transferase (AAT), aconitase (ACO), al-cohol dehydrogenase (ADH), diaphorase (DIA), alpha esterase (EST), formate de-hydrogenase (FDH), glucosephosphate isomerase (GPI), isocitrate dehydroge-nase (IDH), A'-acetyl glucosaminidase (NAG), 6-phosphogluconate dehydroge-nase (PGD), phosphoglucomutase (PGM), shikimate dehydrogenase (SKD), and tri-osephosphate isomerase (TPI). Systems analyzed on the histidine citrate system included ACO, ADH, DIA, FDH, IDH, and PGD. The enzymes scored on the Tris cit-rate/lithium borate system included AAT, EST, GPI, NAG, SKD, and TPI. PGM was resolvable in both systems. Imbibed seed extracts were used to analyze ACO, ADH, DIA, EST, FDH, GPI, IDH, PGD, PGM, and SKD. Leaf tissue was used to score AAT, NAG, and TPI. In a few instances, enzymes normally scored in seed tissue were re-solved in leaf tissue (DIA, GPI, PGD, SKD).
Recipes used for ACO, ADH, FDH, IDH, PGD, and SKD were essentially those re-ported by Garvin et al. (1989). NAG was stained with the assay of Weeden (1986). AAT, EST, and TPI were stained according to Wendel and Weeden (1989), with minor differences in component concentrations and pH of buffers. GPI and PGM were stained using modifications of recipes pre-sented by Ignart and Weeden (1984). DIA was stained according to Wendel and Wee-den (1989), or with an assay containing 0.1 M potassium phosphate, pH 7.0, 0.2 mg/ml MTT, 0.6 mg/ml menadione, and 0.2 mg/ml NADH.
The subcellular location of AAT, PGD, PGM, and TPI isozymes was examined as follows: 3-week-old plants of the tepary bean accessions L320 and PI319443 were placed in the dark for 3 days. Leaves from each accession were then harvested and ground with ice cold extraction buffer (0.01 M Tricine, pH 7.9,0.3 M sorbitol, 1% Ficoll, 1 mM isoascorbic acid) in a blender, using five 1-s bursts. The slurry was filtered
through several layers of cheesecloth, and centrifuged for 30 s at 500 g to remove nuclei and cellular debris. The superna-tant was sequentially centrifuged for 1, 3, and 10 min at 1,000, 3,000, and 10,000 g, respectively. Pellets were lysed with 0.05 M Tris-HCl, pH 7.5, with 0.01% mercapto-ethanol, and analyzed by starch gel elec-trophoresis along with crude leaf extracts. The marker enzymes for the subcellular compartments were the plastid and cyto-solic GPI isozymes (Weeden et al. 1989).
The inheritance of the 45S ribosomal re-peat was examined by RFLP analysis. DNA was extracted from F2 plants and parents, using the procedure of Doyle and Doyle (1987). Approximately 5 Mg of DNA from each parent and F2 individual was digested with the restriction enzyme Xba\, separat-ed by agarose gel electrophoresis, and transferred to nylon membrane (Gene-screen Plus, Du Pont). Cloned ribosomal DNA from soybean (provided by Dr. J. J. Doyle, Cornell University), was ^P-la-beled using the method of Feinberg and Vogelstein (1984). Hybridization between membranes and probe DNA was conduct-ed overnight at 65°C in essentially the same buffer described elsewhere (Bernatsky and Tanksley 1986). Filters were washed at 65°C with 2 x SSC/0.1% SDS before autoradiog-raphy.
Inheritance and Linkage Analysis
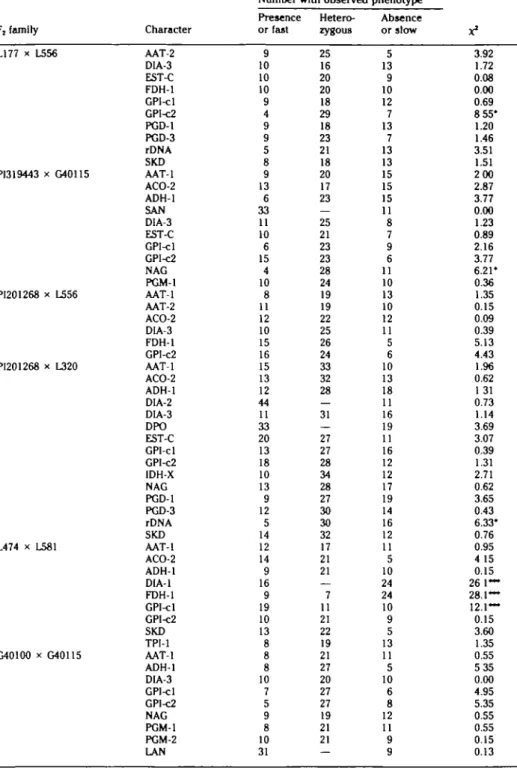
Segregation data obtained for all the char-acters scored were tested for goodness-of-fit to a monogenic segregation model using the x2 statistic (a = 0.05). Morphological characters and two isozymes (1, DIA-2) were tested against a 3:1 expected seg-regation ratio. The remaining isozymes and the ribosomal RFLP data were tested against an expected segregation ratio of 1:2:1.
Contingency x2 analysis was used to re-veal possible linkage between loci segre-gating in a monogenic fashion. Maximum likelihood linkage estimates and their as-sociated standard errors were generated for pairs of loci that exhibited significant contingency x2 values (P < .05). Linkage was rejected if a significant x2 was not de-tected for a given locus pair in all popu-lations testing the linkage, or if the sum of the linkage estimate and two standard er-rors approximated or exceeded 50% re-combination.
All inheritance and linkage analyses were conducted with the Macintosh for-mat LINKAGE-1 program (Suiter et al. 1983).
Results
Characterization of Enzyme Systems Subcellular localization. The relative
inten-sities of the GPI isozyme bands in the 1,000
g and 3,000 g pellets did not differ
mark-edly from those observed in the raw leaf extract. These pellets should have con-tained the majority of intact chloroplasts in the preparation and therefore should have shown enrichment for the plastid zyme relative to the cytosolic GPI iso-zymes. As the "chloroplast" pellet did not exhibit enrichment for the plastid marker enzyme, we were not able to confidently identify the isozyme compartmentaliza-tion for AAT, PGM, PGD, or TPI.
Inheritance of new isozymes. Aspartate
aminotransferase: Parents examined for AAT activity consistently exhibited three zones of activity, 1, 2, and AAT-3. Segregation for both AAT-1 and AAT-2 was consistent with monogenic control (Table 2). The genes encoding these two isozymes are designated Aat-1 and Aat-2. Further, both isozymes appear to be di-meric, since we observed heterodimers in heterozygous individuals.
Diaphorase: Gels stained for DIA re-vealed a complex banding pattern. Vari-able numbers of bands were resolved on the anodal slice, and approximately half of the tepary accessions also possessed a strongly-staining cathodal band. Segre-gation analysis revealed that this cathodal zone was allelic to the least mobile anodal zone of activity found in accessions lack-ing the cathodal zone (Table 2). These two zones were designated allozymes of the locus Dia-3. Two zones in the anodal slice, DIA-1 and DIA-2, also appeared to segre-gate. These polymorphisms were scored as dominant traits because heterozygotes were sometimes difficult to distinguish from homozygotes. Genetic analysis of DIA-2 segregation ratios revealed simple monogenic control of this isozyme. We designated this gene Dia-2 (Table 2). In the progeny L474 x L581, segregation was observed for DIA-1, a zone of activity that migrated more rapidly than other DIA zones. The x2 analysis of segregation data obtained for DIA-1 rejected a monogenic hypothesis (Table 2).
Esterase: A rapidly developing zone of EST activity that migrated to the cathodal region of gels was detected in tepary bean. Segregation for this zone, EST-C, was an-alyzed in three F2 families. In all three, segregation appeared to be monogenic and codominant (Table 2). The gene encoding EST-C was designated Est< (cathodal).
Table 2. Single loco* goodnes* of fit te*U for character* cegregatlng In tepary bean population* Number with observed phenotype
F, family LI 77 x L556 P1319443 x G40115 PI201268 x L556 PI201268 x L320 L474 x L581 G40100 x G40115 • P < .05. • P< .001. Character AAT-2 DIA-3 EST-C FDH-1 GPI-cl GPI-C2 PGD-1 PGD-3 rDNA SKD AAT-1 ACO-2 ADH-1 SAN DIA-3 EST-C GPI-cl GPI-C2 NAG PGM-1 AAT-1 AAT-2 ACO-2 DIA-3 FDH-1 GPI-C2 AAT-1 ACO-2 ADH-1 DIA-2 DIA-3 DPO EST-C GPI-cl GPI-C2 IDH-X NAG PGD-1 PGD-3 rDNA SKD AAT-1 ACO-2 ADH-1 DIA-1 FDH-1 GPI-cl GPI-C2 SKD TPI-1 AAT-1 ADH-1 DIA-3 GPI-cl GP1-C2 NAG PGM-1 PGM-2 LAN Presence or fast 9 10 10 10 9 4 9 9 5 8 9 13 6 33 11 10 6 15 4 10 8 11 12 10 15 16 15 13 12 44 11 33 20 13 18 10 13 9 12 5 14 12 14 9 16 9 19 10 13 8 8 8 10 7 5 9 8 10 31 Hetero-zygous 25 16 20 20 18 29 18 23 21 18 20 17 23 25 21 23 23 28 24 19 19 22 25 26 24 33 32 28 31 27 27 28 34 28 27 30 30 32 17 21 21 7 11 21 22 19 21 27 20 27 27 19 21 21 — Absence or slow 5 13 9 10 12 7 13 7 13 13 15 15 15 11 8 7 9 6 11 10 13 10 12 11 5 6 10 13 18 11 16 19 11 16 12 12 17 19 14 16 12 11 5 10 24 24 10 9 5 13 11 5 10 6 8 12 11 9 9 X1 3.92 1.72 0.08 0.00 0.69 8 55* 1.20 1.46 3.51 1.51 2 0 0 2.87 3.77 0.00 1.23 0.89 2.16 3.77 6.21* 0.36 1.35 0.15 0.09 0.39 5.13 4.43 1.96 0.62 1 31 0.73 1.14 3.69 3.07 0.39 1.31 2.71 0.62 3.65 0.43 6.33* 0.76 0.95 4 15 0.15 26 1— 28.1— 12.1— 0.15 3.60 1.35 0.55 5 3 5 0.00 4.95 5.35 0.55 0.55 0.15 0.13
A'-acetyl glucosaminidase: The fluores-cent assay used to detect NAG resolved one anodal zone of activity in parental tis-sues which segregated as a codominant trait in two of the three of the populations tested (Table 2). In the other population, the segregation ratio deviated significantly from the expected ratio. The locus encod-ing NAG activity was designated Nag.
6-Phosphogluconate dehydrogenase: All
tepary beans exhibited at least two zones of PGD activity. We were able to resolve three zones of activity in certain parents used to generate segregating populations. The additional zone resolved in these par-ents was more anodal to the other zones, and was denoted PGD-1. The zone of in-termediate mobility, formerly known as 6PGD-1 (Garvin et al. 1989), was desig-nated PGD-2, and the least mobile zone of
Aco-2
Fdh-1
ldh-x ^c^ Dia-3
Gpici
-Figure 1. Defined linkage groups In tepary bean
PGD activity, formerly referred to as 6PGD-2, was designated PGD-3 (Garvin et al. 1989). Segregation for PGD-1 was detected in two families, and was not significantly different from that expected for a codom-inant trait controlled by a single gene (Ta-ble 2). Apparently, the alternative allele of
Pgd-1 encodes an allozyme which
comi-grates with PGD-2. We inferred this from segregation patterns for PGD-1, which re-vealed that heterozygotes possessed a heterodimer of intermediate mobility be-tween PGD-1 and PGD-2. This heterodimer is absent from individuals homozygous for the allele encoding the fast PGD-1 allo-zyme.
Phosphoglucomutase: Two of our cross-es involved a parent posscross-essing a rare slow mobility variant of PGM-1, the more mo-bile of the two PGM isozymes. In both progenies segregating for PGM-1, a 1:2:1 ratio was observed for parental and hybrid phenotypes (Table 2). PGM-1 is encoded by a locus designated Pgm-1.
Triosephosphate isomerase: All tepary parents analyzed possessed two distinct zones of TPI activity. The two zones were labeled TPI-1 and TPI-2 to reflect relative mobility during electrophoresis, with TPI-1 migrating more rapidly than TPI-2. A rare alternate form of TPI-1 that migrated more slowly than TPI-2 was also identified in a few accessions, including L474. In L474 x L581, the lone progeny segregating for
TPI-1, the pattern of segregation indicated that TPI-1 is encoded by a single nuclear gene designated Tpi-1 (Table 2).
Inheritance of Previously Described Isozymea
Our analysis of nine previously character-ized isozymes (Garvin et al. 1989), includ-ing ACO-2, ADH-1, FDH-1, GPI-cl, GPI-c2, IDH-X, PGD-3, PGM-2, and SKD, confirmed that all are encoded by single discreet genes (Table 2). Gene designations used for the genes encoding these isozymes are consistent with previous research (Garvin et al. 1989), with the exception of genes encoding PGD isozymes, as discussed ear-lier.
Inheritance of Morphological Characters
Morphological characters included in this study were scored in separate F2 popula-tions. The segregation of SAN and LAN, the two anthocyanin characters, each fit ratios expected from single dominant ge-netic characters (Table 2). In both cases, the presence of anthocyanin was domi-nant to the absence of the pigment. Pod dehiscence (DPO) also exhibited a seg-regation pattern consistent with a mono-genic model, with positive dehiscence dominant to the lack of dehiscence (Table 2). Loci encoding these morphological characters were designated San, Lan, and
Dpo, respectively.
Inheritance of the 45S Rlbosomal Repeat
The inheritance of the 45S ribosomal re-peat (rDNA) was examined in two proge-nies. The soybean rDNA probe cross-hy-bridized with fragments of ~9.0 and 2.0 kb in Xba\-digested DNA from each parent, with distinct size polymorphism detected for each fragment among the parents. In segregating populations, the two frag-ments cosegregated completely with each other, indicating that they are located at the same locus. Codominant monogenic inheritance of the ribosomal repeat, rDNA, was suggested by segregation ratios, though segregation distortion for rDNA was observed in one of the two families ana-lyzed (Table 2).
Linkage
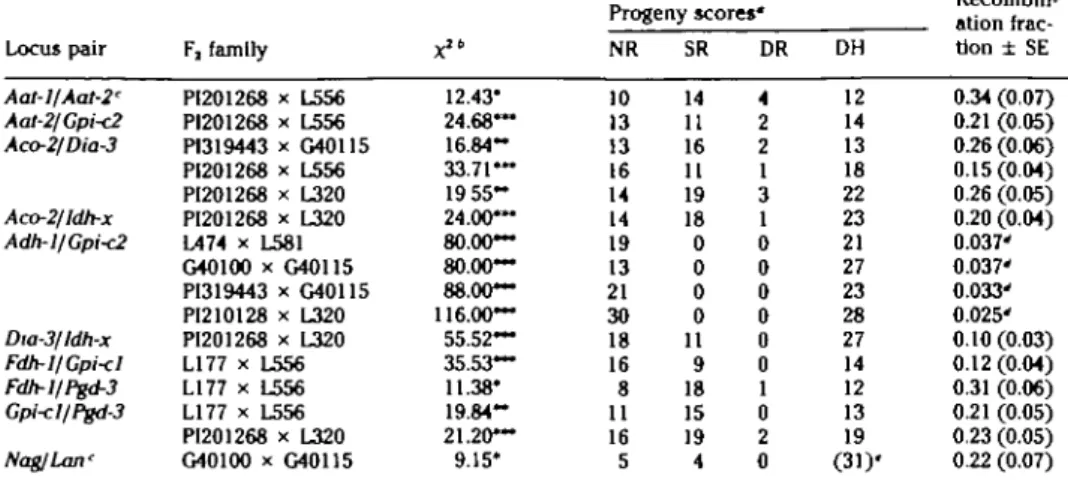
Pairwise linkage tests between 229 two-locus pairs were conducted, and several linkages were detected (Table 3). Link-ages involving new loci included Aat-2/
Gpic-2, Aco-2/Dia-3, and Dia-3/Idh-x. We
also detected the weak potential linkages
Aat-1/Aat-2, Idh-x/Nag, and Nag/Lan. In
ad-dition, several linkages which had previ-ously been reported or suspected (Garvin et al. 1989) were confirmed, including
Aco-2/Idh-x, Adh-l/Gpi-c2, Fdh-1/Gpi-cl, Fdh-1/ Pgd-3, and Gpi<l/Pgd-3 (Table 3).
Ulti-mately, we were able to organize all linked loci into three distinct linkage groups, and were also able to determine gene orders for these linkage groups. The first linkage group consisted of Aco-2/ldh-x/Dia-3, the second included the loci
Adh-l/Gpi-c2/Aat-2, and the third consisted of the loci Fdh-l/Gpi<l/Pgd-3 (Figure 1).
The linkage detected between the loci
ldh-x and Nag was ultimately discounted
since Nag was not linked to either Aco-2 or Dia-3, loci which flank ldh-x
Discussion
Segregation Analysis
Genetic analysis of six tepary bean F2 fam-ilies identified 13 new polymorphic loci, including three controlling morphological characters, nine isozyme loci, and the 45S ribosomal array. A 10th polymorphic iso-zyme was identified in the analysis, but this isozyme did not display the expected monogenic ratio and requires further study before its genetic basis is determined. In addition, the monogenic inheritance of nine previously described isozymes (Gar-vin et al. 1989) was confirmed.
A relatively low level of segregation dis-tortion was observed in our study; only
~10% of the loci exhibited significant skewing as revealed by the x2 tests for monogenic segregation. This estimate is similar to results commonly observed in intragenic analyses (Zamir and Tadmor 1986). Sampling error rather than a bio-logical cause was the apparent basis of the observed segregation distortion, because in no case was segregation distortion for a particular locus observed in more than one segregating population. In all crosses examined, the hybrid and subsequent gen-erations appeared to be as vigorous as ei-ther parent and were fully fertile. Thus, intraspecific incompatibilities do not ap-pear to be as important a problem in te-pary bean as in crosses among common bean varieties, particularly when common bean parents are from different geograph-ic origins (Gepts and Bliss 1985).
Linkage
Theoretically, linkage analysis of 195 two-locus pairs could be conducted among the 13 new loci described here, and between these loci and the nine previously de-scribed isozyme loci included in our anal-ysis. Because of the lack of appropriate crosses to test linkage between rare alleles and the exclusion of some pairwise com-parisons due to segregation distortion, linkage analysis was completed for only two-thirds of the possible combinations, though in some cases we were able to infer linkage relationships because of tests with flanking loci. Even so, of the 18 isozyme loci that were used in the linkage analysis, nine could be assembled into three sep-arate linkage groups (Figure 1). This clus-tering of 50% of the isozyme loci is some-what surprising considering that tepary bean has 11 chromosome pairs.
Several studies have examined synteny in related species with molecular markers (e.g., Bonierbale et al. 1988; Hulbert et al.
Table 3. Linkage estimate* for locos pairs deviating from Independent segregation Locus pair Aat-l/Aat-2' Aat-2/Gpi<2 Aco-2/Dia-3 Aco-2/Idh-x Adh-1/Gpi<2 Dia-3/ldh-x Fdh-l/Gpi<I Fdh-l/Pgd-3 Gpi-cllPgd-3 Nag/Lan' F, family PI201268 x L556 PI201268 x L556 P1319443 x G40115 PI201268 x L556 PI201268 x L320 PI201268 x L320 L474 x L581 G40100 x G40U5 PI319443 x G40115 PI210128 x L320 PI201268 x L320 L177 x L556 L177 x L556 L177 x L556 PI201268 x L320 G40100 x G40115 x" 12.43" 24.68~ 16.84-33.71— 19 5 5 -24.00— 80.00— 80.00— 88.00— 116.00— 55.52— 35.53— 11.38* 19.84-21.20— 9.15* Progeny scores' NR 10 13 13 16 14 14 19 13 21 30 18 16 8 11 16 5 SR 14 11 16 11 19 18 0 0 0 0 11 9 18 15 19 4 DR 4 2 2 1 3 1 0 0 0 0 0 0 1 0 2 0 DH 12 14 13 18 22 23 21 27 23 28 27 14 12 13 19 (31)' Recombin-ation frac-tion ± SE 0.34 (0.07) 0.21 (0.05) 0.26 (0.06) 0.15(0.04) 0.26 (0.05) 0.20 (0.04) 0.037' 0.037' 0.033' 0.025' 0.10 (0.03) 0.12 (0.04) 0.31 (0.06) 0.21 (0.05) 0.23 (0.05) 0.22 (0.07)
• Four classes of genotypes used to generate maximum likelihood estimates of linkage. NR, SR, DR, and DH - the nonrecombinant parental genotype, single recomblnant, double recombinant, and double heterozygote classes of Fj individuals, respectively.
6 Contingency x1 values ' P < .05; " P < .01; —* P < .001.
' To be considered tentative linkages until further evidence is available.
d Theoretical maximum recombination frequency, estimated with the formula of Hanson (1959).
«Individuals for which genotypes could not be determined, potentially including NR, SR, DR, and DH progeny genotypes.
1990). Isozyme information has been sim-ilarly employed (Kazan et al. 1993; Wee-den et al. 1992). Though there is limited isozyme linkage information available for common bean, comparisons of linkage in-volving orthologous isozyme loci in tepary and common bean did reveal two cases of synteny. Two isozyme linkage groups were reported by Vallejos and Chase (1991),
Aco-2/Dia-l and Adh-l/Got-2 (Aat-2), and are
likely orthologous to the Aco-2/Dia-3 and
Adh-l/Aat-2 linkages detected in tepary
bean. Linkage estimates for the Aco-Dia linkage, ~20 cM, were similar in both com-mon and tepary bean. In contrast, the 2 cM linkage estimate between Adh-1 and
Got-2 {Aat-Z) in common bean (Vallejos
and Chase 1991) is an order of magnitude smaller than the Adh-1/Aat-2 linkage in te-pary bean. A genome-wide picture of the extent of synteny between these species should be revealed by inclusion of molec-ular markers from the common bean mo-lecular maps (Nodari et al. 1993; Vallejos et al. 1992) in further tepary bean gene mapping studies. Such information should be useful for assessing the feasibility of transferring tepary bean genes to common bean by interspecific hybridization.
Several of the isozyme linkages in tepary bean appear to be conserved in other le-gume genera as well. For instance, linkage between Got-3 and Adh has been detected in lentil (Zamir and Ladizinsky 1984), and in pea Aat-c and Adh-1 are known to be on the same linkage group (Weeden et al.
1993). These linkages are likely ortholo-gous to the tepary bean linkage between
Gpi-c2 (and by extension Adh-T) and Aat-2. In lentil, these loci were found to be
separated by 21 cM (Zamir and Ladizinsky 1984), as was the case in tepary bean. In chickpea, the loci Fdh and Gpi< are sep-arated by 7 cM (Gaur and Slinkard 1990). Our study also detected linkage between
Fdh-1 and Gpi<l in tepary bean, and found
that these loci are separated by 12 cM. Lastly, the 22-cM Gpi-cl/Pgd-3 linkage of tepary bean may be orthologous to the
Gpi-l/Pgd-1 linkage (16 cM) reported in
soybean (Palmer and Hedges 1993). The conserved linkages we identified between Phaseolus and other legume gen-era are interesting from an evolutionary standpoint, for all involve a gene encoding cytosolic GPI, which has been shown to have been duplicated in the legume sub-family Papilionoideae (Weeden et al. 1989). Subsequent silencing of one of the dupli-cate loci has occurred in pea, lentil, chick-pea, and a variety of other papilionoid legumes. Our result of linkage between
Fdh-1 and Gpi-cl in tepary bean suggests
that the silenced Gpi-c in chickpea is or-thologous to the tepary bean Gpi<2 gene and that this Gpi'-cpseudogene may be lo-cated near Adh-1.
To date, few of the isozymes or other markers analyzed here have been incor-porated into either of the molecular com-mon bean linkage maps (Nodari etal. 1993; Vallejos et al. 1992). If the level of isozyme
polymorphism we observed in tepary bean correlates with the level of RFLP poly-morphism, it should be feasible to incor-porate the available common bean molec-ular markers into a tepary bean map in order to create a composite Phaseolus ge-netic map that includes both molecular markers from common bean and many iso-zyme marker loci from tepary bean. Such a map should be useful for interspecific bean breeding programs involving the te-pary bean.
Reference*
Bernatsky R and Tanksley SD, 1986. Toward a satu-rated linkage map in tomato based on isozymes and random cDNA sequences. Genetics 112:887-898. Bonierbale MW, Plaisted RL, and Tanksley SD, 1988. RFLP maps based upon a common set of clones reveal modes of chromosomal evolution in potato and to-mato. Genetics 120:1095-1103.
Coyne, DP and Schuster ML, 1973. Phaseolus germ-plasm tolerant to common blight bacterium (Xanthom-onas phaseoli). Plant Dis Rep 57:111-114.
Diers BW, Mansur L, Imsande J, and Shoemaker RC, 1992. Mapping Phytopthora resistance loci in soybean with restriction fragment length polymorphism mark-ers. Crop Sci 32:377-383.
Doyle J and Doyle J, 1987. A rapid DNA isolation pro-cedure for small quantities of fresh leaf tissue. Phy-tochemBull 19:11-15.
Fatokun CA, Menancio-Hautea DI, Danesh D, and Young ND, 1992. Evidence for orthologous seed weight genes in cowpea and mungbean based on RFLP mapping. Genetics 132:841-846.
Feinberg AP and Vogelsteln B, 1984 Addendum. Anal Biochem 137:266-267.
Garvin DF, Roose ML, and Waines JG, 1989. Isozyme genetics and linkage in tepary bean, Phaseolus acuti-follus A. Gray. J Hered 80:373-376.
Gaur PM and Slinkard AE, 1990. Genetic control and linkage relationships of additional Isozyme markers in chick-pea. Theor Appl Genet 80:648-656
Gepts P and Bliss FA, 1985. Differential geographic origin of F, hybrid weakness-inducing genes suggest-ing two gene pools in common bean (Phaseolus vul-gans L.) J Hered 76:447-450.
Hanson WD, 1959. Minimum family sizes for the plan-ning of genetic experiments. Agron J 51:711-715. • ." Hulbert SH, Richter TE, Axtell JD, and Bennetzen JL, 1990 Genetic mapping and characterization of sor-ghum and related crops by means of maize DNA probes. Proc Nat! Acad Sci USA 87-4251-4255.
Ignart F and Weeden NF, 1984. Allozyme variation in cultivars of Cucurtita pepo L Euphytica 33:779-785. Kazan K, Muehlbauer FJ, Weeden NF, and Ladizinsky G, 1993. Inheritance and linkage relationships of mor-phological and isozyme loci in chickpea (Cicer arieli-num L). Theor Appl Genet 86:417-426.
Keim P, Diers BW, Olson TC, and Shoemaker RC, 1990. RFLP mapping in soybean: association between mark-er loci and variation in quantitative traits. Genetics 126: 735-742.
Nabhan G, Vogler K, and Reichardt K, 1981. Tepary bean crop ecology, Papago Indian Reservation, Ari-zona. Annu Rep Bean Imp Coop 24.67.
Nodari RO, Tsai SM, Gilbertson RL, and Gepts P, 1993 Towards an Integrated linkage map of common bean 2 Development of an RFLP-based linkage map. Theor Appl Genet 85:513-520.
Omwega CO, Thomason U, Roberts PA, and Waines JG, 1989 Identification of new sources of resistance to root-knot nematodes in Phaseolus. Crop Scl 29:1463-1468.
Palmer RG and Hedges BR, 1993. Linkage map of soy-bean (GfycmemaxL. Merr.). In: Genetic maps (O'Brien SJ, ed) New York: Cold Spring Harbor Press; 6.139-6 148.
Selander RK, Smith MH, Yang SY, Johnson WE, and Gentry JB, 1971 Biochemical polymorphism and sys-tematics in the genus Peromyscus. I Variation in the old-field mouse (Peromyscus polionotus). Univ Texas Publ 7103.49-90.
Shade RE, Pratt RC, and Pomeroy MA, 1987. Devel-opment and mortality of the bean weevil
(Acantho-scelides obtectus) (Coleoptera: Bruchidae), on mature
seeds of tepary beans, Phaseolus aculifolius. and com-mon beans P. vulgaris. Environ Entomol 16:1067-1070. Stuber CW, Goodman MM, and Johnson FM, 1977. Ge-netic control and racial variation of B-glucosidase iso-zymes in maize QZea maysL.). Biochem Genet 15:383-394.
Suiter KA, Wendel JF, and Case JS, 1983. LINKAGE-1.
a PASCAL computer program for the detection and analysis of genetic linkage. J Hered 74:203-204. Tanksley SD and Rick CM, 1980 Isozymlc gene linkage map of the tomato, applications in genetics and breed-ing. Theor Appl Genet 57:161-170.
Thomas CV, Manshardt RM, and Waines JG, 1983 Te-paries as a source of useful traits for improving com-mon beans. Desert Plants 5:43^18.
Vallejos CE and Chase CD, 1991 Linkage between iso-zyme markers and a locus affecting seed size in
Pha-seolus vulgaris L. Theor Appl Genet 81:413-119.
Vallejos CE, Sakiyaraa NS, and Chase CD, 1992 A mo-lecular marker-based linkage map of Phaseolus vulgaris L. Genetics 131:733-740.
Waines JG, Manshardt RM, and Wells WC, 1988. Inter-specific hybridization between Phaseolus vulgaris and
P. aculifolius In: Genetic resources of Phaseolus beans
(Gepts P, ed). Boston. Kluwer; 485-502
Weeden NF, 1986. Genetic confirmation that the vari-ation in the zymograms of 3 enzyme systems is pro-duced by allelic polymorphism. Annu Rep Bean Imp Coop 29:117-118.
Weeden NF, Ambrose M, and Swiecicki W, 1993. Pisum
sativum, pea. In: Genetic maps (O'Brien SJ, ed) New
York: Cold Spring Harbor Press, 6.24-6.25.
Weeden NF, Doyle JJ, and Lavin M, 1989 Distribution and evolution of a glucosephosphate isomerase du-plication in the Leguminosae. Evolution 43:1637-1651 Weeden NF, Muehlbauer FJ, and Ladizinsky G, 1992. Extensive conservation of linkage relationships be-tween pea and lentil genetic maps. J Hered 83:123-129.
Wendel JF and Weeden NF, 1989. Visualization and interpretation of plant isozymes. In. Isozymes in plant biology (Soltis DE and Solus PS, eds) Portland Dios-condes Press; 5—45.
Zamir D and Ladizinsky G, 1984. Genetics of allozyme variants and linkage groups In lentil Euphytica 33:329-336
Zamir D and Tadmor Y, 1986. Unequal segregation of nuclear genes in plants Bot Gaz 147-355-358. Received July 26, 1993