misP/ + a/a E/E (not spotted, not yellow)
+ / + a/a E/E (not spotted, not yellow) misp/ + a/a e/e (not spotted, yellow) + / + a/a e/e (not spotted, yellow) The nonyellow mice produced in these mat-ings were black.
Mice of genotype DK-Ay/a b/b (Figure 1A), maintained by the author, are introduced and briefly described. The strain reached the 20th generation of brother-sister mating in August 1980.
Results
Nonagouti black mice of the genotype Miwh/+ (Figure IB) show reduction of the hair pigmentation intensity, usually accom-panied by a defined ventral white spot. Non-spotted yellow mice of the genotype e/e (Fig-ure 1C) are sable in their first pelage, becom-ing somewhat less so with age. Nonspotted yellow mice of the genotype Ay/a (Figure IB) are a clear yellow phenotype with little or no visible eumelanization.
The Miwh/ + Ay/a mouse (Figure IB) is a distinctly sable phenotype, very similar in appearance to the young + / + e/e mouse (Figure 1C). Upon maturity these lethal-yel-low mice became obese. Obesity is a pleiotropic effect associated with the lethal-yellow syndrome. Presence of Miv vV+ had
an effect on the Ay/a (lethal-yellow) mouse that is opposite to its effect on the e/e (reces-sive yellow) mouse. Eumelanin is largely eliminated from the hairs of the M iwV + e/e
mouse, and its pigment phenotype is thus in-distinguishable from that of the + / + Ay/a mouse. The recessive yellow mice, however, do not become obese at maturity. These dif-ferences are consistent, and color difdif-ferences are most obvious in the young animals, as pictured. In older animals the sable pheno-types are modified to or toward nonsable yellow. The genotypes of M iw h/ + versus + / +
or misp/+ mice in these stocks of known parentage were ascertained visually, in ab-sence of any visible white spotting, and 100 percent accuracy was confirmed by test mat-ings.
It should be noted that these relationships are true only with this specific white-spotting allele (Mivv"). All other white-spotting alleles
that we have observed1 produce a brightening
of the yellow pigmentation through reduction in the number of the few eumelanic pigment granules that are normally found in yellow mouse hairs. It is also obvious that these de-scriptions apply specifically to the expression of the alleles on a C57BL background. The expression of dominant yellow, at least, can be strongly influenced by the background genome, as clearly demonstrated by the phe-notype the same Ay allele produces on the DK background, as described below.
DK-Ay/a b/b mice (Figure 1A) are yellow until first molt, at which time they become dorsally eumelanic (sable). The eumelanic pigmentation is brown, in accordance with the b-locus genotype. These mice will be more fully characterized in a paper now in prepa-ration, but it is evident that they are not as obese as mice of the genotype C57BL/6]-Ay/a
B/B, and that the difference at the b locus cannot account for the difference in weight.
Discussion
The production of phaeomelanic (yellow) pigment by the hair follicle melanocytes of the mouse is of particular interest to biomedical science because of the pleiotropic effects that accompany the yellow pigmentation in mice of the genotype Ay/-. These include obesity, large size, high incidence of several tumors, abnormal hormonal and enzymatic levels, hyperglycemia, behavioral and reproductive abnormalities—all expressed in the mature mouse. In addition, there is a reduced size of unpigmented area in most genotypes of white-spotted lethal-yellow mice, as well as failure of the homozygous (Ay/Ay) embryo to implant1"3.
Characterization of the medically signifi-cant effects of the Ay/- mouse has not been as fruitful in clarifying the gene action at the agouti locus as has analysis of the means by which the agouti locus.genotype controls pigmentation. It is well demonstrated that replacement of phaeomelanosomes by eu-melanosomes in mottled, viable yellow (Avy/-) mice is accompanied by reduction in
severity of the other pleiotropic effects found in these mice. No efforts have been made to determine whether replacement of phae-omelanosomes by eumelanosomes in Ay /-mice of the sable phenotype produces a sim-ilar alleviation of the syndrome. The Miwh/ + Ay/a sable mice of the present study ap-peared obese at maturity, but also became less sable at maturity than in their first pelage. The DK-Ay/a mice become sable at maturity and are clearly less obese (compared with their a/a littermates) than are C57BL/6J-A>7a mice, which are not sable.
The genetic means by which sable is pro-duced are many, are very diverse, and are predictable. As summarized by Silvers3, the
following factors, in addition to the above-mentioned, may contribute to production of the sable phenotype in the mouse: alleles at the agouti locus [Aiy, Asy, sometimes Avy); polygenic combinations; alleles at other loci, in combination with dominant yellow; an in-version known as agouti-supressor.
Evaluation of the variety of genetic factors that affect the expression of the sable pheno-type and its correlation with other pleiotropic effects of the lethal-yellow syndrome would seem to offer a productive avenue of com-parative inquiry into the means by which the agouti locus exerts its extensive control over the physiological processes of the mouse.
R e f e r e n c e s
1. LAMOREUX, M. L. and E. S. RUSSELL. Develop-mental interactions in the pigmentary system of mice. I. Interactions between effects of genes on color of pigment and on distribution of pigmen-tation in the coat of the house mouse. /. Hered. 70:31-36.1979.
2. PAPPAIANOU, V. and R. L. GARDNER.
Investi-gations of the lethal yellow Ay/Ay embryo using
mouse chimaeras. JEEM 52:153-163.1979. 3. SILVERS, W. K. The Coat Colors of Mice.
Springer-Verlag, NY. 1979.
The Journal of Heredity 72:224-226. 1981.
Genetic variation of blood
groups in inbred lines of
Leghorns, derived from a
common base population
Hans Abplanalp, Ch. Hagger, and Ruth Briles
ABSTRACT: Nine inbred lines of White Leghorn chickens were developed by continued brother X sister mating over 10 generations. Initial matings were made in 1968 by selecting at random full sibs within each of two outbred lines of White Leghorns, which themselves had been selected since 1960 from a single population for high and low egg weight, respectively. A third base population for inbred lines consisted of a cross between the two selected lines. Blood types for the A, B, E, C, D, H, I, K, L and P blood group systems were obtained for individuals belonging to nine surviving inbred lines in 1977. All systems showed differences between lines attesting to the diverse genetic origin of the initial 1960 population that was based on eight different breeding flocks. Among the nine inbred lines, three were found to segregate for a single system; two lines segregated for two systems; and three lines segregated for three systems. The ninth line {no 92) was found to be poly-morphic for six of the blood group loci. The results agree with the assumption that none of the blood group sys-tems by itself showed heterozygosity in excess of ex-pectations for neutral genes. Intraline polymorphisms were in excess of neutral gene expectations only in one line in which substantial deviation from all other lines suggests that a recent pedigree error and not single-locus heterosis may be the source of its genetic vari-ability.
RECENT ADVANCES in immunogenetics have
emphasized the need for highly inbred lines of laboratory animals. In poultry this need can currently be met by lines initiated a decade or more ago, since even close matings such as brother X sister require over 10 generations to give inbreeding of 90 percent or better. Al-though calculated inbreeding coefficients give an indication of expected homozygosity there is an obvious need to check such predictions. An opportunity to conduct such an investiga-tion has presented itself in the form of nine inbred lines of White Leghorns developed at the Institute for Animal Breeding, Swiss Federal Institute of Technology, ETH. Zurich.
Materials and Methods
An effort to develop highly inbred lines of chickens was initiated in 1968 when full-sib matings were made in three closely related
The authors are affiliated, respectively, with the Department of Avian Sciences, University of Cali-fornia, Davis, CA 95616; Institute of Animal Pro-duction, Swiss Federal Institute of Technology, CH-8092 Zurich, Switzerland; and Department of Biology, Northern Illinois University, Dekalb, IL 60115. Blood typing work at Northern Illinois Uni-versity was supported in part by grant CA12796 from the National Cancer Institute, National Institutes of Health.
© 1981, American Genetic Association.
flocks of White Leghorns maintained at the Chamau chicken research facility of the An-imal Breeding Institute, ETH. The three base populations were derived from a single flock established in 1960, by crossing each of four strains of commercial chickens from the United States with four strains of local White Leghorns. This base material was then used in a selection experiment with two lines se-lected for high and low egg weight, respec-tively, as described by Menzi and Loertscher4
and by Hilfiker and Loertscher2. Successful
selection was applied until 1967 when the two flocks were crossed to produce an interme-diate unselected control, while selection was continued in the two parent lines. The fol-lowing year inbreeding by brother X sister matings was started from each of the three flocks. In each of them six inbred lines were thus initiated.
Subsequently, inbreeding proceeded suc-cessfully by continued brother X sister mat-ings in 12 of the initial lines, four from each flock. In order to insure the survival of inbred lines, each was propagated with several mat-ings of which one or more provided offspring for subsequent breeding. By thus restricting the number of families within inbred lines from which offspring were ultimately allowed to reproduce, it was possible to avoid the for-mation of distinct sublines and hence the re-tention of genetic variability beyond that ex-. pected within lines of single full-sib matings. However, selection for large family size within lines may have allowed some im-provement of viability and reproduction above that expected for inbreeding of pairs of randomly selected birds. Such selection is almost mandatory for the successful breeding of viable chicken inbreds.
Of the 12 lines remaining in 1968, three were lost before 1977 because of poor repro-duction; two of them had been derived from the high egg-weight line, and one from the low line.
Inbreeding coefficients of the selected lines were calculated from pedigrees. Thus by 1967 the high egg-weight line had an average in-breeding of 7.9 percent, the low egg-weight line, 7.7 percent. Their cross was noninbred with reference to the 1960 generation.
Red blood cell samples were collected for birds from each of nine lines in October 1977 representing the tenth generation of continued full-sib mating with calculated inbreeding slightly higher than 90 percent, depending on the flock of origin.
About 10 drops of donors' blood were col-lected into 5cc of sodium citrate anticoagulant solution as described by Briles1. Refrigerated
samples were then shipped by air to the lab-oratory of Dr. W. E. Briles, Northern Illinois University, DeKalb, where they arrived within 48 hours after collection. During the following week determinations of blood types were made for 10 blood group systems.
Because blood grouping was done for only a single generation, no reference to parental genotypes was possible, resulting in several ambiguities as to the presence of alleles re-acting as subtypes within a given system.
Notes
These cases will be mentioned within the re-sults.
Results
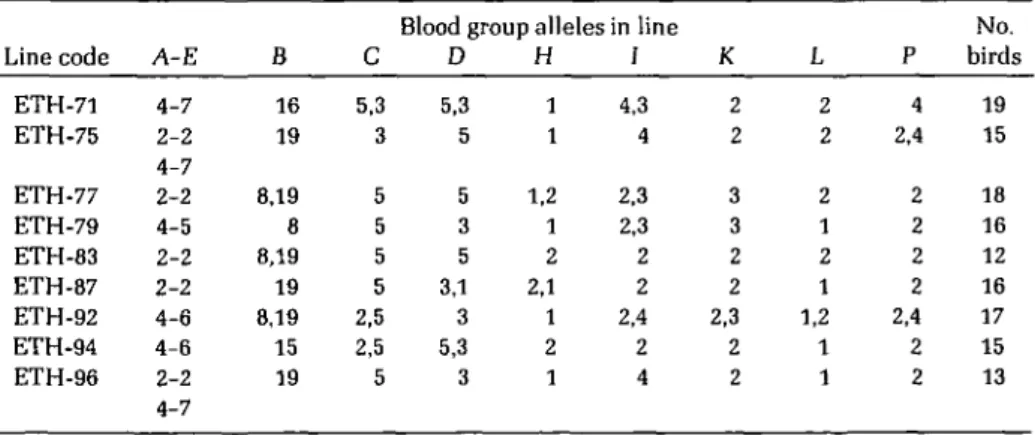
Blood types for the nine lines are summa-rized in Table I according to the alleles carried for each of 10 blood group systems (A, E, B, C, D, H, I, K, L, and P) as defined by Briles1. The
numerals shown in the body of Table I are labels of the alleles in question. Thus a "19" under system B for line 75 signifies that all alleles were B19, hence, the line was
homozy-gous at the B locus. Two numerals such as "5, 3" for system of C of line 71 means that alleles C5 and C3 were found in that line, C5 being
the more frequent. For systems A and E, which are known to be closely linked, the two alleles are shown in terms of linkage groups such as: A2-E2 and A4-E7.
Homozygosity of the individual lines can be judged from the number of blood group sys-tems still segregating. Of the nine lines, three (lines 79, 83, and 96) were fixed for all but one blood group locus, each segregating for a dif-ferent system; two lines (75 and 87) were se-gregating for two systems, again different ones in each line, and three lines were segregating for three blood group systems. In the case of line 75, there were actually three loci with two alleles each; but, for the A-E system, only a single segregating chromosome was involved. Finally, line 92 was found to be segregating for six of the nine independent genetic systems, a finding far outside the range of heterozy-gosity encountered in other lines.
Another way of looking at the results is to consider all lines as samples of the 1960 base population, ignoring, for simplicity, its early subdivision into egg weight selected subpop-ulations. In doing so, it will be noted that all blood group systems show genetic diversity: systems H, K, L, and P each with two alleles, systems C, D, and I with three, system B with four, and linkage group A-E being repre-sented by four haplotypes.
A further question arises with respect to possible association of certain blood group alleles with large egg size, as exhibited by differences between groups of inbred lines derived from either high or low egg weight parent flocks. Thus, lines 71 and 75 were
de-rived from the large egg flock, while lines 77, 79, and 83 derive from the small egg flock. Lines 87,92,94, and 96 go back to a cross of the two selected flocks. Apparently none of the alleles found in both lines 71 and 75 are missing from all other lines. However, for system I it appears that the large-egg lines both carry I4 but lack I2, while the three small-egg
lines all carry I2 while lacking I4. This
di-chotomy is suggestive of possible association of I4 with large-egg weight but would require
further studies on segregating progeny in in-termediate lines.
Estimates ofgenotype frequencies
In order to assess the importance of selec-tive forces in maintaining or eliminating blood group genes in lines under full-sib mating, one can contrast observed genotype frequencies with expectations pertinent to neutral alleles. In order to do so one would have to know the genetic makeup of the base population, or, in the present case that of the three subpopula-tions. Unfortunately, of the three selected outbred lines only the high egg-weight line is still in existence, but was not included in the survey. Under these circumstances an esti-mate of initial gene frequencies was obtained by counting alleles over all nine inbred lines. This approach would tend to ignore rare genes of the base population and would not account for alleles that might have been eliminated from all inbred lines. On the other hand, a fairly realistic assessment of blood group systems with heterozygote advantage should be possible by comparing observed heterozy-gosity within lines to expectations of neutral genes computed from the gene frequencies of combined inbreds.
An accounting of allele numbers is straightforward for codominant genes. How-ever, there were three cases in which the presence of one allele would obscure the de-tection of another, so-called subtype. Thus H2
is a subtype of H1, K3 a subtype of K2, and I3
a subtype of 14. Just as in the case of other re-cessive genes subtypes can be detected only as homozygotes and an appropriate allowance must be made in the estimation of their ex-pected frequency. In the case of full-sib lines where only two parents or grandparents are
Table I. Observed frequencies of 10 blood group genotypes in nine full-sib lines
Line code ETH-71 ETH-75 ETH-77 ETH-79 ETH-83 ETH-87 ETH-92 ETH-94 ETH-96 A-E 4-7 2-2 4-7 2-2 4-5 2-2 2-2 4-6 4-6 2-2 4-7 B 16 19 8,19 8 8,19 19 8,19 15 19 C 5,3 3 5 5 5 5 2,5 2,5 5
Blood group alleles in line D 5,3 5 5 3 5 3,1 3 5,3 3 H 1 1 1,2 1 2 2,1 1 2 1 / 4,3 4 2,3 2,3 2 2 2,4 2 4 K 2 2 3 3 2 2 2,3 2 2 L 2 2 2 1 2 1 1,2 1 1
May/June
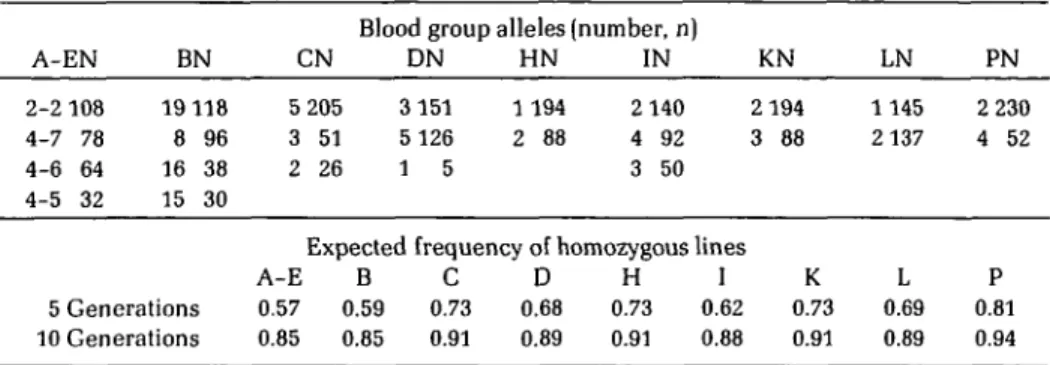
P 4 2,4 2 2 2 2 2,4 2 2 1981 No. birds 19 15 18 16 12 16 17 15 13 225Table II. Number (n) of blood group alleles added over nine lines for each of the 10 systems surveyed. Expected frequencies of homozygous lines according to the number of alleles and their respective frequencies are given for each blood group system, for 5 and 10 generations of
strict full-sib mating
A-EN 2-2 108 4-7 78 4-6 64 4-5 32 BN 19 118 8 96 16 38 15 30 CN 5 205 3 51 2 26
Blood group alleles (number, n) DN 3 151 5 126 1 5 HN 1 194 2 88 IN 2 140 4 92 3 50 KN 2 194 3 88 LN 1145 2 137 PN 2 230 4 52 5 Generations 10 Generations
Expected frequency of homozygous lines A-E B C D H I 0.57 0.59 0.73 0.68 0.73 0.62 0.85 0.85 0.91 0.89 0.91 0.88 K 0.73 0.91 L 0.69 0.89 P 0.81 0.94
Table III. Observed and expected frequencies of homozygous lines for nine
independent blood group systems No. loci segregating Frequency of lines obs. exp. 0 3/9 = 0.33 3/9 = 0.33 2/9 = 0.22 1/9 = 0.11 2/8 = 0.25 1/8 = 0.13 3/8 = 0.37 2/8 = 0.25 0.39 0.39 0.17 0.045 0.00 0.43 0.38 0.15 0.03
involved, gene frequencies can only assume values of Vt, Vz, or % and an approximate value can be assigned fairly easily.
Expected frequency ofhomozygosity For a given locus the process of inbreeding by full-sib mating can be represented by all possible pairs, or mating types, involving the alleles of the base population. For two alleles only four mating types need be considered, namely those between two like homozygotes, between two unlike homozygotes, between two heterozygotes, and matings of a homozy-gote of either kind with a heterozyhomozy-gote. With three alleles in the base population seven mating types are possible, as there are with four alleles. Progeny from each mating type can then be mated among each other in turn at frequencies appropriate for their random occurrence and the results arranged in the form of a transition matrix (A) showing the expected frequencies with which a given pa-rental mating type gives rise to each mating type in the following generation. Expected frequencies of mating types in the base pop-ulation can be calculated on the assumption of randomly chosen pairs and expressed as the initial frequency vector of mating types in generation zero (/°). Frequencies of mating types in generation (I) of full-sib mating can then be derived from the matrix equation (/') = (A)'(/°) as shown by Kemthorne3 among
others. The expected frequency of lines homozygous for a given locus is then repre-sented by the frequency of pair matings be-tween like homozygotes.
Expected frequencies of homozygous lines for each locus are given in Table II for 5 and 10 generations of strict full-sib mating, re-spectively, and on the assumption of selec-tively neutral alleles at observed average
frequencies. It can be seen that for 10 gener-ations of inbreeding, homozygosity is expected to lie within very narrow limits of 0.85 for the A-E complex with four alleles to 0.91 for the K locus. Generally blood groups with a single type predominating in the base population would have higher expected homozygosity, while systems with equally frequent alleles initially would retain somewhat more heter-ozygosity. For practical purposes, however, inbreeding in the absence of selection would result in almost equal expectations of about 90 percent of homozygous lines and 10 percent still segregating. Considering the A-E complex as a single locus we have nine blood group systems segregating independently, and can determine the probabilities of P(0), P(l), P(2) and P(3) having zero, one, two, and three loci segregating within a given line, following a binomial distribution with P = 0.9 and sample size n = 9. These can then be compared with the results observed for the nine inbred lines shown in Table III. Although 43 percent of the lines would be expected to be completely homozygous after 10 generations of full-sib mating, none was observed in this experiment. On the other hand, two of the lines were still heterozygous for three blood group systems when only one in 30 would be expected, suggesting that heterozygosity was somewhat greater than expected for neutral genes.
Line 92 with six blood group systems se-gregating stands out as an extreme case that cannot be explained on the assumption of selectively neutral genes. Such a result also seems most unlikely on the assumption of heterozygote advantage at the six loci. The most plausible explanation thus can be found in a pedigree mistake made in a recent gen-eration, resulting in a line-cross followed by renewed inbreeding.
After excluding line 92 from consideration one can then compare expected frequencies
of lines segregating for a given blood group system. Here again we observe a slight excess of heterozygosity over the expected. Thus, only two systems, K and L, were homozygous in all lines while systems D and I appear to be the most heterotic. However, with only eight inbred lines under consideration firm con-clusions about any one system would seem unwarrented.
In conclusion, our results indicate that none of the blood group systems, taken by itself, showed heterozygosity within lines exceeding expectations for neutral genes. This conclu-sion is probably largely due to the relatively small numbers of birds sampled. However, when all lines are considered jointly it is found that the numbers of lines segregating for two or three blood group systems exceed ex-pectations, while none of the lines was com-pletely homozygous. These findings suggest an excess of segregating blood group loci over what one might expect for neutral genes. It is thus likely that further, more substantial sur-veys of these same lines could pinpoint which ones of the blood group systems examined show heterozygotes in excess of the expected frequency.
References
1. BRILES. W. E. Additional blood group systems in the chicken. Ann. New York Acad. Sci. 97: 173-183.1962.
2. HILFIKER, [. and H. LOERTSCHER. Untersuchung
ueber die Erblichkeit des Eigewichts bei Lege-beginn (Selektionsversuch bei Gefluegel). Arch. Ge/luege/k. 36:81-88.1972.
3. KEMPTHORNE, O. An Introduction to Genetic Statistics. John Wiley & Sons, NY. 1957.
4. MENZI. M. and H. LOERTSCHER. Ein
Selektion-sexperiment in entgegengesetzter Richtung. Z. Tierzuechfg. Zuechlungsbiol. 80:267-277.1964.