Determination of Reliable Grain Boundary Orientation using
Automated Crystallographic Orientation Mapping in the Transmission
Electron Microscope
Xinming Zhang1, Jorgen F. Rufner1, Thomas LaGrange2,3, , Ricardo H.R. Castro1, Julie
M. Schoenung1, Geoffrey H. Campell2, Klaus van Benthem1
1
Department of Chemical Engineering and Materials Science, University of California, Davis, CA 95616 USA
2
Physical and Life Sciences Directory, Lawrence Livermore National Laboratory, 7000 East Ave, Livermore, CA 94550 USA
3
now at: Ecole Polytechnique Federale de Lausanne, Interdisciplinary Center of Electron Microscopy, 1015 Lausanne, Switzerland
Precession assisted automated crystallographic orientation mapping (PA-ACOM) in TEM allows automated collection and indexing of electron nanodiffraction patterns from an area scanned by the electron beam. Acquisition and subsequent indexing of a large number of diffraction patterns obtained from the scanned area provides capabilities to generate orientation maps similar to electron backscattered diffraction. PA-ACOM bears significant advantages over equivalent scanning electron microscopy techniques for the determination of grain boundary orientations in nanogranular materials due to the fact that orientation is determined using transmission electron diffraction rather than backscattered Kikuchi patterns. This study demonstrates quantitatively that the compensation of second order aberrations introduced by high-angle precession of the electron beam is critical for the reliable determination of grain boundary orientations.
Two different types of materials were investigated to evaluate PA-ACOM based grain
boundary analysis: a polycrystalline MgAl2O4 ceramic and a 5083 aluminum alloy
composite. Nanocrystalline MgAl2O4 with a final average grain size of 150nm was isothermally sintered at 1300 °C for 40 minutes in air. The 5083 aluminum alloy composite, consisting of coarse-grained aluminum (grain size 600-2600 nm) and ultra-fine grained 5083 aluminum (average grain size around 200 nm), was fabricated via cryomilling and subsequent hot isostatic pressing. More details regarding the synthesis of these two different types of materials are described elsewhere [1–3].
Table 1 summarizes average confidence indices (CI) for orientation maps obtained
from both materials. The data for MgAl2O4 demonstrate that compensation of aberrations
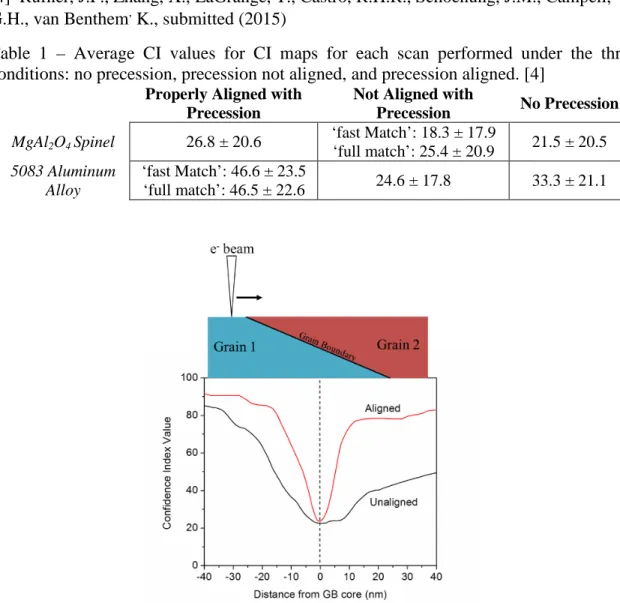
through the alignment procedures for beam precession improves confidence indices during ACOM. Highest average CI values are obtained using the ‘full matching’ procedure for data analysis. Although it was expected that smallest CI values are obtained without beam precession, the lowest average CI value was observed for experiments with misaligned beam precession and subsequent analysis using the ‘fast matching’ procedure, i.e. only a subset of diffraction pattern templates was considered for automated indexing [4]. ACOM is sensitive to accurate template matching, and improper compensation of lens aberrations that result from beam precession can lead to less reliable results than data obtained in the absence of precession. To illustrate the effects of precession alignment on grain boundary analysis, CI data across a single grain boundary were plotted in Fig.1.
Paper No. 0830 1663
doi:10.1017/S1431927615009095 © Microscopy Society of America 2015
Microsc. Microanal. 21 (Suppl 3), 2015
https://doi.org/10.1017/S1431927615009095
While with and without aberration compensation a confidence index of 20 was obtained at the center of the grain boundary, the improper alignment led to lower confidence indices extending at least 40 nm in each direction. After proper alignment, however, confidence indices only dropped significantly within 10 nm of each side of the grain boundary core.
Reference
[1] Rufner J, Anderson D, van Benthem K, Castro RHR. J Am Ceram Soc 2013;96:2077. [2] Vogt R. Ultrafine-Grained Aluminm and Boron Carbide Metal Matrix Composites.
[S.l.]: Proquest, Umi Dissertatio; 2011.
[3] Vogt R, Zhang Z, Topping TD, Lavernia EJ, Schoenung JM. J Mater Process Technol 2009;209:5046.
[4] Rufner, J.F., Zhang, X., LaGrange, T., Castro, R.H.R., Schoenung, J.M., Campell,
G.H., van Benthem, K., submitted (2015)
Table 1 – Average CI values for CI maps for each scan performed under the three conditions: no precession, precession not aligned, and precession aligned. [4]
Properly Aligned with Precession
Not Aligned with
Precession No Precession MgAl2O4 Spinel 26.8 ± 20.6 ‘fast Match’: 18.3 ± 17.9 ‘full match’: 25.4 ± 20.9 21.5 ± 20.5 5083 Aluminum Alloy ‘fast Match’: 46.6 ± 23.5 ‘full match’: 46.5 ± 22.6 24.6 ± 17.8 33.3 ± 21.1
Fig.1 The histogram shows CI values for an intensity line scan of a grain boundary with precession on but not aligned (black line), and aligned (red line). Reproduced with permission form [4].
1664 Microsc. Microanal. 21 (Suppl 3), 2015
https://doi.org/10.1017/S1431927615009095