269
Quantitation of Human Immunodeficiency Virus Provirus and Circulating Virus:
Relationship with Immunologic Parameters
s.
Yerly, E. Chamot, B. Hirschel, and L. H. Perrin Central Laboratory of Virology. Division of Infectious Diseases. and Medical Outpatient Clinic. Geneva University Hospital. SwitzerlandVirologic and seroimmunologic parameters were determined in 56 persons infected with hu-man immunodeficiency virus (HIV). The provirus level varied from 10 to 100,000/106CD4+ lymphocytes, and genomic HIV RNA was detectable in 39 of 56 patients at a relative concentra-tion varying from 10 to >250 copies/ml, of serum. Provirus expressed as copies per 106CD4+ lymphocytes and as circulating virus per milliliter of serum increased with disease progression and decrease of CD4+ cell concentration. The mean provirus concentration expressed per milli-liter of blood varied little among categories of patients with various levels ofCD4+ cells, but there was a progressive increase of circulating HIV genomic RNA. These virologic data suggest that during the course of HIV infection, an increasing proportion of the remaining CD4+ lympho-cytes harbor the HIV genome and produce infectious virus. Finally, there was a marked correla-tion between increased provirus and genomic RNA concentracorrela-tion and three seroimmunologic markers: decrease in CD4 +cell count, p24 antigenemia, and disappearance of antibodies to HIV core antigen.
Human immunodeficiency virus (HIV) induces a persis-tent infection that progresses slowly from asymptomatic in-fection to AIDS. Antiretroviral therapy may delay progres-sion. The identification of factors that correlate with progression or regression of HIV infection is important for prognosis and for the monitoring of treatment.
CD4+ lymphocytes are the main target of HIV infection [I], and the decline in CD4+ cell concentration is the best predictive factor for progression to AIDS. Other markers with predictive value are p24 antigenemia, antibodies to HIV core antigen (anti-core), and serum levels of neopterin and .B2-microglobulin [2, 3]. Previous studies [4-6] have at-tempted to detect HIV itself in plasma and in peripheral blood mononuclear cells (PBMC) and demonstrated, using appropriate coculture techniques, that viremia is present in most infected patients and that the virus load increases with disease progression. In clinical trials, the biologic effects of antiviral therapy are assessed mainly by counting CD4+ lym-phocytes and by measuring .B2-microglobulin and p24 anti-genemia [7-9]. Quantitative determination of infectious HIV in PBMC and plasma is expensive and technically de-manding; it has therefore been done in only a few
investiga-Received 16 December 1991; revised 12 March 1992.
Informed consent was obtained from all participants. and human experi-mental guidelines of the US Department of Health and Human Services and of the Ethical Local Committee were followed.
Financial support: Swiss Federal Office of Public Health (Cohort Study. Part A) and the National AIDS Research Program.
Reprints or correspondence: Dr. Luc Perrin. Central Laboratory ofVirol-ogy. Geneva University Hospital, 1211 Geneva 4. Switzerland.
The Journal of Infectious Diseases 1992;166:269-76 ©1992 by The University of Chicago. All rights reserved. 0022-1899/92/6602-0007$01.00
tions, in which viremia usually decreased after zidovudine therapy [4, 5].
The polymerase chain reaction (PCR) offers a simple method to quantify proviral HIV DNA and genomic HIV RNA. The aim of this study was to determine virologic pa-rameters in a large group of patients with various clinical presentations and to analyze the relationship between virolo-gic parameters, such as provirus and circulating virus, and seroimmunologic parameters.
Patients and Methods
Study population. Fifty men and 6 women with serum anti-bodies to HIV-I participated. Eleven were asymptomatic (Centers for Disease Control [CDC] stage II); 21 had persistent generalized lymphadenopathy (CDC stage III); 12 had CDC stage IV disease (10, IV-C-2; 2, IV-D, analyzed together); and 12 had CDC stage IV-C-I disease [10]. The mean CD4+ lym-phocyte counts in these four subgroups were 497, 481,254, and 45/#LL, respectively. Negative control samples were collected from 20 blood donors with no antibodies to HIV-I. A number of participants were on zidovudine treatment: 2 with CDC stage II disease (55 and 33 days), I with stage III (165 days), 3 with stage IV-C-2 or IV-D (48,65, and 766 days), and 7 with stage IV-C-l (83, 120, 139,308,386,572, and 659 days).
Seroimmunologic data. EDTA-treated blood (10-20 mL) and native blood (10 mL) were collected from the participants by venipuncture and processed within 4 h. Native blood samples were centrifuged at 1500gfor 10 min, and sera were aliquoted and frozen at -70°C. Complete blood count was done, and the absolute concentrations of CD3, CD4, and CD8 lymphocytes were determined by flow cytometry (Coulter EPICS IV; Instru-mente Gesellschaft, Basel, Switzerland) using fluoresceinated OKT3, OKT4a, and OKT8 monoclonal antibodies (Ortho-mune; Ortho Diagnostics, Raritan, NJ). HIV-I-specific anti
bod-270 Yerly et al. JID 1992: 166 (August)
ies were determined by EIAs (Abbott recombinant HIV-I/HIV-2 EIA and Envacor, Abbott Laboratories, Abbott Park, IL) and Western blot (Du Pont, Geneva). Levels of p24 antigen were measured in duplicate, and positive samples were neutralized with antibodies to HIV-I (HIVAG-I ; Abbott). Serum f12-mi-croglobulin levels were determined using a commercial assay (IMX f1rMicroglobulin; Abbott). All the EIAs were done in batch testing.
Semiquantitation ofHIVprovirus. PBMC were isolated by Ficoll-Paque (Pharmacia, Dubendorf, Switzerland). The pellet containing 1-20 X 106PBMC was incubated overnight at 37°C in a lysis buffer containing 100 mMNaCl, 50 mMTRIS-HCI (pH 7.5), I mMEDTA, 0.5% SDS, and 100 ILg/mL proteinase K. After phenol-chloroform extraction, DNA was precipitated with ethanol and resuspended in TE buffer (10mMTRIS-HCl, pH 7.5, ImMEDTA). The LAV-8E5 cell line (National Insti-tute of Allergy and Infectious Diseases, AIDS Research and Ref-erence Reagent Program, Bethesda, MD) containing one copy of HIV -I provirus per cell was grown in culture as recom-mended [II]. DNA was extracted from a pellet of 50 X 106cells and serially diluted in HIV-negative human genomic DNA to obtain the equivalent of 1-1000 LAV-8E5 cells in IILgof hu-man genomic DNA/ I0 ILL. For provirus amplification, a 238-bp segment of a conserved region of the HIV-I polgene was se-lected and amplified [12]. All samples were tested in duplicate using IILgofgenomic DNA corresponding to 150,000 cells/test. The reaction mixture of 100 ILl containing I ILg of genomic DNA and 2.5 units of DNA polymerase (Amplitaq; Perkin-Elmer Cetus, Norwalk, CT) was adjusted to 10mMTRIS-HCl (pH 8.3),50mMKCl,2.5mMMgC I2, 0.5mMofeach deoxynu-cleoside triphosphate (dNTP), 0.5 ILMof POL I and POL 2 primers (POL 1,5'-TGGGTACCAGCACACAAAGG, 3734-3753 in HIV BRU; POL 2,5'-ACTTGTCCATGCATGGC-TTC, 3953-3972 in HIV BRU) [13]. The reaction was cycled 37 times (94°C, I min; 56°C, 1.5 min; 72°C, I min) using a DNA thermal cycler (model 480; Perkin-Elmer Cetus) [12]. Five samples of human genomic DNA containing 1,3, 10, 100, and 1000 copies of HI V provirus from the LAV-8E5 cells were included in each experiment.
The denatured PCR product was applied to nylon membrane (GeneScreenPlus; NEN, Boston) using a vacuum filtration appa-ratus (Minifold II; Schleicher& Schuell, Keene, NH). Filters were incubated for I h at 45°C in prehybridization solution (4X SSC [standard sodium citrate], 5X Denhardt's solution, 5%SDS,
20mMsodium phosphate [pH 7], 100 ILg/mLsheared and dena-tured salmon sperm DNA) and hybridized to a 32P-Iabeled probe (5'-AATTGGAGAGCAATGGCTAGTGA, 3863-3885 in HIV BRU) by incubation at 50°C overnight (specific activity, 108cpm/ILg). Then filters were washed 15 min at 50°C, once with 3X SSC and 0.1 %SDS, once with 0.5X SSC and 0.1 %SDS, then twice with 0.1 X SSC and 0.1 % SDS. The radioactivity of each spot applied to the nylon membrane was determined using the Phosphorlmager system (Molecular Dynamics, Basel, Swit-zerland).
The number of HI V proviral copies was calculated in relation to the standard curve generated by using DNA from defined cell equivalent of the LAV-8E5 cell line. To relate the number of proviral copies to 106CD4 cells, the number ofcopies measured
in IILgof DNA corresponding to 150,000 cells was multiplied by a correcting factor (6.66) and further divided by the ratio of CD4 cells per microliter to total lymphocytes per microliter. We have shown previously that the sensitivity of proviral HIV DNA detection is on the order of one proviral copy per sample [12, 13]. The one-copy samples were detected in 6 of 14 experiments and three copies in at least one of the two duplicate amplifica-tions in all assay runs. Negative samples (serum from Hl'V-ser-onegative blood donors included in each run) gave numbers (pixels) nearly the same as the background value measured on the membrane in the absence of DNA. Reference samples with the equivalent of one proviral copy gave numbers at least twice the background value. The coefficient of correlation between points of the standard curve is typically --0.98. Interassay varia-tion, checked using 10 different samples in three different exper-iments, was 30%; intraassay variation was 19%.
HIV RNAsemiquantitation. Circulating genomic HIV RNA
was detected after immunocapture of the virus, reverse tran-scription (RT), and cDNA amplification. To prepare the im-munoabsorbent, IgG was purified from 35 mL of pooled sera from 10 patients with a high titer of anti-HIV-I antibodies and no circulating antigen by ammonium sulfate precipitation [14] and diethylaminoethyl cellulose chromatography. IgG (200 mg) was coupled to 5 g of cyanogen bromide-activated Sepharose 4B (Pharmacia) according to the manufacturer's recommenda-tions. The final step was extensive washing with 2 L of2% Noni-det P-40 (NP40) in TE buffer. The coupling efficacy was 75%. Sepharose was stored in PBS plus 0.02% NaN3at 4°C.
Immunocapture of circulating virus was achieved as follows: 100 ILL of frozen serum or dilutions was adjusted to 200 ILL with
150 mMNaCI and incubated on a rotator overnight at 4°C with 20 ILL of 5% Sepharose suspension (a threefold excess as deter-mined in preliminary experiments). The Sepharose particles were pelleted, washed twice with 150mMNaCl, suspended in 5 ILL of 1%NP40, and heated at 95°C for 5 min. RT was done in 20 ILL containing 50 mM TRIS-HCI (pH 8.3), 20mMKCI, 6
mMMgCI2, ImMof each dNTP, 25 units of RNase inhibitor (Boehringer, Mannheim, Germany), 100 pmol of dN6random primers (Boehringer), and 200 units of Moloney murine leuke-mia virus reverse transcriptase (BRL, Bethesda, MD). The mix-ture was incubated 10 min at room temperamix-ture and I h at 42°C, heated to 95°C for 15 min, then 2 ILl of 0.05 mg/mL solution of proteinase K (Sigma, St. Louis) was added. The mix-ture was incubated at 55°C for 30 min, heated to 95°C for 15 min, and cooled to 4°C. Next, cDNA was amplified as described above for provirus amplification.
Circulating genomic HIV RNA was measured semiquantita-tively by using serial dilutions of serum in the absorption step. All sera were tested at least twice without dilution (100 ILL of serum) and when diluted 10 and 25 times with 150mMNaCl. Samples positive without dilution were diluted twice and tested singly. Identical results were obtained with duplicate tests for all but 3 samples; these 3 were retested three times, and the result used was the mean of the five determinations. Each set of ex peri-ments included a negative control (serum from a blood donor), two known weakly reactive sera, and, for the PCR step, dilutions of LA V-8E5 DNA. The two weakly positive samples (RNA of <10 but> I copy/rnl.)included in each run gave positive results
1ID 1992; 166 (August) HIV: Virologic and Immunologic Markers 271
RNA >100/ml RNA >-250Iml
Figure 1. HIV provirus levels in relation to circulating genomic RNA. Provirus is ex-pressed as log ofprovirus/LO" CD4+ lympho-cytes. Participants are divided into four groups on basis of level of RNA molecules detected/ mL of serum. Number of participants with various levels of provirus for each category is shown at bottom. %per subclass 10.0% 75% 50% 25% 0%
RNA undetect RNA >10/ml
log >- 4
-
1 6 log - 3-
7 8 log - 2-
7 8 log - 1 2 3 0-17 0-25 3 2o
o
8 1o
o
in 14 of 15 experiments. The results of RNA copy number are measured as a function of the dilutions of LAV-8E5 DNA and are expressed as undetectable, > 10copies/ml.(positive signal using 100 JLL of serum and negative signal using 10 JLL of serum), > 100copies/ml.,and >250copies/ml., As a control, serum of each participant was absorbed on Sepharose, and the pellet was amplified without the reverse transcriptase step; none gave a positive signal. For determining circulating HIV RNA, -70°C frozen stored sera were tested within 3 months of collec-tion. No decline of HIV RNA level has been observed when serial unthawed samples have been tested repeatedly over 4-6 months.
Statistical analysis. Groups were compared using thex2test
with Yates's correction or the two-tailed Fisher's exact test.
Results
Figure I presents the relationship between number of pro-viral copies and concentration of genomic pro-viral RNA in serum. The provirus was detectable in all participants, whereas genomic RNA was detectable in 39 (70%) of 56. In general, persons with a high number of proviral copies also had high RNA levels. High numbers of proviral copies
(~1000 copies/I 06CD4+ lymphocytes) were detected in all participants with > 100 copies of genomic RNA/mL of serum compared with 22 (52%) of 42 participants with < 100 copies/ml.(P
=
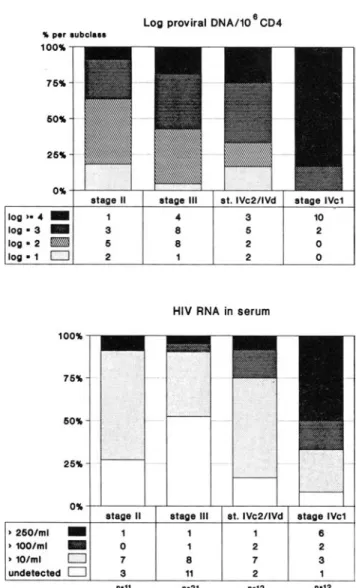
.008).In figure 2, provirus and circulating virus are shown in relation to clinical stages. A high number of proviral copies (log ~3)was found in 20 (83%) of 24 participants in CDC stages IV-C-2, IV-C-l, or IV-D compared with 16 (50%) of 32 participants in CDC stages II and III(P=.02). More than 100 RNA copies/mi. were found in 11 (46%) of 24 partici-pants with stage IV disease compared with 3 (9%) of32 partic-ipants with stage II or III(P= .005).
The concentration ofCD4+ lymphocytes in the peripheral blood is often used as a prognostic marker. In figure 3, results are expressed in relation to four categories ofCD4+ cell con':' centration. Concentrations of provirus per 106CD4+ lym-phocytes and of circulating genomic RNA both increase when the CD4+ cell count decreases. More than 1000 pro-viral copies were found in 25 (96%) of 26 participants with CD4+ cell counts <200!JLL compared with 11 (37%) of 30 participants with CD4+ cell counts >200/Jl,L (P < .001). More than 100 RNA copies/ml, were found in 13 (50%) of 26 participants with CD4+ cell counts <200/JLL compared with 1 (3%) of 30 participants with CD4+ cell counts >200/ JLL(P< .001).
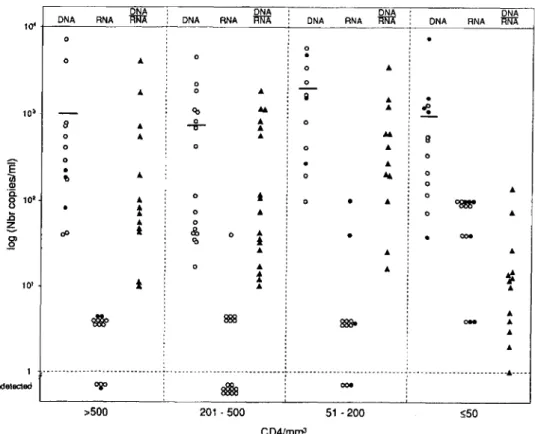
Figure 4 shows concentrations (values) of provirus (DNA) and circulating genomic RNA and the ratio between them for individual subjects. The values are expressed per milli-liter of blood, to determine the virus load, and are presented for four categories of CD4+ concentration. It appears that individual values of provirus vary to a greater extent within each category than do the mean values of the four categories. Furthermore, this does not seem to be linked to zidovudine treatment. In contrast, the percentage of patients with circu-lating genomic HIV RNA increases markedly in the two groups of participants with CD4+ cell counts <200/Jl,L com-pared with those with> 200/JLL.
The ratio of provirus to circulating genomic RNA (also shown in figure 4) indicates that the concentration of pro-virus exceeds the concentration of circulating pro-virus until late in the disease (participants with CD4+ cell counts<50/JLL). In figures 5-7, concentrations of provirus and circulating genomic RNA are reported in relation to presence or ab-sence of p24 antigen, to high or medium level of or abab-sence of anti-p24 antibodies, and to ~3 or <3 mg/mL {j2-micro-globulin. Associations were found between virologic
parame-272 Yerly et al. JID 1992; 166 (August)
Log proviral DNA/10ISCD4 (50%) of 18 participants without anti-p24 antibodies
com-pared with 5 (13%) of 38 participants with anti-p24 antibod-ies(P
=
.007). However, the associations were far from per-fect; for example, 50% of p24 antigen-negative subjects had detectable circulating genomic RNA, and some participants with high levels of anti-core antibodies had high levels of provirus and circulating RNA.Only limited follow-up was available after these tests (be-tween September 1990 and May 1991). Five subjects have died (21 days, 91 days, 105 days, 7 months, and 8 months) since completion of this investigation. All had >250copiesj
mL circulating genomic RNA (of9 total subjects with >250 copiesjmL) and> 104copies of provirusjI06CD4+ cells (of 18 total subjects with that level). Their CD4+ cell counts at the time of the investigation were 2,7,8, 16, and 7I jilL.
atage III at. IVc2/1Vd atage IVc1
..
3 10 8 6 2 8 2 0 1 2 0 1 3 5 2 atage II 50ft 76ft 25ft .. per .ubol••• 100ft log··" _ log·3 _ log· 2 _ log· 1 CZJHIV RNA in serum
100ft
nlllllf-50ft
25ft
Oft
atage II atage III at. IVc2/1Vd atage IVc1
·260/ml
-
1 1 1 8 .1OO/ml-
0 1 2 2 .10/ml c:EJ 7 8 7 3 undetected 0 3 11 2 1 "·11 "·21 "·12 "·12 ISLog proviral DNA/10 CD4 ".-reullol. . . 100ft 75ft 60ft 25ft Oft .500 CD" 201 - 600 61 - 200 c. 60 CD" log·· ..
-
0 1 7 10 log· 3-
3 7..
..
log· 2-
8 8 1 0 log • 1 LZII 2 3 0 0HIV RNA in serum
60ft 26ft 75ft 100ft
nTTTTB---.-.r-Oft .600 CD" 201 - 600 61 - 200 c_60 CD" .260/ml-
0 0 1 8 .1OO/ml-
0 1 1 3 • 101mI 0 9 6 7 3 undetected CJ..
10 3 0 "·13 "·17 "·12 "·14 Figure 3. HIVload in relation to CD4+lyrnphocytes/ul., Partici-pants are divided into four groups according to concentration of CD4+ in peripheral blood. Number ofCD4+ cells in each category is shown at bases of columns. Results of provirus and circulating HIVRNA are expressed as in figure 2.Figure 2. HIV load in relation to disease stage according to Centers for Disease Control (CDC) classification. Top, number of proviral copies in different CDC stages. Results of provirus (DNA) are expressed as log of provirus per 106CD4+ lymphocytes. Bot-tom, number of RNA rnolecules/ml. of serum for different CDC stages. Results of circulating genomicHIV RNA are reported as undetectable, > 10 molecules/rnl., > 100 molecules/rnl., and> 250 molecules/ml.,Number of participants is shown at bottom of each graph.
ters and both p24 antigen and anti-p24 antibodies but not {32-microglobulin. As shown in figure 5, > 1000 copies of HIV provirus/TO" CD4+ lymphocytes were detected in 20 (91 %) of 22 participants with p24 antigen compared with 16 (47%) of 34 participants without p24 antigen (P
=
.002). More than 100 RNA copiesjmL were found in II(50%) of 22 participants with p24 antigen compared with 3 (9%) of 34 participants without p24 antigen (P = .002). As shown in figure 6, > 1000 copies of provirus were found in 17 (94%) of 18 participants without anti-p24 antibodies compared with 19 (50%) of 38 participants with anti-p24 antibodies(P=
.006). More than 100 RNA copiesjmL were found in 9JID 1992; 166 (August) HIV: Virologic and Immunologic Markers 273
DNA DNA DNA DNA
1Q4 DNA RNA m::JA DNA RNA m::JA DNA RNA m::JA DNA RNA m:JA
0
0 0
.
0 A0 A
Figure 4. HIV provirus copies 0 0
A 0
..
(DNA) and circulating HIV RNA/
...
Q A..
•
~
mL of blood and ratio of provirus 103 <0
8 0 A 0
to HIV RNA. Values of circulating A -cr- A
0 A
..
....
9HIV RNA have been adjusted for 0 0 0
..
hematocrit of 40% (RNA/mL val- 0 0
E
..
ues divided by 2.5). For determina-
•
A 0 la 0U, !l 0
tion of ratio of DNA to RNA, "g.-Ql
..
1Q2 0
,
0value of I (I copy of RNA/mLof 0
..
0•
A ~t
.0 0
..
0 Ablood, concentration of RNA not A 0
detectable in our system) has been ~ c:P t & 0 A
•
ooe~ '0
,
attributed to samples with undetect-
..
..
Aable circulating RNA. Participants 0
..
A'J
are grouped according to CD4+ 10'
t
t..
Aconcentration.0, participants not treated with zidovudine:e,
partici-~ ~
..
pants treated with zidovudine; A., OM
..
Aratio of provirus divided by HIV
..
RNA; horizontal bars, mean value.
1 ...__..-_...._---_._--_.__.--..---_.._---_....__.__..-....---.__._----._--- ---..._---_.._----._-
..
----undetected ~
8l1la
ooe>500 201 ·500 51 - 200 :550
CD4/mrnJ
Discussion
In this study, a close association was observed between virologic parameters and seroimmunologic markers com-monly used for the evaluation of HIV infection, such as CD4+ lymphocytes, p24 antigenemia, and core anti-bodies.
The virologic parameters selected explore different aspects. Semiquantitation of the provirus is related to the reservoir of HIV, although cell types not represented in the peripheral blood (such as Langerhans cells) may be an im-portant reservoir of HIV [15]. Circulating genomic RNA re-flects viremia and is linked not only to viral replication but also to viral clearance, which may be more efficient in early stages of HIV infection. The result of these two factors (repli-cation and clearance of HIV) as determined by circulating genomic RNA is a sensitive index of the quantity of HIV available for propagation of the infection.
The virologic parameters measured in this investigation provided semiquantitative information. The choice of apol gene segment for HIV DNA amplification was based on the low number of base substitution among HIV isolates in these parts of thepol gene [12, 13]. A method based on immuno-capture of the virus rather than RNA purification was se-lected for the detection of circulating HIV. For the capture of circulating virus, we used polyclonal (rather than monoclo-nal) antibodies to HIV to avoid biases linked to sequence variations ofgp 120 among HIV isolates. The absorption step
is convenient in terms of rapidity, simplicity, specificity (only the virus is absorbed), and suitability for quantitation by limiting dilutions. The main limitation of the quantitation of RNA is linked to the RT step, whose efficacy is --5% [16] (in contrast, DNA amplification can detect a single copy of provirus [12, 17, 18]). For this reason, it may be more appro-priate to express the results of circulating RNA in arbitrary units rather than in number of RNA molecules per milliliter. However, for simplicity of expression and to avoid artificial manipulations of the data, results are expressed in terms of relative concentration of RNA molecules per milliliter. Al-though they are relative, RNA results are reproducible; they are therefore suitable for comparative studies.
When the provirus measurements were regarded in rela-tion to 106CD4+ lymphocytes, we observed, as have others, an increase of proviral copies with progression of HIV infec-tion and with the decrease in CD4+ cell concentrainfec-tion [3, 4, 17,19-21]. Only a few copies of provirus are detectable in each infected PBMC [17], so our results suggest there is a progressive increase in the percentage of cells carrying the provirus that may reach 10%. The other mode of expressing the number of proviral copies per milliliter of blood reflects the absolute concentration of the provirus and is a better estimate of the HIV reservoir in CD4+ lymphocytes. During the progression of HIV infection, the mean concentration of provirus per milliliter of blood increases by only a factor of three for subjects with the lowest concentrations of CD4+ lymphocytes. Greater variations are observed among
individ-274 Yerly etal. liD 1992; 166(August)
Log proviral DNA/106CD4
,. per .ubel••• log)-4 _ log - 3 _ log - 2 ~ log - 1 I23IJ p24 Ag undetected 6 10 13 5 p24 Ag positive 12 8 2 o
tion system [3,4,6, 19,22]. For example, in one large study, the percentage of plasma coculture positivity varied from 23% in asymptomatic participants to 82% in patients with AIDS [3]. The marked variation in concentration of in-fectious virus reported by different groups using HIV culture [3, 4, 19] underlines the need of alternative approaches for the analysis of virologic parameters. Recently, Zang et al. [16], using an RNA PCR assay, detected circulating genomic RNA in 100%of individuals with AIDS-related complex and in 60% ofasymptomatic individuals. Other investigators have reported a correlation between disease stage and viral RNA in serum [22, 23], as was seen in the present study.
Participants with CD4+ counts >200//-LL can be divided into two subgroups: those without detectable circulating
HIV RNA in serum Log proviral DNA/106CD4
4 9 6 5 anti-Core )- 10 4 2 8 o 1-cantl-Corec10 10 7 1 o Undetected 0'10 25'10 log)- 4 _ log -3 _ log - 2 ~ log -1 D 50'4 75'4 ,. per .ubol... 100'4 7 4 11 o p24 Ag positive 2 1 14 17 p24 Ag undetected 0'10 75'10 2 5 ' 1 o t L H I l I j 50'10 1 0 0 ' 1 0 , - = ) 250/ml _ ) 100/ml _ ) 101ml [IT] undetected I23IJ
Figure 5. HIV load in relation to p24 antigenemia (p24 Ag). Participantsare divided into those without and those with p24 Ag. Results of provirus and circulatingHIVRNA are expressed as in figure 2.
uals, and these are relatively independent of their CD4+ cell counts. All together, these data suggest that in peripheral blood the increase in percentage ofcells carrying the provirus is counterbalanced by a decrease in the concentration ofcells susceptible to HIV infection during the progression of HIV infection. In addition, in the present investigation, values determined in participants on zidovudine (most of them on long-term zidovudine, mean duration of 261 days) did not differ significantly from those not on zidovudine.
Circulating genomic RNA was detected in 70% of the par-ticipants. The proportion of subjects with detectable geno-mic RNA and the amount of genogeno-mic RNA increased with progression of HIV infection. These results are compatible with those of earlier investigations using a coculture
detec-HIV RNA in serum
100'4
75'10
50'10
25'10
0 ..
Undetected 1-cantl-Corec10 anti-Core )- 10
) 250/ml
-
6 2 1) 100/ml
-
3 1 1) 10/ml f:EIT] 9 6 10
undetected I23IJ 0 5 12
n-18 n-14 n-24
Figure 6. HIVload in relation to antibodies toHIVcore antigen (anti-core). Participants are divided into those without detectable anti-core antibodies (undetected) and those with low(index, 1-10) and high levels of anti-core antibodies (index, ;;;:'10). Results of provirus and circulatingHIVRNA are expressed as in figure 2.
lID 1992; 166 (August) HIV: Virologic and Immunologic Markers 275
0 ..+ - - - - ' - - - ' - - . - - - ' - - - ' - - - - 1
Log proviral DNA/108CD4
Acknowledgments
1. Schnittman SM, Psallidopoulos MC, Lane HC, et al. The reservoir for HIV-1 in human peripheral blood is a T cell that maintains expres-sion ofCD4. Science 1989;245:305-8.
2. Fayey JL, Taylor JMG, Detels R, et al. The prognostic value of cellular and serologic markers in infection with human immunodeficiency virus type 1. N Engl J Med 1990;322: 166-72.
3. Coombs RW, Collier AC, Allain JP, et al. Plasma viremia in human immunodeficiency virus infection. N Engl J Med 1989;321: 1626-31.
4. Ho DD, Moudgil T, Alam M. Quantitation of human immunodefi-ciency virus type I in the blood of infected persons. N Engl J Med 1989;321: 1621-5.
5. Jackson JB, Coombs RW, Sannerud K, Rhame FS, Balfour HH. Rapid and sensitive viral culture method for human immunodeficiency virus type I. J Clin Microbiol 1988;26: 1416-8.
6. Ehrnst A, Sonnerborg A, Bergdahl S, Strannegard O. Efficient isolation of HIV from plasma during different stages ofHIV infection. J Med ViroI1988;26:23-32.
7. Fischl MA, Richmann DO, Hansen N, et al. The safety and efficacy of zidovudine (AZT) in the treatment of subjects with mildly symptom-References
association is observed with anti-core antibodies. The detec-tion of genomic HIV RNA in participants with high levels of anti-core antibodies is not surprising, since immunocapture is designed to capture intact virus whose surface component is gp 160 and its process products. The absence ofassociation with ~2-microglobulin, whose increase has been shown to correlate with progression of AIDS [24, 25], may be due to a preferential link of~2-microglobulinincrease with cell acti-vation rather than with HIV multiplication itself. In this con-text,~2-microglobulinlevels may be more influenced by op-portunistic infections than by HIV load.
In conclusion, the present investigation demonstrated a closed association of virologic parameters with CD4+ con-centration, p24 antigen, and anti-core antibodies. It also shows that a high proportion of participants with CD4+ cell counts >200/JLL already have high levels of provirus and circulating genomic RNA; these individuals may benefit most from early antiviral therapy. Finally, the technique of semiquantitation of circulating genomic HIV RNA is spe-cific and relatively simple and should be of value in monitor-ing the effect of antiviral drugs.
We are indebted toT. M. Folks and the AIDS Research and Reference Reagent Program (Division of AIDS, National Insti-tute of Allergy and Infectious Diseases, Bethesda, MD) for pro-viding the LAV-8E5 cell line, to all of the physicians who re-ferred patients to our study, to Denis Hochstrasser (numeric imaginggroup, University Cantonal Hospital, Geneva) for assis-tance with the Phosphorlmager, to Alison Heald for reviewing the manuscript, to Victor Gabriel for assistance with the statisti-cal analysis, to Patrick Schreiber for technistatisti-cal help, and to Chris-tine Brown for preparation of the manuscript.
6 1 10 7 12 7 5 o B2-M )- 3 mg/l B2-M )- 3 mg/l 3
..
15 10HIVRNA in serum
6 11 10 5 B2-M(3 mgll B2-M (3 mg/l 25 .. 26.. log)-" _ log - 3 _ log·2 ~ log • 1 EI2SJ ) 250/ml _ ) 100/ml _ ) 10/ml II'IEJ undetected 0 .. per .ubel••• 100..
RNA (14 participants) and those with RNA [16].Itis tempt-ing to speculate that the patients with circulattempt-ing RNA are at higher risk for rapid progression of HIV infection and that they would benefit most from antiviral treatment. Verifica-tion of this hypothesis will require long prospective studies. Ours was a cross-sectional study with only 9 months of fol-low-up. During this period, 5 subjects with >250 circulating RNA molecules/ml, died, emphasizing the negative prog-nostic value of high levels of circulating genomic RNA.
A positive association between circulating genomic HIV RNA and p24 antigenemia was observed; this indirectly vali-dates the techniques used for RNA determination. All p24 antigen-positive but only 50% of p24 antigen-negative sub-jects were found to be RNA-positive. As expected, an inverse
60..
Figure 7. HIV load in relation to .B2-microglobulin. Participants are groupedaccording to level of .B2-microglobulin; limit of 3rng/L was arbitrarily selectedand corresponds to250%of mean value of healthy adults. Results of provirus and circulating HIV RNA are expressed as in figure 2.
276 Yerly et al. JID 1992: 166 (August)
atic human immunodeficiency virus type I (HIV) infection. Ann Intern Med 1990;112:727-37.
8. Volberding PA, Lagakos SW, Koch MA, et al. Zidovudine in asymp-tomatic human immunodeficiency virus infection. N Engl 1Med 1990;322:941-9.
9. lacobson MA, Abrams DI, Volberding PA,etal. Serum 132-microglobu-lin decreases in patients with AIDS or ARC treated with azidothymi-dine.1Infect Dis 1989; 159: 1029-36.
10. Centers for Disease Control. Revision of CDC surveillance case defini-tion for acquired immunodeficiency syndrome. MMWR 1987; 36(suppl S):3S-15.
II. Folks TM, Powel D,Lightfoote M,etal. Biological and biochemical characterization ofa cloned LEU-3-cell surviving infection with the acquired immune deficiency syndrome retrovirus. 1 Exp Med 1986; 164:280-90.
12. Yerly S,Charnot E, Deglon 11, Hirschel B, Perrin LH. Absence of chronic HIV infection without seroconversion in intravenous drug users. A prospective and retrospective study. 1 Infect Dis 1991;164:965-8.
13. Perrin LH, Yerly S, Adami N, et al. Human immunodeficiency virus DNA amplification and serology in blood donors. Blood 1990;76:641-5.
14. Weir D. Handbook ofexperimental immunology. VolI. Immunochem-istry. Cambridge, MA: Blackwell Scientific Publications, 1973:6.1-6.11.
15. Tschachler E, Groh V, Popovic M, et al. Epidermal Langerhans cells-a target for HTLV-III/LAV infection. 1 Invest Dermatol 1987;88:223-7.
16. Zang LQ, Simmonds P, Ludlam CA, Leigh Brown Al. Detection, quan-tification and sequencing of HIV-I from the plasma of seropositive individuals and from factor VIII concentrates. AIDS 1991 ;5:675-81.
17. Simmonds P, Peutherer lF, Ludlam CA, Bishop10. Leigh Brown Al. Human immunodeficiency virus-infected individuals contain pro-virus in small numbers of peripheral mononuclear cells and at low copy numbers.1Virol 1990;64:864-72.
18. Kellogg DE, Sninsky1,Kwok S. Quantitation of HI V-I proviral DNA relative to cellular DNA by the polymerase chain reaction. Anal Biochem 1990; 189:202-8.
19. Saag MS, Crain Ml, Decker WD, et al. High level viremia in adults and children infected with human immunodeficiency virus: relation to disease stage and CD4+ lymphocyte levels. 1 Infect Dis 1991;164:72-80.
20. Lee TH, Sunzerirr,Tobler LH, Williams BG, Busch MP. Quantitative assessment of HI V-I DNA load by coamplification of HI V-Igagand HLA-DQ-a genes. AIDS 1991;5:683-91.
21. Schnittman SM, Greenhouse 11, Psallidopoulos MCetal. Increasing viral burden in CD4+ cells from patients with human immunodefi-ciency virus (HIV) infection reflects rapidly progressive immunosup-pression and clinical disease. Ann Intern Med 1990: 113:438-43. 22. Holodniy M, Katzenstein DA. Sengupta S, et al. Detection and
quanti-fication of human immunodeficiency virus RNA in patient serum by use of the polymerase chain reaction.1Infect Dis 1991;163:862-6. 23. Semple M. Loveday C Weller I, Tedder R. Direct measurement of viraemia in patients infected with HIV- I and its relationship to dis-ease progression and zidovudine therapy.1Med ViroI1991;35:38-45.
24. Laceyc lN, Forbes MA, Waugh MA, Cooper EH, Hambling MH. Serum 132-microglobulin and human immunodeficiency virus infec-tion. AIDS 1987; I: 123-7.
25. Moss AR, Bacchetti P, Osmond D, et al. Seropositivity for HIV and the development of AIDS or AIDS related condition: three years follow-up of the San Francisco General Hospital cohort. BMl 1988;296:745-50.