Time-Resolved X-Ray Microtomography Observation
of Intermetallic Formation Between Solid Fe and Liquid Al
GUILLAUME PASCHE, MARIO SCHEEL, ROBIN SCHA¨UBLIN, CE´CILE HE´BERT, MICHEL RAPPAZ, and AI¨CHA HESSLER-WYSER
Time-resolved in situ X-ray tomography combined with scanning electron microscopy was performed on an Al-Fe diffusion system at 973 K (700°C) to study the formation of the main intermetallic compounds occurring at the interface. After nucleation on the liquid side of the interface, growth occurs in both liquid and solid directions. In the direction of the solid, growth starts with a particular tongue-like feature which then progressively thickens. The thickening is linked to the deformation of the iron matrix during the formation of the intermetallic com-pound. Growth in the direction of the liquid is slowed down by erosion.
DOI: 10.1007/s11661-013-1788-6
Ó The Minerals, Metals & Materials Society and ASM International 2013
I. INTRODUCTION
T
HEinteraction between liquid aluminum and solid iron has been the subject of many researchers, and a wealth of information concerning intermetallic forma-tion can be found in the literature.[1,2] It has been observed that two main intermetallic phases are formed, namely, a thin layer of Fe4Al13 on the aluminum side and a much thicker layer of Fe2Al5 on the iron side, exhibiting a specific tongue-like structure[3,4] growing toward the iron matrix.[5] Kwon and Lee[6] proposed that the tongue-like morphology is related to the iron grain size, while other studies stated that this morphol-ogy is mainly due to the anisotropy of the crystallites that grow preferentially along their c-axis, independent of the iron matrix.[1,3,7]Additional studies showed that temperature[8]or alloying elemental addition[9]modifies the shape of the tongues. However, these measurements are based on post mortem observations that cannot report on the shape evolution during reaction. Cur-rently, in situ X-ray tomography observation of metals, whether in solid or liquid state, is a useful tool giving precious information on phase transformation[10,11] in, e.g., binary liquid–solid systems such as Al-Ga[12,13] or Al-Cu[14] The current study proposes, through in situ X-ray microtomography, to follow the time evolution of the intermetallic layer with a resolution of 2 minutes of an Al-Fe system, at a temperature of 973 K (700°C),for a material volume of about 1.5 mm3 and with a cubic voxel of 1.2 lm in size. With this in situ observa-tion method, the intermetallic formaobserva-tion can be identi-fied and followed over time, giving complementary information on the mechanisms involved in the tongue-like morphology and particularly on the thickening of the tongues.
II. EXPERIMENTS
X-ray absorption microtomography was performed on the ID15A beam line of ESRF, Grenoble, France using a monochromatic beam. The fast micro-tomogra-phy series were collected using a high-resolution tomog-raphy setup of ESRF.[15] The detector consists of a 25-lm-thick LuAG:Ce scintillator screen that converts the X-ray photons into visible light photons. This image is magnified by a 109 mirror optics and is collected by a high-speed CCD camera, the DALSTAR Pantera 1M60. The high flux of the ID15 high-energy undulator source allows performing a 3D tomographic scan in less than 20 seconds. In order to get a better contrast, with the strong absorbance of Fe, a monochromatic beam at 52 keV was chosen, which imposes a slower scan, lasting between 40 seconds and 1 minute, which is short enough to render sample drift negligible.
The samples were made of Fe 99.8 wt pct provided by Armco and Al 99.999 wt pct by Pechiney. A cylinder 3 mm in height and 2 mm in diameter made of Al was put on top of a Fe cylinder having the same dimensions as shown on Figure1. An inorganic glue (Aron Ceramic D produced by Toagosei CO., LTD, Tokyo, Japan) was applied all around the interface to maintain the cylinders in close contact during the experiment.
In situ measurements were carried out in a resistive furnace mounted in the ID15 line. The sample was heated to 973 K (700 °C) with a
tem-perature ramp of 1 K s 1 under a He flux of
0.4 L min 1 to avoid oxidation of the iron part of GUILLAUME PASCHE, PhD Student, CE´CILE HE´BERT,
Professor, Director, and AI¨CHA HESSLER-WYSER, MER, are with the Centre Interdisciplinaire de Microscopie E´lectronique, E´cole Polytechnique Fe´de´rale de Lausanne, 1015 Lausanne, Switzerland. Contact e-mail: guillaume.pasche@epfl.ch MARIO SCHEEL, Post-doc, is with the European Synchrotron Radiation Facility (ESRF), 6 rue Jules Horowitz, 38043 Grenoble, France. ROBIN SCHA¨UBLIN, MER, is with the Centre de Recherche en Physique des Plasmas, E´cole Polytechnique Fe´de´rale de Lausanne. MICHEL RAPPAZ, Professor, Director, is with the Laboratoire de Simulation des Mate´riaux, E´cole Polytechnique Fe´de´rale de Lausanne.
Manuscript submitted December 21, 2012. Article published online May 23, 2013
the sample. The native oxide layer initially sur-rounding the Al cylinder was resistant enough to contain the molten aluminum.
The reference time is given by the first tomogram recorded once the temperature of 973 K (700°C) is reached. Although the reaction has already started before heating, the difference between the start of the experiment and the reference time does not exceed a few minutes, which is small compared with the overall reaction time. One complete tomogram can last between 40 seconds and 2.5 minutes, depending mainly on the number of projections acquired during the rotation of the sample, the exposure time of each projection, and the acquisition frequency of flat images, needed for background subtraction. In the current case, each tomogram consisted of 1800 projections, one every 0.1 deg—with an exposure time of 50 ms per projec-tion—corrected by a flat image acquired after the tomogram, leading to a time resolution of 2 min. From the set of projections, a 3D image was calculated by a standard filtered back-projection algorithm.
A sketch of the reconstructed volume inside the initial sample is shown in Figure 1 as the dashed cylinder. It corresponds to a stack of horizontal images forming a total cylinder 1.2 mm in diameter and 1.2 mm in height. Reconstructed files were treated using the Fiji ImageJ open source software[16] to extract 2D vertical stacks images of the Fe-Al interface and to obtain 3D views. Visualization of volumes was made using AvizoÒfire 6.0 (VSG). Finally, to study the evolution of the interface with time, one vertical slice was extracted from the stack.
Parallel to these in situ observations, dipping tests of iron fingers 50 mm long and 10 mm in diameter into an aluminum bath were performed at 973 K (700°C) for immersion times varying between 15 and 90 minutes. Tests were made under Ar-controlled atmosphere to avoid oxidation. The samples were then investigated by scanning electron microscopy (SEM) in cross section.
III. RESULTS
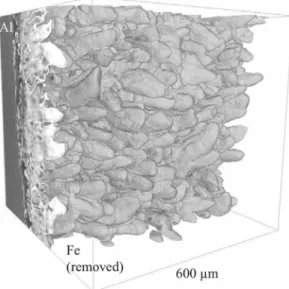
Figure2 presents a 3D view of the interface between the intermetallic compounds and iron after 1 hour of contact at 973 K (700°C). The image is oriented with the aluminum bath on the back side, the iron phase having been made transparent. It clearly reveals the tongue-like structure of the Fe2Al5phase that is growing into the iron matrix.
Figure3presents the time evolution of a cross section with the liquid Al on the upper part (dark gray in reverse contrast image), the solid Fe on the lower part (white), and the intermetallic phases in between (light gray). To insure that the position of the observed cross section is always the same, a defect in the iron phase is used as a fiducial mark and followed along the experiment. This defect is marked by a black circle in the first image of Figure3.
A. Nucleation and Beginning of Reaction
The intermetallic growth starts after about 15 minutes at 973 K (700°C) with the formation of intermetallic blocks on the liquid side of the interface (Figure3, image 2). From these blocks, tongues emerge and grow into the iron phase, first in the right side of the frame and then gradually over the whole cross section. This nonuniformity of the reaction is due to the oxide layer on the aluminum melt, which represents a diffusion barrier and, thus an obstacle to the liquid feeding. While the oxide skin is too thin to be observed, the gap between this oxide and the iron or intermetallic appears black in Figure3 (image 4, arrow a). The reaction can proceed further only if the liquid can flow under the oxide skin through a crack. These cracks may be induced by strains on the interface, as a result of thermal or phase’s expansion. Note that this feeding may originate from other locations not visible in this sample ø 2 mm acquisition volume ø=1.2 mm, h=1.2 mm hAl 3 mm hFe 3 mm Al (l) Fe (s)
Fig. 1—Schematic representation of the sample with the lower solid iron cylinder and the upper liquid aluminum cylinder, both of initial height h = 3 mm and diameter 2 mm; the observation volume (dashed lines, cylinder 1.2 mm in diameter and 1.2 mm in height); the volume of interest (cube); and one schematic cross section in the
cube. Fig. 2—3D segmented image of the interface between intermetallicsand iron after 60 min of contact. The iron phase has been made
transparent, revealing the Fe2Al5 intermetallic tongues. The cubic
cross section. One can observe, especially in image 4 , a portion of liquid that has flown under the oxide skin (dark gray zone below arrow a). As this region was likely more fed at the beginning of the test, the reaction started first here. The presence of the oxide skin explains then the latency period observed at the beginning of the experiment.
B. Matrix Deformation
It appears that the initial Fe-Al interface exhibits an upward movement toward the liquid Al, relative to the black line in Figure3 representing the position of the initial interface. This movement cannot be associated with any sample displacement as the defect used as reference did not show any significant displacement. This movement is associated with the growth of the intermetallics and especially of the Fe2Al5phase in the solid. After the nucleation, the intermetallic compound grows as tongues within the iron phase as can be seen from the decreasing distance between the tongue front and the defect. Associated with the growth of Fe2Al5 into the solid iron, a strong deformation of the latter is observed, also visible in Figure 4. This figure shows a SEM picture of a specimen dipped during 30 minutes at 973 K (700°C) and then longitudinally cut to reveal the cross section, which has been chemically etched. It reveals that the grain structure is much thinner close to and in between the tongues. Finally, one can observe that parts of the iron have been isolated from the main matrix and seem to be trapped in the intermetallic layer (Figure3, image 5, arrows b). Although it is for the moment not known if those iron islands are really
isolated or linked to the matrix in the third dimension, their position above the original interface (black line) confirms the strong deformation suffered by the matrix. C. Tongues to Planar Growth Transition
As shown in Figure3, the tongues grow rapidly during the first hour of contact (images 1 to 4). Then, during the next 6 hours, growth is much slower in the vertical direction, while thickening of the intermetallics occurs (images 4 through 6). After 1 hour, the most developed tongues slow down their growth in the iron
Fig. 3—Time evolution of the cross section as observed in in situ X-ray tomography at 973 K (700°C). A defect (circled in black in image 1) is
used as fiducial mark. Liquid Al (dark gray) is on top, intermetallic phases (light gray) in the middle, and solid iron (white) at the bottom. The time (hour:min) is given in each picture. An oxide skin (darker gray, arrow a) on the liquid Al is visible with some liquid flowing underneath. The black line indicates the original position of the Al-Fe interface. The arrow c points at liquid interface where intermetallic blocks are detach-ing from the formed layer. The arrow b shows isolated pockets of Fe, and arrow d points a porosity.
Fig. 4—SEM observation of a chemically etched cross section of Fe
dipped in Al for 30 min at 973 K (700°C) showing the much
matrix in favor of thickening of their trunks. They are then caught by initially slower tongues. As a result, the iron-intermetallic interface becomes flatter. The vertical position of the lowest tongue tip has been recorded after 60 minutes (image 4) and after 7 hours (image 6), taking as reference the initial liquid–solid interface. From this, an approximate tongue tip speed of 150 lm h 1 is obtained during the first hour and of 14 lm h 1during the next 6 hours. This observation may be understood as a change in diffusion regime during the growth of the tongues. At the very beginning of the reaction, the diffusive regime favors tongues to grow rapidly in the iron matrix as do Widmanstaetten plates.[17]As an array of fast-growing tongues develops, the structure of the surrounding iron matrix deforms, resulting in a higher density of grain boundaries and dislocations (Figure 4). As experiments are done at low temperature with respect to the melting point of iron (Tm= 1811 K (1538°C), grain boundary diffusion certainly plays an important role in intermetallic growth.[17] These defects then modify the diffusion regime, favoring diffusion trans-versally to the tongues and thus the growth of the intermetallics in between them.
D. Liquid Interface
On the liquid–intermetallics interface, one can observe that blocks detach from the formed interme-tallic layer (Figure3, image 6, arrow c). It has already been revealed on post mortem observation that a thin Fe4Al13layer is formed at this interface.
[1]
Although the contrast with the current setup is not sufficient to distinguish Fe2Al5 from Fe4Al13 phases, those blocks have been identified through post mortem energy-dispersive X-ray spectroscopy (EDS) measurements as Fe4Al13, thus stemming from the thin Fe4Al13 layer. The detachment is coming from the dissolution of iron in the aluminum bath which was not saturated before the experiment, thus implying an erosion of the layer. This mechanism can explain the relatively slow growth rate of the Fe4Al13 measured by Bouche´ et al.[1] in comparison with the growth rate of the Fe2Al5 com-pound in the matrix.
E. Porosity
One can also observe the presence of voids in the intermetallic compound (black areas in the tongues on Figure3 image 6 arrows d) that progressively appears during the experiment. While this subject needs a deeper study, it is suggested that porosity formation is related to strain field caused by the tongue growth.
IV. CONCLUSIONS
In situtime-resolved X-ray microtomography combined with SEM techniques allows observing growth of the specific tongue-like Fe2Al5 intermetallic compounds and gives information on its basic mechanisms as summarized in Figure5. Nucleation starts on the liquid side of the interface by the apparition of blocks, from which tongues rapidly grow into the iron matrix (Figure5(a)). This growth implies an important deformation of the iron matrix that is demonstrated here by three observations: the upward movement of the liquid–solid interface, the grain refinement around the tongues, and the trapping of iron regions above the initial Fe-Al interface (Figures5(b) to (d)). It is demonstrated that the grain boundary density increases close to and in between the tongues. Besides, as the temperature is low in comparison with iron melting point (0.53 Tm), grain boundary diffusion is favored over bulk diffusion.[17]The increase of grain boundary density offers then more diffusion paths in between the tongues that progressively thicken, leading to a more regular interme-tallics–iron interface. Then, the thickening of the tongues is due to the grain refinement around the tongues.
ACKNOWLEDGMENTS
The authors are immensely grateful to the Commission for Technology and Innovation of the Swiss Confedera-tion, Allper AG in Du¨dingen, Switzerland, Atela SA in Neuchaˆtel, Switzerland, for their financial support; the European Synchrotron Radiation Facility, Grenoble, France for giving access to the ID15 beamline; and
(a) (b) (c) (d)
Fig. 5—Drawing of the different intermetallic growth steps, starting with (a) nucleation on the liquid side of the interface and rapid growth of the tongues, followed by (b, c) a progressive thickening of the tongues due to the matrix deformation offering more diffusion paths and leading to (d) a more regular intermetallics–iron interface. At the interface with the liquid, intermetallic progression is slowed down by iron dissolution observable through intermetallic blocks detaching (c). Important upward movement of the iron matrix highlights its deformation, which can lead to the appearance of isolated iron regions located above the initial Al-Fe interface position (d).
Guillaume Lucas and Pierre Burdet, CIME, EPFL, Lau-sanne, Switzerland for their help in data processing.
REFERENCES
1. K. Bouche´, F. Barbier, and A. Coulet: Mater. Sci. Eng. A, 1998, vol. 249, pp. 167–75.
2. A. Bouayad, Ch. Gerometta, A. Belkebir, and A. Ambari: Mater. Sci. Eng. A, 2003, vol. 363, pp. 53–61.
3. G. Eggeler, W. Auer, and H. Kaesche: J. Mater. Sci., 1986, vol. 21, pp. 3348–50.
4. G. Eggeler, Th. Theuerkauf, and W. Auer: Z. Werkstofftech., 1985, vol. 16, pp. 359–65.
5. W.-J. Cheng and C.-J. Wang: Surf. Coat. Technol., 2009, vol. 204, pp. 824–28.
6. S.C. Kwon and J.Y. Lee: Can. Metall. Q., 1981, vol. 20, pp. 351–57. 7. V.N. Yeremenko, Ya.V. Natanzon, and V.I. Dybkov: J. Mater.
Sci., 1981, vol. 16, pp. 1748–56.
8. Y. Tanaka and M. Kajihara: Mater. Trans., 2009, vol. 50, pp. 2212–20.
9. W. Kajoch and A. Fajkiel: International Die Casting Congress and Exposition, Detroit, 16th trans. T91-034, 1991, pp. 67–74. 10. A.B. Phillion: JOM, 2012, vol. 64, pp. 66–67.
11. K. Grujic, T. Hegna, and K.M. Laundal: JOM, 2012, vol. 64, pp. 96–101.
12. E. Pereiro-Lopez, W. Ludwig, D. Bellet, and J. Baruchel: Def. Diff.
Forum, 2003, vol. 216(217), pp. 241–48.
13. W. Ludwig, E. Pereiro-Lopez, and D. Bellet: Acta Mater., 2005,
vol. 53(1), pp. 151–62.
14. O. Ludwig, M. Dimichiel, L. Salvo, M. Sue´ry, and P. Falus: Metall. Mater. Trans. A, 2005, vol. 36A, pp. 1515–23.
15. M. Di Michiel, J.M. Merino, D. Fernandez-Carreiras, T. Buslaps, V. Honkima¨ki, P. Falus, T. Martins, and O. Svensson: Sci. Instrum., 2005, vol. 76, p. 043702.
16. M.D. Abramoff, P.J. Magalhaes, and S.J. Ram: Biophoton. Int., 2004, vol. 11, pp. 36–41.
17. D.A. Porter and K.E. Easterling: Phase Transformations in Metals and Alloys, 2nd ed., CRC Press, Boca Raton, FL, 1992.