RESEARCH ARTICLE
Seasonal Variation in the Deficiency of 25-Hydroxyvitamin
D
3
in Mildly to Extremely Obese Subjects.
Barbara Ernst&Martin Thurnheer&
Sebastian M. Schmid&Britta Wilms&Bernd Schultes
Received: 17 June 2008 / Accepted: 1 July 2008 / Published online: 29 July 2008
# Springer Science + Business Media, LLC 2008 Abstract
Background Vitamin D deficiency is a common finding in obese subjects even before any bariatric operation. How-ever, most previous studies reporting on high rates of vitamin D deficiency in obese subjects have not systemat-ically controlled for seasonal variations. Furthermore, the existence of seasonal variation in serum 25-hydroxyvitamin D3levels has not been well documented in obese subjects
so far.
Methods Serum 25-hydroxyvitamin D3 levels were
mea-sured in 248 obese subjects (body mass index: range, 30.1– 68.9 kg/m2). Fat mass was determined using standard bioelectrical impedance analysis.
Results Serum 25-hydroxyvitamin D3levels decreased with
the increasing body mass index and fat mass (both P< 0.001) and showed a marked variation across the seasons of the year (P<0.001), which was not affected by the degree of obesity. According to the variation in absolute levels, the prevalence of vitamin D deficiency (<50 nmol/l) was 3.8-fold higher during winter than during summer (91.2% vs. 24.3%; P<0.001).
Conclusion Data show a marked seasonal variation in absolute serum 25-hydroxyvitamin D3 concentrations and
prevalence of vitamin D deficiency in subjects with mild to extreme obesity. Considering the increasing number of studies reporting on vitamin D deficiency in obesity, the
present finding points to season as a crucial factor that should not be neglected when assessing serum levels of this vitamin in obese subjects.
Keywords Vitamin D . Seasonal variation . Obesity
Introduction
Vitamin D deficiency is increasingly recognized as an important risk factor for many diseases such as diabetes, hypertension, cardiovascular diseases, and several types of cancer [1]. A large number of studies have reported on distinctly reduced circulating 25-hydroxyvitamin D3levels
in obese subjects which may contribute to the health-impairing effects of obesity [2–12]. Low 25-hydroxyvitamin D3 concentrations in obesity have been attributed to an
increased storage of this lipid-soluble vitamin in adipose tissue [13,14] and an overall reduced exposure of the skin to sunlight due to limited mobility and potentially embarrass-ment [6]. While the capacity of the skin to produce vitamin D during sunlight exposure appears to be unaffected, the increase in serum 25-hydroxyvitamin D3 levels after a
standardized UV-B radiation is reduced by 52% in obese as compared to lean subjects [13]. This finding again points to an enhanced storage of the vitamin in subcutaneous fat in obese subjects.
Considering the prominent role of sunlight in the skin’s generation of vitamin D, it is not surprising that serum 25-hydroxyvitamin D3levels have consistently been found to
show a marked seasonal variation [14–17]. Importantly, most previous studies reporting on high rates of vitamin D deficiency in obese subjects [5–8, 18] have not systemat-ically controlled for such seasonal variations. Furthermore, the existence of seasonal variation in serum 25-hydroxyvi-OBES SURG (2009) 19:180–183
DOI 10.1007/s11695-008-9636-2
B. Ernst
:
M. Thurnheer:
B. Schultes (*)Interdisciplinary Obesity Center, Kantonsspital St. Gallen, Heidener Strasse 11,
CH-9400 Rorschach, Switzerland e-mail: [email protected] S. M. Schmid
:
B. Wilms:
B. SchultesDepartment of Internal Medicine I, University of Luebeck, 23538 Luebeck, Germany
tamin D3 levels has not been well documented in obese
subjects so far [8]. A previous study revealed a weaker seasonal variation in overweight [body mass index (BMI)> 25 kg/m2] as compared to lean (BMI<25 kg/m2) subjects [19]. Also, two previous studies investigating serum 25-hydroxyvitamin D3levels in extremely obese subjects (BMI
>40 kg/m2) did not find any differences in levels obtained during the winter as compared to the summer season [12,
20]. However, results of these studies should be interpreted with caution since in both studies, a rather low number of subjects was tested (n=73 and n=41, respectively).
In this study, we assessed serum 25-hydroxyvitamin D3
levels in a sample of 248 subjects with a wide range of obesity. Based on the proposed mechanisms of vitamin D deficiency in obesity, i.e., an increased storage in adipose tissue and a rare exposure to sunlight, we hypothesized that the seasonal variation in 25-hydroxyvitamin D3 levels
diminishes with increasing degrees of obesity.
Methods
Serum 25-hydroxyvitamin D3levels were measured in 248
(176 women/72 men) obese subjects (BMI>30 kg/m2) who attended our Interdisciplinary Obesity Center between
November 2005 and January 2008. Patients who were taking vitamin D supplements or had undergone a bariatric operation prior to the present assessment were excluded from the study. Also, patients with overt renal function impairment (serum creatinine concentration>120μmol/l for men, >100 μmol/l for women) were excluded from the study. Written informed consent was obtained from all patients.
Height and weight were measured with patients wearing light clothing and no shoes. BMI was defined as weight (kg) divided by height squared (m2). Fat mass (FM) was determined using standard bioelectrical impedance analysis (BIA 101, AKERN Bioresearch, Florence, Italy). Blood samples were drawn in the morning (0800–1100 hours) after an overnight fast, and serum 25-hydroxyvitamin D3
levels were determined by high-performance liquid chro-matography (Chromsystems, Instruments & Chemicals GmbH, Munich, Germany). A serum 25-hydroxyvitamin D3level <75 nmol/l was defined as vitamin D insufficiency,
a serum level <50 nmol/l as deficiency, and a serum level <25 nmol/l as severe deficiency [1].
Data were analyzed by using SPSS 12.1 for Windows (SPSS Inc., Chicago, IL, USA). Unless otherwise indicated, data are reported as mean ±SD. To analyze serum 25-hydroxyvitamin D3levels according to different degrees of
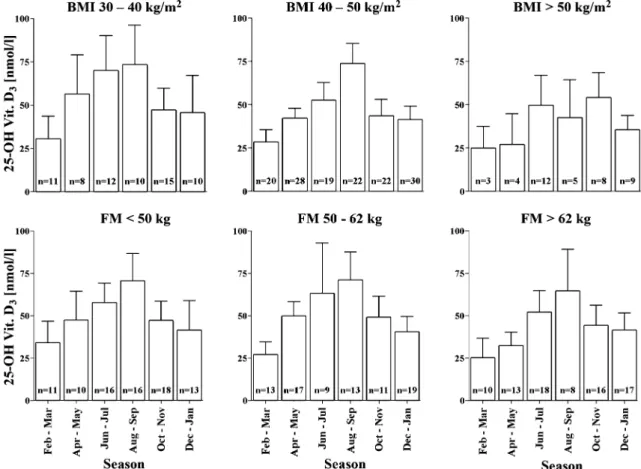
Fig. 1 Seasonal variation in serum 25-hydroxyvitamin D3within three different BMI groups and tertiles of fat mass (FM)
obesity, the study population was divided into three BMI groups: 30–40 kg/m2, 40–50 kg/m2
, and >50 kg/m2. Also, the study population was divided into tertiles according to their FM: tertile 1—FM ≤50 kg, tertile 2—FM 50–62 kg, tertile 3—FM >62 kg. For analysis of seasonal variations, we subdivided the year into six 2-month periods: February– March, April–May, June–July, August–September, October– November, December–January. These periods roughly approximate the seasonal changes in availability of sunlight in Switzerland (latitude of 47°,27′,0″ N; Federal Office of Meteorology and Climatology MeteoSwiss). Variables were compared between different seasons by analysis of variance (ANOVA) for continuous variables andχ2 test for discrete variables. To adjust for potential confounders, e.g., sex, age, and indices of adiposity (BMI, FM), these variables were included as covariates in respective analysis of covariance models. Pearson’s correlation coefficient and partial correla-tion analysis were used to assess relacorrela-tionships between variables. A P value <0.05 was considered significant.
Results
The study population was characterized by a mean age of 41± 12 years (range, 17–72 years) and a mean BMI of 44.1± 6.7 kg/m2(range, 30.1–68.9 kg/m2). In agreement with the wide BMI range, subjects also showed a wide range of FM (22.8–102.0 kg; mean±SD, 57±15 kg). BMI values as well as FM values were equally distributed across the six different 2-month intervals (P=0.284 and P=0.208, respectively).
Serum concentration of 25-hydroxyvitamin D3 ranged
from 5 to 142 nmol/l (mean±SD, 48±25 nmol/l). BMI was inversely correlated with serum 25-hydroxyvitamin D3
concentrations (r=−0.151; P=0.017), and this correlation remained significant after adjusting for age and sex (r= −0.148; P=0.020). Also, FM showed an inverse correlation with serum 25-hydroxyvitamin D3 levels (r=−0.150; P=
0.018), and again, this correlation remained significant after adjusting for age and sex (r=−0.158; P=0.013).
Overall, serum 25-hydroxyvitamin D3 levels showed a
marked variation across the seasons of the year (P<0.001), with highest levels during summer (August–September, 69.5±28.3 nmol/l) and lowest levels during winter period (February–March, 28.9±15.7 nmol/l). Adjustment for sex, age, and indices of adiposity did not affect the significance of seasonal variation (all P<0.001). Also, none of these variables showed a significant interaction with the effects of the season on serum 25-hydroxyvitamin D3levels (all P>
0.15). Regardless of the seasonal variation, ANOVA indicated a significant decrease in levels with increasing BMI and FM (both P<0.001).
Separate analyses of different BMI groups and FM tertiles revealed similar results with a significant variation
across seasons in all groups (all P<0.004) except for the highest BMI group (>50 kg/m2) in which, most likely due to small sample size (n=41), the effect of season did not reach significance (P=0.078; Fig.1).
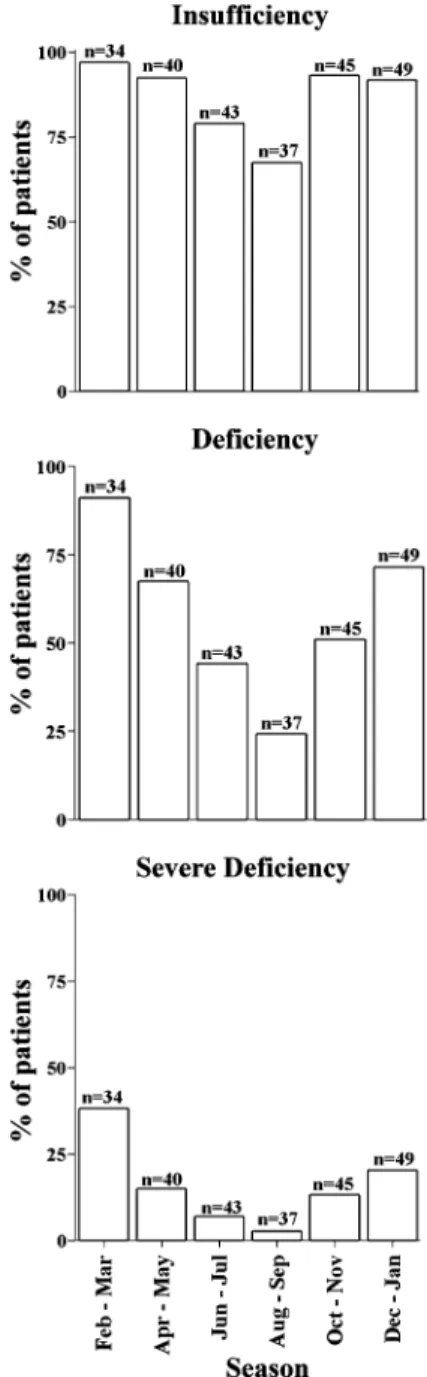
According to the seasonal variation in absolute levels, there was also a clear-cut variation in the prevalence of vitamin D insufficiency, deficiency and, severe deficiency (all P<0.001; Fig.2). For instance, the deficiency rate was 3.8-fold higher in February–March than in August–September (91.2% vs. 24.3%; P<0.001).
Fig. 2 Seasonal variation in the prevalence of serum 25-hydroxyvitamin D3 insufficiency (<75 nmol/l), deficiency (<50 nmol/l), and severe
deficiency (<25 nmol/l)
Discussion
Present data for the first time show a marked seasonal variation in serum 25-hydroxyvitamin D3levels in subjects
with a wide range of obesity, a finding that has previously been well documented in study populations with a much lower averaged BMI [14–17]. Although serum 25-hydroxyvitamin D3levels clearly decreased with increasing
BMI and FM, these variables did not affect the seasonal variation in circulating levels of the vitamin. Thus, our data do not support the hypothesis that the putatively reduced exposure to sunlight or the increased storage capacity in adipose tissue diminishes the seasonal variation in vitamin D levels in obese subjects.
The present finding of a marked seasonal variation of serum 25-hydroxyvitamin D3levels and deficiency in obese
subjects sheds new light on the previously reported high rates of vitamin D deficiency in obesity [5–8, 18]. While most of the previous studies have not controlled for the season of the year at which the vitamin D levels were measured, our data point to a 3.8-fold higher vitamin D deficiency rate in the winter than summer period. Thus, the impact of season on circulating vitamin D concentrations should be considered when reporting on prevalence rates of vitamin D deficiency in obese subjects regardless of being in a pre- or postoperative bariatric state. Finally, present results may also yield clinical implications by showing an extremely high rate of vitamin D deficiency in obese subjects during the winter season (91.2% in February– March). It remains to be established whether obese subjects benefit from vitamin D supplementation especially during this time of the year.
Acknowledgment The authors have no commercial interest to disclose. The study was financially supported by a grant from Johnson & Johnson. The funder had no role in the study design, analysis, and publication of the data.
References
1. Holick MF. Vitamin D deficiency. N Engl J Med 2007;357: 266–81.
2. Bell NH, Epstein S, Greene A, et al. Evidence for alteration of the vitamin D-endocrine system in obese subjects. J Clin Invest 1985;76:370–3.
3. Liel Y, Ulmer E, Shary J, et al. Low circulating vitamin D in obesity. Calcif Tissue Int 1988;43:199–201.
4. Looker AC. Body fat and vitamin D status in black versus white women. J Clin Endocrinol Metab 2005;90:635–40.
5. Vilarrasa N, Maravall J, Estepa A, et al. Low 25-hydroxyvitamin D concentrations in obese women: their clinical significance and relationship with anthropometric and body composition variables. J Endocrinol Invest 2007;30:653–8.
6. Compston JE, Vedi S, Ledger JE, et al. Vitamin D status and bone histomorphometry in gross obesity. Am J Clin Nutr 1981;34: 2359–63.
7. Buffington C, Walker B, Cowan GS, et al. Vitamin D deficiency in the morbidly obese. Obes Surg 1993;3:421–4.
8. Yanoff LB, Parikh SJ, Spitalnik A, et al. The prevalence of hypovitaminosis D and secondary hyperparathyroidism in obese black Americans. Clin Endocrinol (Oxf) 2006;64:523–9. 9. Rueda S, Fernandez-Fernandez C, Romero F, et al. Vitamin D,
PTH, and the metabolic syndrome in severely obese subjects. Obes Surg 2008;18:151–4.
10. Hamoui N, Anthone G, Crookes PF. Calcium metabolism in the morbidly obese. Obes Surg 2004;14:9–12.
11. Compher CW, Badellino KO, Bollata JI. Vitamin D and the bariatric surgical patient: a review. Obes Surg 2008;18:220–4. 12. Goldner WS, Stoner JA, Thompson J, et al. Prevalence of vitamin
D insufficiency and deficiency in morbidly obese patients: a comparison with non-obese controls. Obes Surg 2008;18:145–50. 13. Wortsman J, Matsuoka LY, Chen, et al. Decreased bioavailability
of vitamin D in obesity. Am J Clin Nutr 2000;72:690–3. 14. Arunabh S, Pollack S, Yeh J, et al. Body fat content and
25-hydroxyvitamin D levels in healthy women. J Clin Endocrinol Metab 2003;88:157–61.
15. Hypponen E, Power C. Hypovitaminosis D in British adults at age 45 y: nationwide cohort study of dietary and lifestyle predictors. Am J Clin Nutr 2007;85:860–8.
16. Steingrimsdottir L, Gunnarsson O, Indridason OS, et al. Relation-ship between serum parathyroid hormone levels, vitamin D sufficiency, and calcium intake. JAMA 2005;294:2336–41. 17. Bolland MJ, Grey AB, Ames RW, et al. The effects of seasonal
variation of 25-hydroxyvitamin D and fat mass on a diagnosis of vitamin D sufficiency. Am J Clin Nutr 2007;86:959–64. 18. Snijder MB, van Dam RM, Visser M, et al. Adiposity in relation
to vitamin D status and parathyroid hormone levels: a population-based study in older men and women. J Clin Endocrinol Metab 2005;90:4119–23.
19. Need AG, Morris HA, Horowitz M, et al. Effects of skin thickness, age, body fat, and sunlight on serum 25-hydroxyvitamin D. Am J Clin Nutr 1993;58:882–5.
20. Botella-Carretero JI, varez-Blasco F, Villafruela JJ, et al. Vitamin D deficiency is associated with the metabolic syndrome in morbid obesity. Clin Nutr 2007;26:573–80.