Synthèse
Direction de
l’animation
de larecherche,
desétudes
et desstatistiques
Numéro 09 • Décembre 2014
French National Reform Program
Statistical annex on employment
The Europe 2020 strategy aims to make the EU a smart, sustainable and inclusive economy with high levels of employment, productivity and social cohesion. It is based on a limited number of guidelines, adopted by the Council of the European Union in October 2010, dealing in a comprehensive way the issues of employment and economic policy. These integrated guidelines complement the five major targets such as the one consisting in raising the employment rate of women and men aged 20 to 64 to 75% by 2020, notably through a greater involvement of young people, older workers and the low-skilled and a better integration of migrants.
In order to facilitate the use of these statistics by all Member States within the context of multilateral surveillance, the nomenclature and format used for these indicators is based on the Joint Assessment Framework developed by the Employment Committee at European level to follow guidelines 7-9.
The selection of indicators presented in this annex is based on those selected by the “indicators group” of the Employment Committee, supplemented by the relevant national indicators that help monitor the implementation of French priorities.
Guideline no.7: Increasing labour-market participation of men and women, reducing structural unemployment and improving the quality of work
Guideline no.8: Developing a skilled workforce responding to labour market needs, and promoting lifelong education and training.
Guideline no.9: Improving the quality of educational and training systems and improving their performance at all levels, and increasing participation in higher education or equivalent
Note: The data contained in this document are exclusively taken from national statistical sources. Consequently, they can sometimes diverge from harmonized data published by Eurostat.
INCREASE LABOUR MARKET PARTICIPATION... 4
- Employment rate in 2013... 4
- Unemployment rate ... 4
- Unemployment rates by qualification and length of time since leaving initial education ... 5
- Youth unemployment ratio in 2013... 5
- Participation rate ... 6
- Employment and unemployment rates for European Union nationals and nationals of non-EU countries in 2012... 6
- Underemployment rate ... 7
- Average exit age from the labour market ... 7
- Employment rate and core employment rate for 55-64 year-old... 7
ENHANCING LABOUR MARKET FUNCTIONING AND COMBATING SEGMENTATION ... 9
- Annual transitions between the various situations on the job market ... 9
- Part-time, special forms of salaried employment, and share of self-employed in total employment in 2013 ... 10 - Dispersion of regional employment and unemployment rates ... 11
- Occupational accidents and occupational diseases ... 13
ACTIVE LABOUR MARKET POLICIES... 15
- Long-term unemployment rate ... 15
- Activation rate of Long Term registered Unemployed ... 15
- Prevention and participation in active measures by the long-term unemployed... 16
- Active Labour Market Policy expenditure (categories 2 to 7) as a percentage of GDP ... 17
- Active Labour Market Policy expenditure (categories 2 to 7) per person wanting to work ... 17
- Labour Market Policy participants (categories 2 to 7) per 100 persons wanting to work ... 18
ADEQUACY OF THE SOCIAL PROTECTION SYSTEM AND MAKE WORK PAY 1. ADEQUACY OF THE SOCIAL PROTECTION SYSTEM ... 19
- People at risk of poverty according to a threshold at 60% of the median income by most frequent activity status (ILO definitions)... 19
- Out-of-work income maintenance expenditure (category 8) as a percentage of GDP ... 19
- Out-of-work income maintenance expenditure (category 8) per person wanting to work ... 19
ADEQUACY OF THE SOCIAL PROTECTION SYSTEM AND MAKE WORK PAY : 2. MAKE WORK PAY ... 20
- Number of tax households concerned by the Prime pour l’Emploi... 20
- Beneficiaries of the Revenu de Solidarité Active (RSA)... 20
RECONCILING WORK AND FAMILY LIFE ... 22
- Conciliation between work and family in 2012 (in %) ... 22
- Daycare facilities for young children... 23
EXPLOITING JOB CREATION POLICIES... 25
- Total employment growth in 2013 ... 25
GENDER EQUALITY ... 27
- Employment gender gap ... 27
- Gender pay gap... 27
IMPROVING SKILLS SUPPLY AND PRODUCTIVITY, LIFELONG LEARNING... 28
- Lifelong learning... 28
- Growth in labour productivity ... 29
IMPROVING EDUCATION AND TRAINING SYSTEMS ... 30
- Educational levels of young people between 20 and 24 years of age ... 30
- Educational attainment of adults aged 20-64 year-olds in 2012 ... 31
- Early school leavers ... 31
- Public expenditure on education... 32
- Young people not in employment and not in education (NEET)... 33
WAGE SETTING MECHANISMS AND LABOUR COST DEVELOPMENT ... 34
- Evolution of social security contribution rates ... 34
- Average taxation rate per earned income bracket ... 37
- Evolution of nominal and real unit labour costs ... 38
- Evolution of the average wage per head ... 38
I - Increase labour market participation
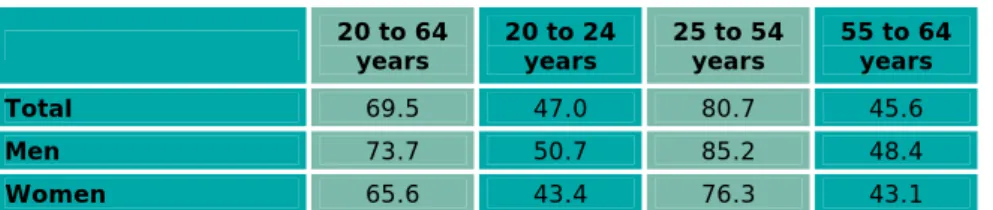
Table 1 • Employment rate in 2013In %
20 to 64
years 20 to 24 years 25 to 54 years 55 to 64 years
Total 69.5 47.0 80.7 45.6
Men 73.7 50.7 85.2 48.4
Women 65.6 43.4 76.3 43.1
Concepts: workforce employed as defined by the ILO (International Labour Office), exact age at date of survey, annual average.
Coverage: Population of households in Metropolitan France.
Source: Insee, Labour Force Surveys (provisional data for 2013); processed by Dares.
The employment rate for people aged 20 to 64, which is the proportion of people aged 20 to 64 in employment, reached 69.5% in 2013. It dropped off of one point in 2009 and stabilised since then. Due to the continued upward trend in female activity and the greater sensitivity of male employment to the economic situation, the employment rate for men (73.7% in 2013) showed a greater drop than that for women (65.6% in 2013), hence reducing the gender gap (8.1 points in 2013).
In 2013, less than 50% of young people aged 20 to 24 were in employment (47.0%). The decrease of youth employment rate observed during the crisis in 2009 continued afterwards, in relation to the further extension of schooling since 2009.
As concerns older age groups, their employment rate was not affected by the crisis and even steeply increased since 2010. Within this age group, the employment rate strongly decreases around 60 years old: while the employment rate of people aged 55 to 59 is therefore close to that of population as a whole, employment rate of people aged 60 to 64 remains far short of population as a whole (less than one out of four persons in 2013).
Table 2 • Unemployment rate
In % 2003 2007 2008 2009 2010 2011 2012 2013 Total 8.3 7.7 7.1 8.8 9.0 8.8 9.4 9.9 Men 7.5 7.3 6.8 8.7 8.8 8.6 9.5 10.1 15 to 64 years Women 9.1 8.1 7.4 8.8 9.1 9.1 9.4 9.8 Total - - - 24.0 Men - - - 23.9 18 to 24 years Women - - - 24.1 Total - - - 8.7 Men - - - 8.7 25 to 54 years Women - - - 8.7 Total - - - 7.0 Men - - - 7.5 55 to 64 years Women - - - 6.5
Concepts: unemployment as defined by the ILO, exact age at date of survey, annual average. Coverage: Population of households in Metropolitan France.
Source: Labour Force Surveys and Insee, processed by Dares; provisional data for 2013
In 2013, 9.9% of the workforce in Metropolitan France aged between 15 and 64 were unemployed. After a strong decrease in 2006 and 2007 (-0.8 ppt), the unemployment average rate continued to fall between 2007 and 2008 (-0.6 ppt), despite the sharp decline in the job market which resulted in a major increase in the unemployment rate Number 09 – December 2014 Page 4
from the second half of 2008. Between 2008 and 2009, the unemployment rate rose sharply (+1.7 ppt), then less significantly between 2009 and 2010 (+0.2 ppt), with a decreasing rate all over 2010. The decrease continued until mid-2011 when the unemployment rate started to increase again until the first semester of 2013. Despite a rise in annual average, the unemployment rate approximately stabilised since the beginning of year 2013, with a slight decrease (-0.1 ppt) at the end of the year.
Between 2008 and 2012, the rise of unemployment affected all age groups. The unemployment rate for young people is much higher than for other age groups: 24.0% of the workforce aged between 18 and 24 were out of work in 2013. The unemployment rate among people aged between 55 and 64 (7.0% in 2013) is lower than among younger members of the workforce but has increased faster than that of people aged between 25 and 54 since the beginning of the crisis.
The crisis hit more strongly sectors traditionally employing more men (industries, construction). Consequently, women’s unemployment rate became inferior to that of men’s, following the trend of reduction of the gender gap observed since 1975. The unemployment rates of men and women are close for young people aged between 18 and 24 and middle-aged people between 25 and 54. It is one point inferior for women aged between 55 and 64.
Table 3 • Unemployment rates by qualification and time since leaving initial education in 2013
In % Leaving initial
education between 1 and 4 years ago
Leaving initial education between 5 and 10 years ago
Leaving initial education 11 or more years ago
Low qualifications 48.8 33.3 13.1
Medium qualifications 24.7 15.1 7.6
High qualifications 10.5 6.2 4.3
Total 20.3 12.5 7.8
Concepts: unemployment as defined by the ILO, ISCED educational nomenclature; 5 and 6: high qualifications, 3 and 4: medium qualifications (baccalaureate or CAP (Certificate of Professional Aptitude) / BEP (Diploma of Professional Studies), 1 and 2: low qualifications (“brevet” [certificate upon completion of lower secondary studies], CEP [Certificate of Primary Studies] or no qualifications)
Coverage: Population of households in Metropolitan France, workforce having left initial education (school or universities studies without interruption of more than 1 year, including apprenticeship). People not having followed an initial educational programme have not been taken into account.
Source: Labour Force Surveys and Insee, processed by Dares; provisional data for 2013
In 2013, the unemployment rate for young people who left initial education between 1 and 4 years ago stood at 20.3%. It varied very considerably depending on level of qualification: the unemployment rate for those with low qualifications (brevet, CEP, or no qualifications) stood at 48.8%, while that for those with high qualifications was 10.5%. Between 2008 and 2012, unemployment rates increased whatever the level of qualification and length of time on the job market.
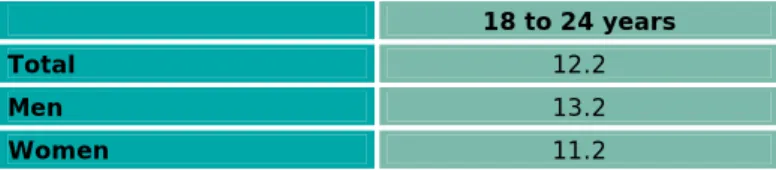
Table 4 • Youth unemployment ratio in 2013
In % of the total population aged between 18 and 24 18 to 24 years
Total 12.2
Men 13.2
Women 11.2
Concepts: unemployment as defined by the ILO, exact age at date of survey, annual average. Coverage: Population of households in Metropolitan France.
Source: Labour Force Surveys and Insee, processed by Dares; provisional data for 2013
In 2013, although the unemployment rate (ratio between the number of unemployed Number 09 – December 2014 Page 5
people and the active population) for young people aged between 18 and 24 stood at 24.0%, the unemployment share (ratio between the number of unemployed people and the total population in the age group under consideration) for young people aged between 18 and 24 was only 12.2% for the same year, as around half of young people in this age group were continuing their studies without working. The unemployment share is much lower for young women than for young men (-2.0 pts in 2012).
Table 5 • Participation rate
In % 2003 2007 2008 2009 2010 2011 2012 2013 Total 69.8 69.7 69.9 70.3 70.2 70.2 70.7 71.1 Men 75.7 74.7 74.7 75.0 74.8 74.6 75.2 75.4 15 to 64 years Women 64.1 64.9 65.2 65.7 65.8 65.8 66.3 66.9 Total - - - 50.8 Men - - - 55.3 18 to 24 years Women - - - 46.3 Total - - - 88.3 Men - - - 93.3 25 to 54 years Women - - - - - - - 83.5 Total - - - 49.1 Men - - - 52.3 55 to 64 years Women - - - 46.1
Concepts: activity as defined by the ILO, exact age at date of survey, annual average. Coverage: Population of households in Metropolitan France.
Source: Labour Force Surveys and Insee, processed by Dares; provisional data for 2013
In 2013, 71.1 % of people aged between 15 and 64 belonged to the labour force (i.e. in employment or jobless). For men, the rate was 75.4% in 2013. For women of the same age, the participation rate was close to 66.9%, in constant progression since 2003 (+2.8 points between 2003 and 2013). Due to longer schooling, the participation rate for young people aged between 18 and 24, which was 50.8% in 2013, is on a downwards path since 2009. Participation rate between 55 and 64 strongly increased for men and women alike (+8.2 points and +9.7 points respectively) between 2003 and 2013. Within this age group, the participation rate decreases strongly around 60 years old: while three out of four older workers aged 55 to 59 are active, less than one out of four is still active after 60 years of age.
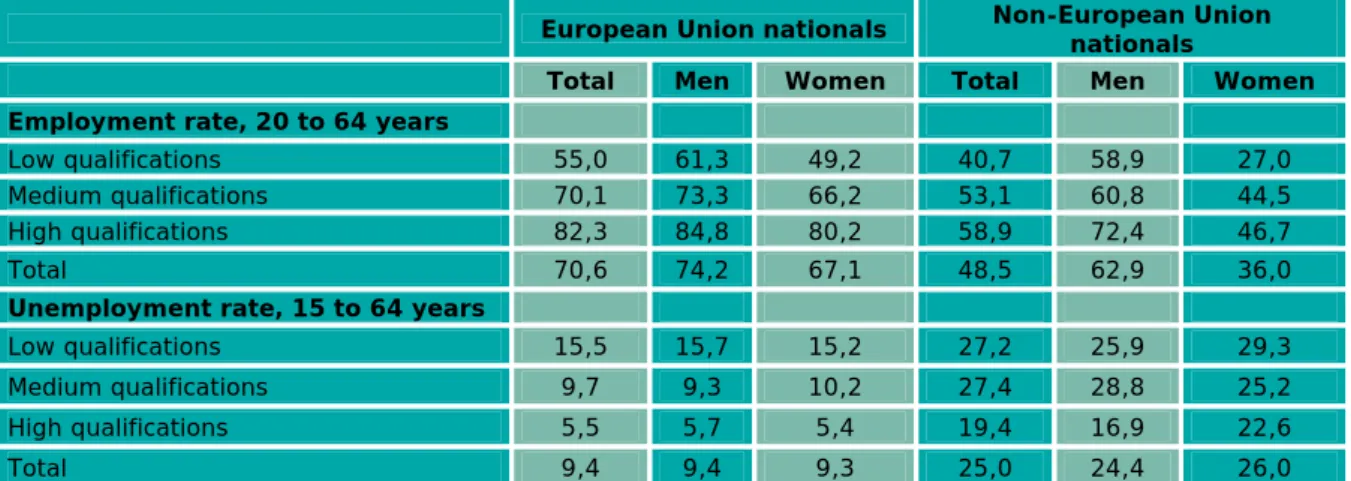
Table 6 • Employment and unemployment rates for European Union nationals and nationals of non-EU countries in 2012
In % European Union nationals Non-European Union nationals
Total Men Women Total Men Women Employment rate, 20 to 64 years
Low qualifications 55,0 61,3 49,2 40,7 58,9 27,0 Medium qualifications 70,1 73,3 66,2 53,1 60,8 44,5 High qualifications 82,3 84,8 80,2 58,9 72,4 46,7
Total 70,6 74,2 67,1 48,5 62,9 36,0
Unemployment rate, 15 to 64 years
Low qualifications 15,5 15,7 15,2 27,2 25,9 29,3 Medium qualifications 9,7 9,3 10,2 27,4 28,8 25,2 High qualifications 5,5 5,7 5,4 19,4 16,9 22,6
Total 9,4 9,4 9,3 25,0 24,4 26,0
Concepts: workforce as defined by the ILO, ISCED educational nomenclature; 5 and 6: high qualifications, 3 and 4: medium qualifications (baccalaureate or CAP/BEP), 1 and 2: low qualifications (“brevet”, CEP or no qualifications).
Coverage: Population of households in Metropolitan France.
Source: 2013 Labour Force Surveys and Insee, processed by Dares; provisional data.
In 2013, the employment rate for European Union nationals aged between 20 to 64 (27 countries, including the French citizens) stood at 70.6% and that for non-European Union nationals at 48.5%. The gap in employment rates between EU nationals and non EU nationals was significantly higher for women (31 points) than for men (11 points).
The unemployment rate for non-European Union nationals aged between 15 and 64 (25.0%) was two and a half times higher than that for European Union nationals (9.6%) in 2013. The gap was particularly marked among those holding higher education qualifications, for which unemployment rate of non EU nationals is almost four times higher.
Table 7 • Underemployment rate in 2013
In % of employment 20 to 64 years 20 to 24 years 25 to 54 years 55 to 64 years
Total 6.4 11.6 6.0 5.6
Men 3.4 7.2 3.1 2.9
Women 9.6 16.6 9.1 8.4
Definitions: employed labor force and underemployment (ILO definition), underemployment = involuntary part-time + temporary layoff or short part-time working, exact age at date of survey, annual average.
Coverage: Population of households in Metropolitan France.
Source: Labour Force Surveys and Insee, processed by Dares; provisional data for 2013
In 2013, 3.4% of working men and 9.6% of working women aged between 20 and 64 are underemployed : they worked part-time but wanted to work more hours and were available to do so (involuntary part-time), or worked involuntary less than usual (temporary layoff or short time working). The underemployment rate is especially high for young women (16.6% of all 20 to 24 year old women jobs correspond to a situation of underemployment).
Table 8 • Average exit age from the labour market
[Average age of people aged 50 and over no longer participating in the labour force at the time of the survey but who declared having been in work or in unemployment 11 months earlier]
2003 2007 2008 2009 2010 2011 2012 2013 Total 58.9 59.1 59.1 59.6 59.7 60.0 60.4 60.3
Concepts: declared participation to the labour forced, exact age at date of survey, people aged 50 and over who declared participating in the labour force 11 months before the survey but did no more participate at the time of the survey are considered as being exited from the labour force.
Coverage: Population of households in Metropolitan France.
Source: Labour Force Surveys and Insee, processed by Dares; provisional data for 2013
People aged 50 and over no longer participating in the labour force in 2013 but who declared having been in work or in unemployment 11 months earlier were on average 60.3 years old in 2013. This average age slightly decreases compared to 2012 (60.4 years) but stays superior to that observed in 2008 (+5 quarters).
Table 9 • Employment rate and core employment rate for 55-64 years of age Employment rate in 2013 In %
55 to 59 years 60 to 64 years 55 to 64 years
Total 67.6 23.3 45.6
Men 71.4 24.8 48.4
Women 64.1 22.0 43.1
Concepts: employed workforce as defined by the ILO, exact age at date of survey, annual average. Coverage: Population of households in Metropolitan France.
Source: Labour Force Surveys and Insee, processed by Dares; provisional data for 2013
Core employment rate In % 55 to 59 years 60 to 64 years 55 to 64 years
Total 67.7 23.4 45.6
Men 71.5 24.7 48.1
Women 64.0 22.1 43.1
Concepts: workforce occupied as defined by the ILO, exact age at the time of the survey, annual average. Core employment rate: arithmetical average of rates by age detail; it is therefore not weighted by size of the various groups and enables neutralisation of the effects of demographic composition, which were of major consequence from 1996 onwards with the arrival of the “baby boom” generation in the 50 years old and over age group, with very considerable impact on the effective employment rate.
Coverage: Population of households in Metropolitan France.
Source: Labour Force Surveys and Insee, processed by Dares; provisional data for 2013
Corrected to take account of baby-boom demographic effects, the employment rate for older members of the workforce (referred to as the core employment rate) was in constant growth between 2003 and 2012, with a marked rise between 2008 and 2010 and again between 2010 and 2012. The rise of the core employment rate concerned both people aged between 55 and 59 and people aged between 60 and 64, though with a smaller scale, men and women alike.
II - Enhancing labour market functioning and combating
segmentation
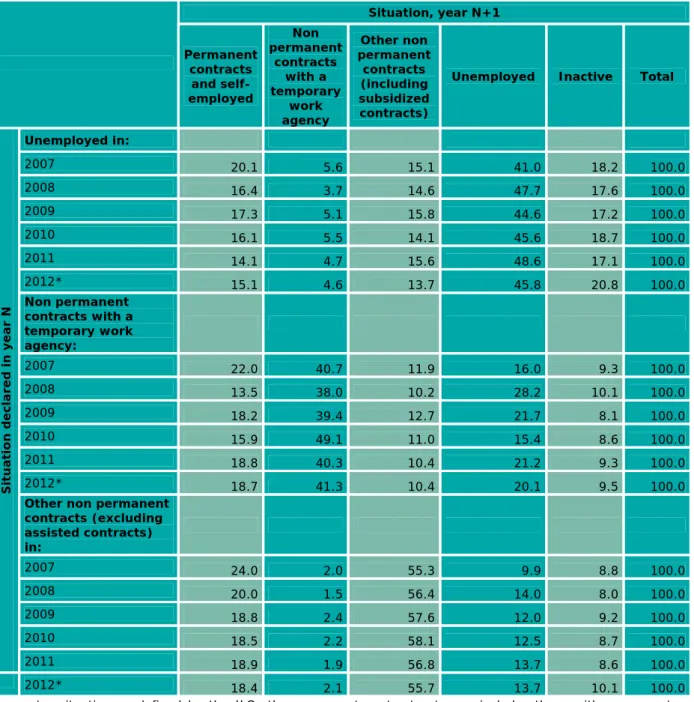
Table 10 • Annual transitions between the various situations on the labour market In % Situation, year N+1 Permanent contracts and self-employed Non permanent contracts with a temporary work agency Other non permanent contracts (including subsidized contracts)
Unemployed Inactive Total
Unemployed in: 2007 20.1 5.6 15.1 41.0 18.2 100.0 2008 16.4 3.7 14.6 47.7 17.6 100.0 2009 17.3 5.1 15.8 44.6 17.2 100.0 2010 16.1 5.5 14.1 45.6 18.7 100.0 2011 14.1 4.7 15.6 48.6 17.1 100.0 2012* 15.1 4.6 13.7 45.8 20.8 100.0 Non permanent contracts with a temporary work agency: 2007 22.0 40.7 11.9 16.0 9.3 100.0 2008 13.5 38.0 10.2 28.2 10.1 100.0 2009 18.2 39.4 12.7 21.7 8.1 100.0 2010 15.9 49.1 11.0 15.4 8.6 100.0 2011 18.8 40.3 10.4 21.2 9.3 100.0 2012* 18.7 41.3 10.4 20.1 9.5 100.0
Other non permanent contracts (excluding assisted contracts) in: 2007 24.0 2.0 55.3 9.9 8.8 100.0 2008 20.0 1.5 56.4 14.0 8.0 100.0 2009 18.8 2.4 57.6 12.0 9.2 100.0 2010 18.5 2.2 58.1 12.5 8.7 100.0 Situation declared in y e ar N 2011 18.9 1.9 56.8 13.7 8.6 100.0 2012* 18.4 2.1 55.7 13.7 10.1 100.0
Concepts: situation as defined by the ILO; the permanent contract category includes those with permanent contracts in the private sector and state-owned companies as well as civil service officials; other temporary contracts include fixed-term contracts in the private sector and state-owned companies, fixed-term contracts, assistants and part-time employees in the public sector and assisted jobs inventoried by the Employment Survey.
* In 2013, an upgrading of the survey questionnaire may have led to changes in the classification of individuals according to the activity status as defined by ILO. More particularly, individuals may have been categorized as unemployed whereas they would have been considered as inactive with the former questionnaire. Thus, the data on transitions between years 2012 and 2013 are not fully comparable with those reported in previous years.
Coverage: Population of households in Metropolitan France.
Source: Labour Force Surveys 2007-2013, Insee, processed by Dares on panel data; provisional data for 2013.
Among the unemployed in the year 2012, 45.8% were still unemployed one year later and 33.4% had found jobs: 15.1% under permanent contracts or as self-employed workers, 4.6% as temporary workers, and 13.7% under other non permanent contracts. Workers with non permanent contracts in 2012 are more frequently under a permanent contract in 2013 than individuals who were unemployed : individuals working with a temporary work agency and those under other temporary contracts (including subsidised jobs) in 2012 were respectively 18.7% % and 18.4% under permanent contract (including non dependant jobs) one year later. However, a large share of workers remain in the same type of contract from one year to the next: 41.3% of those who had been employed by a temporary work agency were still working under the same kind of contract one year later. For other non permanent contracts, the share is 55.7%.
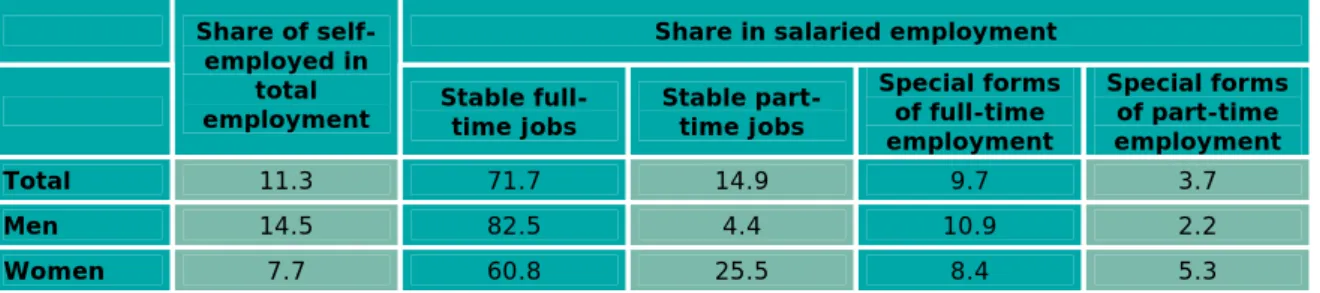
Table 11 • Part-time, special forms of wage employment, and share of self-employed in total employment in 2013
In % Share in salaried employment
Share of self-employed in
total
employment Stable full-time jobs Stable part-time jobs
Special forms of full-time employment Special forms of part-time employment Total 11.3 71.7 14.9 9.7 3.7 Men 14.5 82.5 4.4 10.9 2.2 Women 7.7 60.8 25.5 8.4 5.3
Concept: workforce occupied as defined by the ILO, special forms of employment include temping, FTCs (those under fixed-term contracts, auxiliaries and part-time workers in the public sector, as well as assisted jobs inventoried by the Employment Survey (essentially internships and non-commercial).
Coverage: Population of households in Metropolitan France.
Source: Labour Force Surveys and Insee, processed by Dares; provisional data for 2013
In 2013, 11.3% of jobs were occupied by self-employed workers. The self-employed status is about twice as common among men (14.5% in 2013) than among women (7.7% in 2013).
In 2013, 13.4% of wage employment fell into the “special forms” category (temping, subsidized employment and fixed-term contracts). Women are a little more frequently employed in such jobs than men (13.7% and 13.1% respectively).
In 2013, 18.6% of employees worked part-time, the great majority of them women. More than three out of ten women worked part-time. The share of part-time work in wage employment as a whole was roughly stable until the crisis. Since 2008, it increased by 1.5 point for men and 1.1 point for women.
Full-time jobs under long-term contracts continued to be the predominant form in wage employment, accounting for 71.7% of all wage employment in 2013. This was above all the case for men, over eight out of ten of whom were in wage employment, against six out of ten for women.
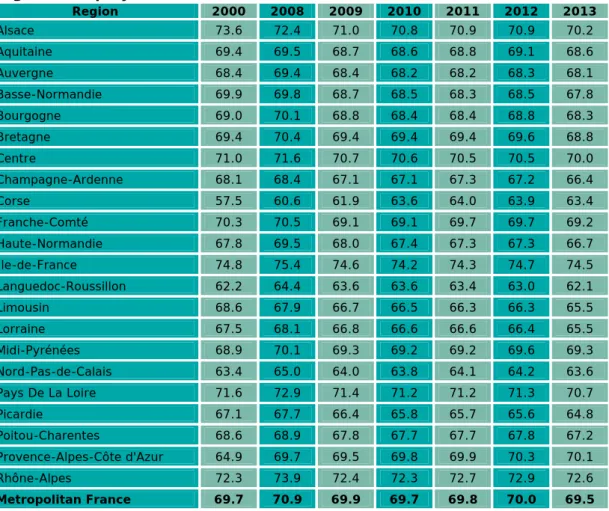
Table 12 • Dispersion of regional employment and unemployment rates
Regional employment rates In %
Region 2000 2008 2009 2010 2011 2012 2013 Alsace 73.6 72.4 71.0 70.8 70.9 70.9 70.2 Aquitaine 69.4 69.5 68.7 68.6 68.8 69.1 68.6 Auvergne 68.4 69.4 68.4 68.2 68.2 68.3 68.1 Basse-Normandie 69.9 69.8 68.7 68.5 68.3 68.5 67.8 Bourgogne 69.0 70.1 68.8 68.4 68.4 68.8 68.3 Bretagne 69.4 70.4 69.4 69.4 69.4 69.6 68.8 Centre 71.0 71.6 70.7 70.6 70.5 70.5 70.0 Champagne-Ardenne 68.1 68.4 67.1 67.1 67.3 67.2 66.4 Corse 57.5 60.6 61.9 63.6 64.0 63.9 63.4 Franche-Comté 70.3 70.5 69.1 69.1 69.7 69.7 69.2 Haute-Normandie 67.8 69.5 68.0 67.4 67.3 67.3 66.7 Île-de-France 74.8 75.4 74.6 74.2 74.3 74.7 74.5 Languedoc-Roussillon 62.2 64.4 63.6 63.6 63.4 63.0 62.1 Limousin 68.6 67.9 66.7 66.5 66.3 66.3 65.5 Lorraine 67.5 68.1 66.8 66.6 66.6 66.4 65.5 Midi-Pyrénées 68.9 70.1 69.3 69.2 69.2 69.6 69.3 Nord-Pas-de-Calais 63.4 65.0 64.0 63.8 64.1 64.2 63.6 Pays De La Loire 71.6 72.9 71.4 71.2 71.2 71.3 70.7 Picardie 67.1 67.7 66.4 65.8 65.7 65.6 64.8 Poitou-Charentes 68.6 68.9 67.8 67.7 67.7 67.8 67.2 Provence-Alpes-Côte d'Azur 64.9 69.7 69.5 69.8 69.9 70.3 70.1 Rhône-Alpes 72.3 73.9 72.4 72.3 72.7 72.9 72.6 Metropolitan France 69.7 70.9 69.9 69.7 69.8 70.0 69.5
Note: Employment rates for the 20-64 age group are based on annual averages. Methodological differences explain the slight overestimation of employment rates for Metropolitan France presented in this table in comparison with those presented on Page 6.
Source: annual estimations of employment and estimations of population, calculations by the “Synthèse et Conjoncture de l'Emploi” unit (SCE – Employment Outlook Unit), Insee, provisional data for 2012 and 2013. Table 13 • Dispersion of regional employment rates
In % points
2000 2008 2009 2010 2011 2012 2013 Dispersion indicator 5.5 4.7 4.7 4.6 4.7 4.9 5.2
Interpretation: dispersion is measured by the coefficient of variation of regional employment rates, weighted by the region’s population aged between 20 and 64 years old. Employment rates are annual averages.
The coefficient of variation is the standard deviation divided by the average. This coefficient decreases when employment rates approach the average and increases when rates diverge (i.e. when disparity between regions increases).
Source: annual estimations of employment and estimations of population, calculations by the “Synthèse et Conjoncture de l'Emploi” unit (SCE), Insee, provisional data for 2012 and 2013.
Between 2008 and 2009, regional employment rates fell sharply in most regions because of the outbreak of the economic crisis. Between 2009 and 2012, changes in employment rates were moderate, a little less than half of the regions experienced an increase in their employment rate over the three years. In 2013, employment rates were down in most regions and ranged in Metropolitan France from 62.1% for the Languedoc-Roussillon to 74.5% for the Ile-de-France. In Metropolitan France as a whole, employment rate of people aged 20 to 64 years has decreased from 70.0% in 2012 to 69.5% in 2013. After declining from 2000 to 2004, the indicator of regional dispersion of employment rates slightly increased until 2008. Between 2008 and 2011, the spread of employment rate between regions remained relatively stable. It then increased significantly between 2011 and 2013.
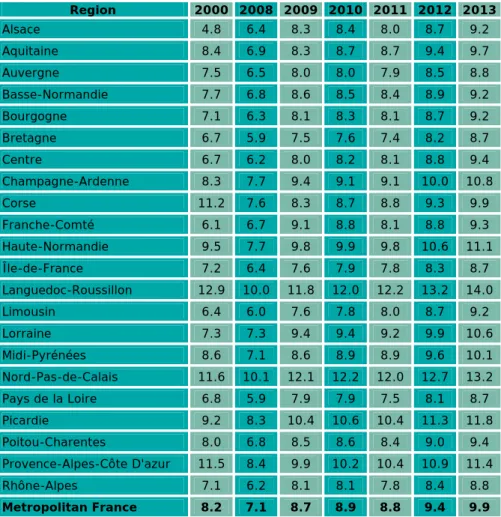
Table 14 • Regional unemployment rates In % Region 2000 2008 2009 2010 2011 2012 2013 Alsace 4.8 6.4 8.3 8.4 8.0 8.7 9.2 Aquitaine 8.4 6.9 8.3 8.7 8.7 9.4 9.7 Auvergne 7.5 6.5 8.0 8.0 7.9 8.5 8.8 Basse-Normandie 7.7 6.8 8.6 8.5 8.4 8.9 9.2 Bourgogne 7.1 6.3 8.1 8.3 8.1 8.7 9.2 Bretagne 6.7 5.9 7.5 7.6 7.4 8.2 8.7 Centre 6.7 6.2 8.0 8.2 8.1 8.8 9.4 Champagne-Ardenne 8.3 7.7 9.4 9.1 9.1 10.0 10.8 Corse 11.2 7.6 8.3 8.7 8.8 9.3 9.9 Franche-Comté 6.1 6.7 9.1 8.8 8.1 8.8 9.3 Haute-Normandie 9.5 7.7 9.8 9.9 9.8 10.6 11.1 Île-de-France 7.2 6.4 7.6 7.9 7.8 8.3 8.7 Languedoc-Roussillon 12.9 10.0 11.8 12.0 12.2 13.2 14.0 Limousin 6.4 6.0 7.6 7.8 8.0 8.7 9.2 Lorraine 7.3 7.3 9.4 9.4 9.2 9.9 10.6 Midi-Pyrénées 8.6 7.1 8.6 8.9 8.9 9.6 10.1 Nord-Pas-de-Calais 11.6 10.1 12.1 12.2 12.0 12.7 13.2 Pays de la Loire 6.8 5.9 7.9 7.9 7.5 8.1 8.7 Picardie 9.2 8.3 10.4 10.6 10.4 11.3 11.8 Poitou-Charentes 8.0 6.8 8.5 8.6 8.4 9.0 9.4 Provence-Alpes-Côte D'azur 11.5 8.4 9.9 10.2 10.4 10.9 11.4 Rhône-Alpes 7.1 6.2 8.1 8.1 7.8 8.4 8.8 Metropolitan France 8.2 7.1 8.7 8.9 8.8 9.4 9.9
Note: unemployment rates are annual average. People aged 15 years old and over.
Source: unemployment estimations, calculations by the “Synthèse et Conjoncture de l'Emploi” unit (SCE, Employment Outlook Unit), Insee, provisional data for 2012 and 2013.
Table 15 • Dispersion of regional unemployment rates
In % points 2000 2008 2009 2010 2011 2012 2013 Dispersion indicator 23.4 17.3 15.4 15.0 16.0 15.6 15.5
Interpretation: dispersion is measured by the coefficient of variation of regional unemployment rates, weighted by the region’s active population. Unemployment rates are annual averages.
The coefficient of variation is the standard deviation divided by the average. This coefficient decreases when unemployment rates approach the average and increases when rates diverge (i.e. when disparity between regions increases).
Source: Insee, calculations by the “Synthèse et Conjoncture de l'Emploi” unit (SCE), Insee, provisional data for 2012 and 2013.
Between 2008 and 2009, the unemployment rate rose sharply in all regions (+1.6 points for Metropolitan France). Between 2009 and 2010, though it affected a large majority of regions, the increase was more moderate (+0.2 point). Changes in regional unemployment rates were also slight in 2011. As the overall national trend was in small decline, two thirds of the regions experienced a decrease of their unemployment rates. Deterioration of the labor market observed since mid-2011 led to strong increases in regional unemployment rates in 2012 which continued in 2013. Unemployment rate rose in France by 0.6 percentage points in 2012 and 0.5 points in 2013 to 9.9%. In 2013, the unemployment rate for metropolitan areas ranged from 8.7% in Ile-de-France, Bretagne and Pays de la Loire to 14.0% in Languedoc-Roussillon.
The indicator of regional dispersion of unemployment rates fell during economic slowdowns (2001-2004 and 2008-2010) and was higher in cyclical improvement period (2004-2008). After rising by 1 percentage point between 2010 and 2011, the dispersion fell back in 2012 before remaining stable between 2012 and 2013.
Table 16 • Occupational accidents and occupational diseases Evolution of reported occupational accidents
2000 2008 2009 2010 2011 2012
Accidents with sick-leave in thousands 743 704 651 659 670 641
Deaths 730 569 538 529 552 558
Frequency index 44.1 38.0 36.0 36.0 36.2 35.0 Severity rate 1.0 1.3 1.3 1.3 1.4 1.4
Note: the term “accidents with sick-leave” covers all Occupational Accidents compensated, for the first time during the year in question, by payment of a cash benefit (daily allowance, capital indemnity, or annuity), or which could be so compensated if the victim had a beneficiary.
Coverage: 18.3 million employees in the Social Security system in 2012, essentially from the non-agricultural private sector.
Source: Caisse nationale d’assurance maladie des travailleurs salariés (Cnam-TS – National Health Insurance Fund for Salaried Workers)
The risk of reporting an occupational accident (OA) may be measured by the frequency index (number of OAs with sick-leave per 1 000 employees). It is calculated here on 18.3 million employees in the Social Security system, essentially from the non-agricultural private sector.
The number of recognized cases of OA with sick-leave fell by 703,976 in 2008 to 640,891 in 2012. This decrease is a continuation of a long term trend of declining OA, in absolute and relative numbers: between 2000 and 2012 the number of recognized accidents fell by 100 000 cases, a decrease of 14 %, and the frequency index fell from 44.1 in 2010 to 35.0 in 2012, a decrease of 21 %.
As during every recession, the financial crisis has resulted in a significant decrease in the frequency index of OA between 2008 and 2009, which is partly due to the slowdown in economic activity. In fact, during a recession, work intensity tends to decrease because the cuts in employment do not match immediately with the reduction of output. Sectors1
which had seen the greatest drop-off in their workforces (metallurgy, chemicals, wood industries, and services excluding banking and insurance) also saw the greatest reduction in occupational accidents’ frequency, with -8% to -10% of OA’s risk. Similarly, the decline in the use of temporary workers (-26 % in 2009) and perhaps, to a lesser extent, the possible change in main employment status of certain temporary workers to self-employed (whose OAs are no longer declared to the CNAM [Caisse Nationale d’Assurance Maladie – National Health Insurance Fund]), contribute to the fall of the frequency index between 2008 and 2009.
Although employees have been less exposed to OA risk over the last ten or so years, accidents that do occur are of greater severity. The severity rate (number of days lost following an OA per thousand work hours) has increased by 40 % since 2000.
Numbers of fatal occupational accidents, falling since 2000, has increased between 2010 and 2012 (730 deaths in 2000, 529 in 2010 and 558 in 2012).
1) Comités techniques nationaux (National Technical Committees - CTN).
Evolution of occupational diseases compensated each year
2000 2008 2009 2010 2011 2012
Occupational diseases in thousands 21 45 49 51 55 54 Deaths 237 425 564 533 570 523
Note: the term “occupational diseases” covers all Occupational Diseases compensated, for the first time during the year in question, by payment of a cash benefit (daily allowance, capital indemnity, or annuity).
Coverage: 18.3 million employees in the Social Security system in 2012, essentially from the non-agricultural private sector.
Source: Caisse nationale d’assurance maladie des travailleurs salariés (Cnam-TS – National Health Insurance Fund for Salaried Workers)
The number of compensated occupational diseases (ODs) increased rapidly, passing from 21 697 in 2000 to 54 015 in 2012. The rise resulted from a trend towards greater labour intensification and improved legal recognition of ODs, along with greater awareness among the medical profession of the potentially occupational origin of certain pathologies. Year 2012 registered for the first time a decrease of the number of recognised occupational diseases.
The share of musculoskeletal disorders continued to grow, accounting for over 85% of occupational diseases compensated in 2012.
The number of deaths caused by recognised ODs increased more than twofold from 2000 to 2012. These fatalities are mostly due to asbestos.
III - Active labour market policies
Table 17 • Long-term unemployment rateIn % of the active population 2013
Total 4.0
Men 4.1
Women 3.9
Note: unemployed people for whom no information exists on duration of unemployment are divided up proportionally between less than a year and more than a year.
Concepts: activity as defined by the ILO.
Coverage: Population of households in Metropolitan France.
Sources: Labour Force surveys, Insee, processed by Dares; provisional data for 2013.
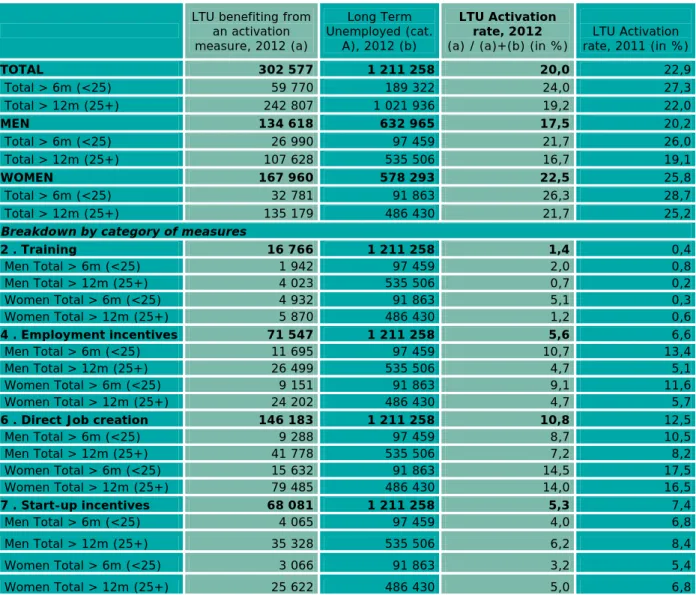
In 2013, 4.0% of people participating in the labour force are unemployed since at least a year. Long-term unemployment rates of women and men are virtually at the same level. Table 18 • Activation rate of Long Term registered Unemployed
LTU benefiting from an activation measure, 2012 (a) Long Term Unemployed (cat. A), 2012 (b) LTU Activation rate, 2012
(a) / (a)+(b) (in %) rate, 2011 (in %)LTU Activation
TOTAL 302 577 1 211 258 20,0 22,9 Total > 6m (<25) 59 770 189 322 24,0 27,3 Total > 12m (25+) 242 807 1 021 936 19,2 22,0 MEN 134 618 632 965 17,5 20,2 Total > 6m (<25) 26 990 97 459 21,7 26,0 Total > 12m (25+) 107 628 535 506 16,7 19,1 WOMEN 167 960 578 293 22,5 25,8 Total > 6m (<25) 32 781 91 863 26,3 28,7 Total > 12m (25+) 135 179 486 430 21,7 25,2
Breakdown by category of measures
2 . Training 16 766 1 211 258 1,4 0,4 Men Total > 6m (<25) 1 942 97 459 2,0 0,8 Men Total > 12m (25+) 4 023 535 506 0,7 0,2 Women Total > 6m (<25) 4 932 91 863 5,1 0,3 Women Total > 12m (25+) 5 870 486 430 1,2 0,6 4 . Employment incentives 71 547 1 211 258 5,6 6,6 Men Total > 6m (<25) 11 695 97 459 10,7 13,4 Men Total > 12m (25+) 26 499 535 506 4,7 5,1 Women Total > 6m (<25) 9 151 91 863 9,1 11,6 Women Total > 12m (25+) 24 202 486 430 4,7 5,7
6 . Direct Job creation 146 183 1 211 258 10,8 12,5
Men Total > 6m (<25) 9 288 97 459 8,7 10,5 Men Total > 12m (25+) 41 778 535 506 7,2 8,2 Women Total > 6m (<25) 15 632 91 863 14,5 17,5 Women Total > 12m (25+) 79 485 486 430 14,0 16,5 7 . Start-up incentives 68 081 1 211 258 5,3 7,4 Men Total > 6m (<25) 4 065 97 459 4,0 6,8 Men Total > 12m (25+) 35 328 535 506 6,2 8,4 Women Total > 6m (<25) 3 066 91 863 3,2 5,4 Women Total > 12m (25+) 25 622 486 430 5,0 6,8 Source: Dares, Eurostat LMP database, 2012 ; data extracted on 22 april 2014. Estimations by Dares. Annual average. France.
Long-term Unemployed (monthly stock): "category A" (registered jobseekers obliged to actively seek a job, excluding those having performed short-term reduced activity).
Long-term unemployed : Youth (<25 years) with more than 6 month continuous spell of unemployment ; Adults (25 years or more) with more than 12 months continuous spell of unemployment.
. Category 2: data very incomplete. Data by unemployment spell are not available for the training sessions organized by the Regions or by the Central government.
. Category 3: no measure of "job rotation and job sharing" in France.
. Category 4: Single inclusion contract (CUI-CIE), Professionalization contract, Economic integration enterprises and intermediary associations.
. Category 5 (Sheltered and supported employment and rehabilitation): stock by unemployment spell are not available.
. Category 6: Single inclusion contract (CUI-CAE), and new program Employment for the future (EAV). . Category 7: Aid for the unemployed setting-up or rescuing a company (ACCRE).
After a peak at 350 000 in 2010, the number of long-term unemployed (LTU) having benefited from an active measure slightly progressed compared to 2009 and 2011 (290 000), since it overtook a little 300 000 in 2012. However, with the continuous increase of unemployment, particularly long-term unemployment, coupled with a certain contraction of entries into subsidised contracts, the rate of activation yield in 20 % in 2012, after 23 % in 2011.
The average number of subsidised contracts’ beneficiaries in the non profit sector progressed in 2012 (148 000 after 136 000 in 2011), but less than the long-term unemployment. Finally, the rates of activation for subsidised employment (categories 4, 6 and 7) continued to decrease in 2012.
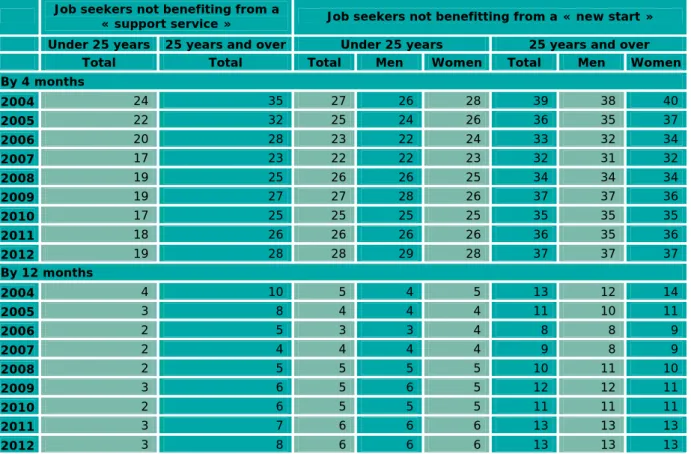
Table 19 • Prevention and participation in active measures by the long-term
unemployed In %
Job seekers not benefiting from a « support service » Job seekers not benefitting from a « new start »
Under 25 years 25 years and over Under 25 years 25 years and over
Total Total Total Men Women Total Men Women
By 4 months 2004 24 35 27 26 28 39 38 40 2005 22 32 25 24 26 36 35 37 2006 20 28 23 22 24 33 32 34 2007 17 23 22 22 23 32 31 32 2008 19 25 26 26 25 34 34 34 2009 19 27 27 28 26 37 37 36 2010 17 25 25 25 25 35 35 35 2011 18 26 26 26 26 36 35 36 2012 19 28 28 29 28 37 37 37 By 12 months 2004 4 10 5 4 5 13 12 14 2005 3 8 4 4 4 11 10 11 2006 2 5 3 3 4 8 8 9 2007 2 4 4 4 4 9 8 9 2008 2 5 5 5 5 10 11 10 2009 3 6 5 6 5 12 12 11 2010 2 6 5 5 5 11 11 11 2011 3 7 6 6 6 13 13 13 2012 3 8 6 6 6 13 13 13
Support services: number of jobseekers entering the Category A in month M and still looking for work 4 months/12 months later and not having participated in any support service (Category LMP 1.1.2) compared with the total number of jobseekers entering Category A in month M.
New start: number of jobseekers entering the Category A in month M and still looking for work 4 months/12 months later and not having participated in any support service (Categories LMP 2 to 7) compared with the total number of jobseekers entering Category A in month M.
Category A jobseekers: unemployed jobseekers obliged to look actively for a job. Source: Pôle Emploi, log data file («fichier historique »).
In 2012, 19 % of the new Category A jobseekers under 25 continuously looking for employment during the 4 months following their entering the category did not take advantage of any support services (workshops, skills assessments, guidance support,
etc.) during that time. The rate was higher among new jobseekers aged 25 and over (28%). The same year, 3 % of new Category A jobseekers under 25 and 8 % of those aged 25 and over continuously looking for employment during the 12 months following their entering the category did not take advantage of any support service during that time.
In 2012, 28 % of the new Category A jobseekers under 25 continuously looking for employment during the 4 months following their entering the category did not take advantage of any support service enabling a New start (such as vocational training, job incentives, assisted and rehabilitation contracts, direct job creation, or assistance with company creation) during that time. The rate was higher among new jobseekers aged 25 years and over (37 %). In 2012, 6 % of new Category A jobseekers under 25 and 13 % of those aged 25 and over continuously looking for employment during the 12 months following their entry in the category, did not take advantage of any job-market policy measure during that time. Differences between women and men are not significant. Table 20 • Active Labour Market Policies expenditure (categories 2 to 7)
As a % of GDP
2007 2008 2009 2010 2011 2012
ALMP expenditure / GDP (%) 0.72 0.64 0.73 0.83 0.67 0.64 Source: Dares, Eurostat LMP database, Insee.
In 2012, expenditure for the active measures (categories 2-7) of the labor market policies decreased by 5 % in volume, whereas the GDP was almost stable in volume. So, after the exceptional effort granted in 2009-2010, expenditure for the ALMP expressed in points of GDP still contracted a little in 2012, and reached the level of years prior to 2009.
Table 21 • Active Labour Market Policies expenditure (categories 2 to 7) per person wanting to work
In constant € (2012 prices)
2007 2008 2009 2010 2011 2012
ALMP expenditure per person
wanting to work (Euro) 4 306 4 178 3 881 4 431 3 693 3 387
Source: Dares, Eurostat LMP database, Insee.
Due to the reduction in expenditure for the active labour market policies for the second consecutive year, (categories 2-7), conjugated to the increase of the unemployment figures of about 6 % in 2012, the average expenditure per person wanting to work decreased by 10 % in constant euros in 2012.
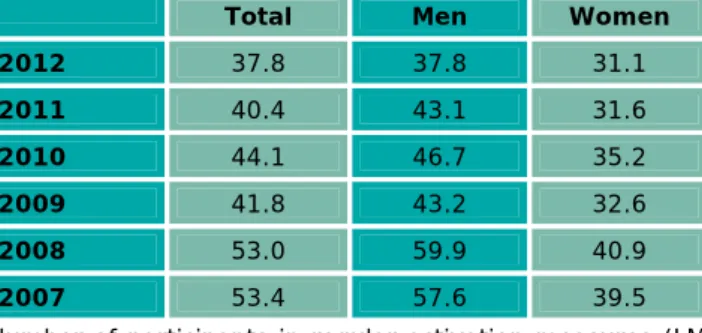
Table 22 • Active Labour Market Policies participants (categories 2 to 7) per 100 persons wanting to work
Total Men Women
2012 37.8 37.8 31.1 2011 40.4 43.1 31.6 2010 44.1 46.7 35.2 2009 41.8 43.2 32.6 2008 53.0 59.9 40.9 2007 53.4 57.6 39.5
Number of participants in regular activation measures (LMP categories 2-7) divided by the number of persons wanting to work (ILO unemployed plus labour reserve).
Source: Eurostat LMP database.
The share of the population wanting to work and benefiting from an active measure withdrew since 2009, because of the strong degradation of the labour market since the middle 2008. It rose in 2010, due to the economic recovery plan and the development of subsidised contracts. Since 2011, this ratio fell due to the weakening of entries into the active measures, combined with the increase of unemployment, particularly in 2012.
IV - Adequacy of the social protection system and make work
pay
1. Adequacy of the social protection system
Table 23 • People at risk of poverty according to a threshold at 60% of the median income by most frequent activity status (ILO definitions)
In % 2004 2005 2006 2007 2008 2009 2010 2010* 2011* Activity status (1) (ILO
definition)
Total (including people aged
less than 15) 12.6 13.1 13.1 13.4 13.0 13.5 14.1 14.0 14.3
In work 7.3 7.5 7.5 7.8 7.4 7.6 7.6 7.6 8.0
Unemployed 33.6 34.5 34.9 36.4 35.9 35.0 36.5 35.9 39.0 (1) The calculation of this ILO variable has been modified several times during the survey period, which could explain certain sharp evolutions. Age in year of revenue collection.
* From 2010, estimations of financial revenues refer to Property Income Survey 2010 .
Individuals: person living in Metropolitan France in an ordinary household whose reference person is not a student.
Income: declared household’s income is positive or zero.
Sources: Insee-DGI, Tax and Social Income Surveys retropoled from 1996 to 2004 ; Insee-DGFiP-Cnaf-Cnav-CCMSA, Tax and Social Income Surveys 2005 to 2011.
People in work are much less often exposed to poverty than others: the relationship between the risk of poverty rate of people in work and that of the total population actually fell from 0.58 to 0.54 between 2004 and 2010. In contrast, the poverty rate of people unemployed is significantly higher than the average: in the recent period, the ratio between these two rates stayed stable at around 2.6 to 2.7. Employment remains the best safeguard against poverty and this protective role has even increased during the last decade.
Table 24 • Out-of-work income maintenance expenditure (category 8)
As a percentage of GDP
2007 2008 2009 2010 2011 2012
LMP expenditure (8) 1.20 1.16 1.42 1.44 1.40 1.45
Source: Dares, Eurostat LMP database, Insee and Dares.
Expenditure for unemployment benefits (LMP category 8) rose by 3.5% in constant euros in 2012 (29.4 billion euros after 28.0 billion euros) in a context of flat growth. The ratio of expenditure over GDP reached 1.45% in 2012, getting closer to the highest levels reached between 2002 and 2005.
Table 25 • Out-of-work income maintenance expenditure (category 8) per
person wanting to work In euro
2007 2008 2009 2010 2011 2012
LMP expenditure (8) per
person wanting to work 7 202 7 515 7 542 7 702 7 658 7623
Source: Dares, Eurostat LMP database, Insee and Dares.
Expenditure for unemployment benefits (LMP category 8) rose by 3.5% in constant euros in 2012, while population wanting to work rose by 6.0% (including 8.0% ILO unemployed). The ratio of expenditure per person wanting to work slightly fell in 2012 but remains high since 2010. However, it stays inferior to ratios reached between 2003 and 2005.
2. Make work pay
Table 26 • Number of tax households concerned by the Prime pour l’Emploi
Year of taxation 2001 2007 2008 2009 2010 2011 2012 2013 In million 8.7 8.9 8.9 8.2 7.3 6.7 6.3 5.9 In % of total number of tax households 26.3% 25.0% 24.7% 22.5 % 20.0% 18.2% 17.4% 16.0% Scope: France
Interpretation: In 2013, 5.9 million tax households benefited from the PPE for their income in 2012.
Sources: Figures from the General Directorate for Public Finances, processed by the General Directorate of the Treasury.
Created in 2001, the in-work benefit, Prime pour l'Emploi (PPE – Employment Bonus), was designed to enable an increase in the additional income available occasioned by a low-paid professional activity. This tax credit aims to partly reduce the difference in taxes and social benefits between an inactive person and a worker.
The freeze of the PPE scale since 2009 (leaving the scale unchanged since 2008) and the imputation of the RSA Activité, created in 2009, on the PPE explain the drop in numbers of tax households benefiting from the PPE, which decreased from 8.9 million households in 2008 to 5.9 million in 2013.
Table 27 • Beneficiaries of the Revenu de solidarité active (RSA)
RSA “Activité” RSA in % of the RSA RSA “Activité”
2009 598 800 1 730 154 34.6
2010* 665 600 1 833 800 36.3
2011 675 600 1 869 600 36.1
2012 690 700 1 964 200 35.2
* Since 1rst of September 2010, people who are under 25 years old (under conditions of work) can benefit of the RSA. They represent less than 1% of beneficiaries.
Coverage: Metropolitan France Source: CNAF and MSA
RSA “Activité” RSA in % of the RSA RSA “Activité”
2011 707 800 2 067 300 34.2
2012 727 000 2 176 200 33.4
Coverage: France Source : CNAF and MSA
In June 2009, the RSA replaced the RMI and the API in Metropolitan France. The RSA is a family means-tested scheme designed for households. It may be paid to any person residing in France and aged 25 years and over, or, regardless of age, to anyone assuming responsibility for at least one child already born or yet to be born. Since September 2010, it was extended to people aged under 25 who had worked for at least two years during the previous three years. It has been implemented in French Overseas Departments since January 2011.
The RSA is a differential allowance, complementing households’ initial resources to bring them up to a guaranteed income calculated as the sum of two components:
‐ a lump sum, which scale depends on composition of the household;
‐ a percentage (62%) of the professional income drawn by household members.
Beneficiaries no longer receive the allowance once household income exceeds guaranteed income level. For members of a household whose resources fall below the lump sum, the RSA acts as a minimum welfare benefit (RSA “Socle” [“base”]). For people receiving a professional income and belonging to a household whose resources fall below the guaranteed income, the RSA acts as a complement to income from professional activity (RSA “Activité”). The difference must be made between the RSA “Activité seul” (“Activity only” – for those in work and whose total resources are greater than the lump sum), and the RSA “Socle + Activité” (for those in work and whose total resources fall below the lump sum). It is not necessary to have received the RSA “Socle” in order to receive the RSA “Activité”.
By the end of 2012, 2.18 million households in the whole of France have benefited from the RSA. During the same year, 727 000 people benefited from the RSA “Activité” in Metropolitan France (33.4% of the total number of RSA recipients). In Metropolitan France, in 2010, the beneficiaries of RSA “Activité” have grown much faster than the whole population of beneficiaries. On the other hand, since then, the growth of the number of RSA “Activité” has been lower than that of the whole number of recipients of RSA, and is then decreasing in comparison to 2010. Nevertheless, only the share of RSA “Activité seul” beneficiaries is decreasing (25.1% in 2010 versus 23.8% in 2012), while that of RSA “Socle + Activité” is stable since 2010.
V - Reconciling work and family life
Table 28 • Conciliation between work and family in 2012
Participation, working time and unemployment according to household situation in 2012
In % Participation
rate Full time Part time
Unemployment in total population Employment rate Household situation
Women Men Women Men Women Men Women Men Women Men In couple 66.6 77.0 41.4 66.9 19.5 4.0 5.7 6.1 60.9 70.9 Without children 63.7 70.8 43.1 61.2 15.5 4.8 5.1 4.9 58.6 66.0 1 child aged less than 3 80.8 95.8 54.2 84.0 16.6 4.2 10.0 7.6 70.8 88.2 2 children with at least one aged less than 3 66.2 96.5 33.2 86.0 27.7 4.0 5.4 6.5 60.9 90.0 3 children with at least one aged less than 3 40.5 86.9 17.6 70.0 18.3 5.1 4.6 11.8 35.9 75.1 1 child aged 3 or more 72.3 79.6 47.4 68.8 18.5 4.1 6.4 6.7 65.9 72.9 2 children aged 3 or more 71.9 78.9 42.6 70.7 24.3 3.1 4.9 5.1 66.9 73.8 3 children aged 3 or more 55.8 68.9 28.3 57.6 20.7 3.4 6.9 7.9 49.0 61.0 Single 66.8 70.9 43.5 54.7 14.3 5.4 9.0 10.8 57.8 60.1 Without children 67.8 75.7 47.5 60.2 13.3 5.7 7.0 9.8 60.8 65.9 With 1 child at least 65.6 60.4 38.9 42.7 15.4 4.8 11.3 12.9 54.3 47.5 Total 66.6 75.3 42.0 63.6 18.0 4.4 6.7 7.4 60.0 68.0
Note: annual average.
Coverage: Metropolitan France, person of reference in the household and potential partner aged 15 to 64. Source: Insee Labour Force Survey (2012).
In 2012, 66.6% of women in couple aged 15 to 64 are participating in the labor force, either being employed full time (41.4%), employed part-time (19.5%) or unemployed (5.7%). For mothers living in couple, having one or two children, when they are 3 years old or more is often combined with work. With at least three children, all 3 years old or more, female activity is weaker than with only one or two children above 3 years old. These disparities in labor force participation according to the number of children are more pronounced amongst women having at least one child aged less than 3 years. Besides, when these mothers work, they more likely work part-time. Unlike women, men’s participation is relatively unaffected by the number and the age of their children.
Table 29 • Daycare facilities for young children on the 31st December 2012 (not including nursery schools)
Daycare facilities Number of facilities Number of places comparison with number of Number of places in children in the age range
Collective crèches 2 117 81 393 3.5 % (0 - 2 years old) Of which, parental crèches 145 2 301 0.1 % (0 - 2 years old) Kindergartens and Toddler
daycare 263 8 617 0.2 % (2 - 6 years old)
Day nurseries 1 542 25 866 0.5 % (0 - 6 years old) Multiple care types facilities
(Structures multi-accueil) 7 556 - collective 218 021 9.4 % (0 - 2 years old) - family 10 629 0.2 % (0 - 6 years old)
Total collective facilities (not including family
daycare) 11 478 333 897 6.1 % (0 - 6 years old)
Family daycare services 695 42 585 0.8 % (0 - 6 years old)
Total establishments 12 173 387 111 7.1 % (0 - 6 years old)
Number of practising child minders with valid
certifications at 31/12/2012
Theoretical day care capacity
Theoretical day care capacity compared with number of
children in the age range
Practising child minders 314 226 944 279 17.3 % (0 - 6 years old) Notes
‐ Percentages given for children attending daycare facilities should be treated with caution: firstly, the same child may attend more than one such facility and secondly, the estimations given refer to the number of places available and is not the number of children actually attending such facilities. Data are based on authorised capacities compared with: the number of children under three years old on the 31 st December
2012 (2 319 511); the number of children between 0 and 6 years old on the 31 st December 2012 (5 460
322) ; the number of children between 2 and 6 years old on the 31st December 2012 (3 924 593).
‐ Collective crèches take in children under three years old.
‐ Parental crèches, referred to as “parent-managed establishments” since the decree of the 1st August 2000, are institutions set up in association with the parents who initiated their creation and who are responsible for managing them. They participate in provision of daycare for children alongside professionals in the field (number of places limited to 20). Daycare for under three-year-olds.
‐ Family daycare services or family crèches are made up of registered child minders, each of whom looks after from 1 to 4 children at home under the supervision of a nursery nurse, physician or educator specialising in young children. Daycare for 0 to 6 year-old, but distinction by age is unknown.
‐ Kindergartens act as alternatives to nursery schools and take in children from 2 to 6 years old.
‐ Toddler daycare (between infant daycare and Kindergarten) act as alternatives to nursery schools and take in children from 2 and 3 years old.
‐ Day nurseries are facilities providing occasional or part-time daycare for children under six years old. ‐ Multiple care types facilities are institutions providing combinations of regular/occasional and
family/collective daycare services.
‐ Practising child minders are those registered by the Local Authority (Conseil général) and actually in activity. They provide daycare by the day for children between 0 and 6 years old, but usually between 0 and 3 years old. Their intake capacity depends on the number of children covered by their accreditation, to a maximum of four children each. Such child minders do not necessarily take in as many children as they are authorised to do; the total number of children actually taken care of is unknown.
Coverage: Metropolitan France.
Sources: Drees (PMI 2012 survey), Insee (estimates of population - provisional results established at end 2013), Ircem (Practising child minders).
Taking into account the age ranges covered by each type of daycare facility along with practising child minders, overall potential is around 24.4 places per 100 children between 0 and 6 years old. However, if only children under three years old are taken into consideration, the various modes of daycare currently on offer provide 57,4 places per 100 children.
Table 30 • Percentage of children under 3 years old entrusted primarily to a “formal” mode of daycare provision
In % 2002 2007 Percentage of children under 3 years old primarily entrusted to a “formal” mode
of daycare* 23 29
* Collective daycare facilities (excluding kindergartens), family crèches, and child minders paid by private individuals (including home daycare)
Note: Primary daycare mode is the one in which the child spends most of the time from Monday to Friday between 8 a.m. and 7 p.m.
Coverage: Metropolitan France
Sources: “Modes de garde et d’accueil des jeunes enfants” survey (Patterns of child minding and daycare provision), 2002 and 2007, DREES, calculations by DREES.
VI - Exploiting job creation policies
Table 31 • Total employment growth in 2013Level at the end of the
year
Year-on-year change at the end of
the year Year-on-year change at the end of the year (in
thou-sands) (in thousands) (in %)
2013 2008 2009 2010 2011 2012 2013 2008 2009 2010 2011 2012 2013 Total employment. including: 26 373 -167 -212 150 125 -51 10 -0.6 -0.8 0.6 0.5 -0.2 0.0 Agricultural employees 239 -10 -2 -4 4 4 10 -4.0 -0.8 -1.6 2.0 1.6 4.4 Mainly non-agricultural market sectors 15 895 -187 -262 58 59 -106 -62 -1.1 -1.6 0.4 0.4 -0.7 -0.4 Industry 3 175 -79 -167 -85 -17 -28 -53 -2.2 -4.7 -2.5 -0.5 -0.9 -1.6 Construction 1 392 10 -39 -18 -9 -18 -26 0.7 -2.6 -1.2 -0.6 -1.3 -1.8 Tertiary market sector 11 328 -119 -55 161 85 -59 17 -1.1 -0.5 1.4 0.8 -0.5 0.1 Of whom. temporary workers 545 -134 -18 99 -21 -61 34 -20.8 -3.4 19.9 -3.6 -10.7 6.6 Mainly non-market services sectors 7 667 14 46 4 7 22 42 0.2 0.6 0.1 0.1 0.3 0.5 Self-employed 2 572 16 5 91 54 30 20 0.7 0.2 3.8 2.2 1.2 0.8 Employment in the competitive 17 871 -154 -213 105 74 -83 -42 -0.8 -1.2 0.6 0.4 -0.5 -0.2
Interpretation: at the end of 2013, the level of employment in the industry was equal to 3 238 000, a decrease of 53 000 in comparison with end 2012 (-1.6 % in one year).
Concepts: synthesis of administrative sources on employment; employment in the competitive sector is made up of wage employment in the mainly non-agricultural market sectors and wage employment in the private non-market service sectors.
Coverage: Metropolitan France.
Source: Insee, employment estimations for 2007 to 2012 and estimations of wage employment in private institutions not including agriculture for 2013; employment forecasts for 2013, for the agricultural sector, the public sector and self-employment.
In 2006 and 2007, net job creation was important, exceeding 300 000 for each year. With the sharp decline in the economic situation, employment decreased from the 2nd
quarter of 2008 onwards. In 2009, job losses reached -212 000 posts after -167 000 posts in 2008. Temporary employment and industry were the most affected: respectively 153 000 and 245 000 jobs have been destroyed during these two years.
Total employment is rising again since the 4th quarter of 2009: 150 000 jobs were
created in 2010 and 98 000 new jobs between the end of 2011 and the 1st semester of
2012. Then employment returned to a downward trend from the 3rd quarter of 2012
(-51 000 jobs during the year despite a rise of +52 000 on the first semester) to the 3rd
quarter of 2013. The upturn observed on the 4th quarter compensated for the loss at the beginning of the year (+10 000 on the whole year, of which +59 000 on the last quarter).
The upturn of total employment in 2013 was supported by tertiary non market sectors mainly (+42 000), in relation to the development of subsidised jobs and, to a lesser extend, by self employment (+20 000). By contrast in the market sectors, jobs were destroyed faster in the industry (-53 000) and construction sectors (-26 000). In the services sectors, job creation started again thanks to temporary agency work (+34 000), while wage employment excluding temping stayed oriented on a downward trend
(-17 000).
VII - Gender equality
Table 32 • Employment gender gap in 2013
In % 20 to 64
years 20 to 24 years 25 to 54 years 55 to 64 years
Men 73.7 50.7 85.2 48.4
Women 65.6 43.4 76.3 43.1
Gender gap 8.1 7.3 8.9 5.3
Concepts: workforce occupied as defined by the ILO, exact age at date of survey, annual average. Coverage: Population of households in Metropolitan France.
Source: Labour Force Surveys, Insee, processed by Dares; provisional data for 2013.
In 2013, the employment rate gap between men and women aged between 20 and 64 stood at 8.1 points (73.7% as against 65.6%). Overall, with the continued development of female activity, women’s employment rate has been getting closer to men’s. Furthermore, from 2008 to 2009, the employment rate fell more strongly for men than for women, sectors most affected by the crisis (industry, construction and temping) being male dominated. From 2011 to 2012, the evolutions have been similar. In the last years, in contrast to what happens for the whole population, the employment gap has increased for youth (2009 to 2012) and for seniors (2010 to 2012) because of specific factors: longer schooling and apprenticeship for youth and removal of early retirement public measures and pension reforms for elders.
Table 33 • Gender pay gap
Comparison of average net salaries for women with average net salaries for men, by full time equivalent
2000 2004 2005 2006 2007 2008 2009 2010 2011 Ratio
women/men 0.78 0.79 0.79 0.79 0.79 0.79 0.80 0.80 0.81
Coverage: France, private sectors and public enterprises, all salaried workers excluding agriculture, employees of households, apprentices and interns.
Sources: annual declaration of social data (DADS), Insee, processed by Dares.
Gender pay gap has decreased since 2000. For the 2007-2011 period as a whole, the average net monthly salary for women is 20 % lower than for men.
Methodology: Dares decided to change its gender pay gap indicator. From now on,
it is calculated according to annual declaration of social data (DADS), a comprehensive data source much more accurate regarding wages than the sample of the Labor Force Survey (LFS), which was used before. Effects of part-time work are corrected because the indicator calculates average salaries by full time equivalent (FTE): it is therefore similar to the former “net hourly salaries” indicator from the LFS, apart from the fact that it is an average, not a median, with larger coverage, explaining a deeper gender pay gap than the former indicator. Indeed, this new indicator covers the entire France, including overseas departments.