HAL Id: cea-03192840
https://hal-cea.archives-ouvertes.fr/cea-03192840
Submitted on 8 Apr 2021
HAL is a multi-disciplinary open access
archive for the deposit and dissemination of
sci-entific research documents, whether they are
pub-lished or not. The documents may come from
teaching and research institutions in France or
abroad, or from public or private research centers.
L’archive ouverte pluridisciplinaire HAL, est
destinée au dépôt et à la diffusion de documents
scientifiques de niveau recherche, publiés ou non,
émanant des établissements d’enseignement et de
recherche français ou étrangers, des laboratoires
publics ou privés.
Development of an analysis method of minor uranium
isotope ratio measurements using electron multipliers in
Thermal Ionization Mass Spectrometry
Alexandre Quemet, Melody Maloubier, Vincent Dalier, Alexandre Ruas
To cite this version:
Alexandre Quemet, Melody Maloubier, Vincent Dalier, Alexandre Ruas. Development of an analysis
method of minor uranium isotope ratio measurements using electron multipliers in Thermal
Ioniza-tion Mass Spectrometry. InternaIoniza-tional Journal of Mass Spectrometry, Elsevier, 2014, 374, pp.26-32.
�10.1016/j.ijms.2014.10.008�. �cea-03192840�
Development of an analysis method of minor uranium isotope ratio measurements using electron multipliers in Thermal Ionization Mass Spectrometry
Alexandre Quemet*, Melody Maloubier, Vincent Dalier, Alexandre Ruas
CEA, Nuclear Energy Division, RadioChemistry & Processes Department, F-30207 Bagnols sur Ceze, France
* Corresponding author. E-mail address: alexandre.quemet@cea.fr (A. Quemet)
Keywords: TIMS; uranium; isotope ratio; electron multipliers
Abstract:
A simple analytical procedure was developed to measure with high accuracy the isotope ratio of minor isotope of natural uranium present in small quantities using a thermal ionization mass spectrometer (TIMS). The reduction of quantities used for analysis and the measurement of non-abundant isotopes are of prime interest in the nuclear industry. Indeed it is necessary to reduce the analyst received dose and the effluent released, as well as realizing measurement at trace level. The new generation of TIMS is equipped with a multicollection system of electron multipliers: discrete dynode electron multiplier (SEM) and continuous dynode electron multiplier (MIC), that improve the sensitivity compared to faraday cups. The procedure developed was verified using Certified Reference Material IRMM 052. Results were evaluated relying on NF T 90-210 norm regarding method validation. First, the isotope ratio 234U/238U was examined by total evaporation using the SEM and MIC to measure 234U and the faraday cup to measure 238U. In a second approach, the isotope ratio 235U/238U was studied by total evaporation using the SEM to measure 235U and the faraday cup to measure 238U. The classical method with peak-jumping SEM measurement was also used. Total evaporation method employing only the faraday cup was used to confront the results obtained. The analyzable quantity was reduced from 250 ng to 50 ng for the 235U/238U isotope ratio and from 1270 ng to 50 ng for the 234U/238U isotope ratio with acceptable uncertainties thanks to the use of electron multipliers. For all experiments were the accuracy was achieved, the calculated uncertainties were below to 0.28 % for the 235U/238U isotope ratio and 5 % for the 234U/238U isotope ratio.
I. Introduction
The determination of isotope ratio with high accuracy is very important for different applications such as: environmental, geological, forensics or in the nuclear industries. The natural isotopic composition of an element is affected by the geological history, the age and the water permeability of the mineral. The knowledge of such characteristic is useful to identify and understand the processes affecting an element, and determine the ages of the minerals.[1,2] The interpretation of the isotopic composition of uranium (both natural and enriched) is of prime interest for the International Atomic Energy Agency (IAEA) for monitoring nuclear installations in order to verify the material conformity to the nuclear grade specification, to identify material origins and to control the nuclear activities.[1,3–7] Uranium mineral has an isotope ratio 235U/238U relatively constant whatever its origin.[1] In the nuclear field, the modification of this isotope ratio gives information about the enrichment level of nuclear material. The safeguard authorities requirement for 235U abundance measurement uncertainty by TIMS is set to 0.28 %.[8] The isotopic abundance of234U provides information about the type of activities conducted in the nuclear installations: enrichment or reprocessing.[3,9] However, 234U stays a minor isotope with an isotopic abundance below 0.1 % whatever its origins: enriched uranium, spent nuclear fuel, reprocessed uranium or depleted uranium. Moreover, the reduction of the analyzable quantities is important to realize environmental measurement where uranium is present at trace level. Finally in the nuclear industry the reduction *Revised Manuscript
of the analyzable quantities reduces the radioactive effluent generated and the exposure to the sample radiation by the analyst.
Thermal ionization mass spectrometry (TIMS) is a reference technique for uranium isotope measurement. [9–15] TIMS allows measurement of isotope ratio with high trueness and precision, allowing the knowledge of isotope ratio with an uncertainty sometimes lower than 0.1 %.[10,11,13,16–18] The sample measurement with a low quantity of analyte or the isotope detection with low abundance (less than 0.1 %) is very challenging due to the low intensity of the ion bean affecting the measurement trueness and precision. This is a reason why some methods and technologies have been developed in order to improve sensitivity, accuracy or detection.
The major development for the low quantities measurements is the use the electron multipliers.[9,13–15,18,19] They are used to further extend the sensitivity of the instrument by several orders of magnitude. It is useful for the minor isotope ratio determination or for low quantities of analyte. These types of detector operate by converting the ions hitting the detector into secondary electrons, which are amplified then detected. Multiple ion counting can be done with discrete dynode electron multipliers (secondary electron multiplier) or with continuous dynode electron multipliers (channel electron multipliers or Channeltron) or a combination of both. Due to their small size, these detectors can be moved, which improves the isotope measurement. Indeed, it is possible to perform static measurements.[17,20]
After a brief description of the TIMS’s detector optimization, the results obtained for the 235U/238U and 234U/238U isotope ratio will be discussed in term of measurement trueness and precision. Different configurations using discrete and continuous dynode electron multipliers were studied in order to determine the best and most simple analytical method. Several quantities of uranium were investigated to challenge the limits of the different configurations. Each configuration was compared to the use of the faraday cups (FC) only.
II. Experimental 2.1. Reagent
All solutions were prepared in 8 M nitric acid (Merck suprapur). This 8 M nitric acid solution was prepared by diluting high purity nitric acid with deionized water (resistivity 18.2 M .cm).
2.2. Certified reference materials
To calibrate the electron detectors, uranium CRM U500 standard solution obtained from the National Institute of Standard and Technology (NIST) at 0.96 µg/µL (± 5%, k = 2) was used. This standard solution has a 234U isotopic abundance (0.5181 % ± 0.0008) higher than natural uranium, necessary to obtain of an adequate intensity for the 234U isotope.
The assessment of the investigated procedure was carried out on the certified reference material IRMM 052. This solution is certified for the following isotope ratios: 235U/238U (0.0072718 ± 0.0000030, k = 2), 234U/238U (0.00005548 ± 0.00000022, k =2) and 236U/238U (0.000000151 ± 0.000000045, k = 2). The initial solution concentration was 1.2711 g.kg-1 (± 0.05%, k = 2). Solutions of 250, 100, 50, 30, 20, 10, 3 and 1 ng/µL (± 5%, k = 2) were prepared from the IRMM 052 standard in 8 M nitric acid. Dilutions were performed gravimetrically with a high precision balance.
2.3. Instrumentation
Isotope measurements were performed on a Thermo Scientific Triton Thermal Ionization Mass Spectrometer, equipped with a glove box. The analyzer is a low resolution magnetic field (resolution around 400). The multicollector is equipped with 7 movable Faraday cups, a fixed discrete dynode Secondary Electron Multiplier (hereafter referred to as SEM), located behind the central faraday cup, and 3 movable continuous dynode electron multipliers operated in ion counting mode (hereafter referred to as MIC, abbreviation of Multi-Ion Counting). Faraday cups are equipped with high-ohmic resistors (1011 ). The SEM is combined with a RPQ retardation filter to improve the abundance sensitivity to about 10 ppb at mass M compared to mass M+1 or M-1.
Uranium samples were loaded onto the outgassed zone of a refined Re filament. A double Re-filament configuration was used to control independently the evaporation and the ionization temperature. These filaments, provided by ATES, are obtained from a 99.995% pure Re metal. 1 µL of diluted solutions (described in section 2.2) was deposited onto the filament. After deposition, the sample preparation was dried with a 0.5 A current. Then the current was progressively increased to 2 A over 10 s.
2.4. Detectors optimization
Intercalibration gains of the faraday cup detectors were measured daily by an automatic process.[21] The gains were extremely stable with a repeatability lower than 0.001%. Baselines were measured before each intercalibration gain and before each analysis.
For the SEM and the MIC, one of the major sources of uncertainty is the dead time, which is the time interval required between the impact of two ions to identify each ion as an independent event.[2] The dead time of each detector was implemented by the manufacturer. It was set up at 24 ns for the SEM and 70 ns for the MIC. For the SEM and the MIC, two parameters have to be measured before starting an analysis: the dark noise and the intercalibration gain. The process of the calibration is schematized in Figure 1.
In the first place, dark noise measurements were performed with the isolation valve closed for the SEM and the MIC. Each measurement takes about 10 minutes with an integration time set at 1 sec. A dark noise level lower than 7 cps was observed for the SEM and the MIC. In practice the dark noise level measurement was also realized before each measurement, analysis or intercalibration.
In order to measure SEM/FC or MIC/FC intercalibration gains, 400 ng of the certified reference material U500 was deposited in order to obtain adequate intensity on 234U+: 1.5 mV for the MIC and 5 mV for the SEM, and to measure the corresponding yield, given by the following formula:
100 10 . 6 , 1 / (%) / 8 FC MIC SEM I I Yield (1)
With ISEM/MIC the ion beam intensity obtained with the SEM or the MIC, and IFC the ion beam intensity obtained with the faraday cup.
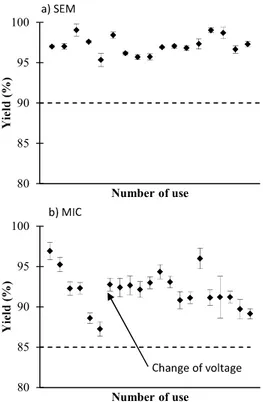
Electron multipliers have a limited lifespan which is an important performance parameter. It is common for the yield to decrease after several utilizations, requiring periodic voltage adjustments to obtain the adequate performance. Varying this voltage across the device alter the number of secondary electrons produced per strike. A minimum yield of 90 % for the SEM and 85 % for the MIC must be obtained prior to the beginning of the analysis. When the yield was too small, the voltage of the detector was increased in order to reach a yield higher than 90 % for the SEM and 85 % for the MIC.
For the SEM/FC intercalibration, a method implemented within the TIMS software was used. The ion beam was measured alternatively 10 times on the central faraday cup and the SEM with an integration time of 8.389 seconds and 2.097 seconds, respectively. Several intercalibration gains were performed for the SEM (Figure 2). It was relatively stable over time: the average of all intercalibration gains was 97.2 ± 1.1 %. The detector voltage was unchanged during this study. However, the yield could change up to 2 % during a same day without any trend observable. To minimize the impact of the detector yield variation on the analysis, the intercalibration gain was realized before and after each measurement. Then, the measurement was corrected by the average of these two intercalibration gains.
In opposition to the SEM/FC intercalibration, no automatic procedure was available on the TIMS software to evaluate the MIC/FC yield. A procedure was developed to obtain the MIC/FC intercalibration gain. Data were acquired in peak-jumping collection mode with two measurements sequences. During the first sequence, 234U isotope was measured over 2.097 s on the MIC. In the second sequence, the 234U isotope was then measured over 4.194 s on the central faraday cup. The measurement sequences were repeated 10 times. Gains were calculated
with equation (1). A yield diminution from 97 to 87 % was observed during the experiments (Figure 2) after approximately twenty analyses. The detector voltage was then increased in order to obtain a yield up to 90%. Finally, the MIC/FC intercalibration gain was realized before and after each measurement, and the measurement was corrected by the average of these two intercalibration gains. The yield of the MIC was less stable than the one of the SEM (Figure 2): the average of all the intercalibration gains before the change of voltage was 92.1 ± 3.7 % and after the change of voltage was 92.0 ± 1.7 %.
2.5. Measurement method
2.5.1. Classical method
In the classical or traditional method, the different isotopes are collected in a limited period of the sample evaporation. The isotope ratios are then corrected of the mass fractionation, the main cause of the measurement bias,[22,23] by using an internal or external normalization. This method is available in single or multi collection mode.[18] In single collection or peak-jumping measurement, the different isotopes are successively introduced into the same detector by a variation of the magnetic field. This procedure eliminates the dependence of the current amplifier gains and the Faraday cup efficiencies. In multi collection or static measurement, the ions beams reach simultaneously the different detectors that overcome the fluctuation of the ions beams. The knowledge of the gain of each detector is required before the measurement.
Measurements in peak-jumping mode with the classical method were performed for the 235U/238U ratio with the SEM. The mass cycle for uranium isotopes in a peak-jumping SEM detector measurement was performed in two sequences. During the first sequence, the 235U isotope was measured for 4.194 s on the SEM and in the second sequence the 238U isotope was measured for 4.194 s on the SEM as well. An idle time was fixed at 1 s. Examples of target intensities are shown in supplementary materials. Each measurement corresponded to 8 blocks of 10 cycles. Mass fractionation was corrected using the mass fractionation factor determined with the certified reference material U500 analyzed in the same condition.
2.5.2. Total evaporation
The total evaporation method is based on the evaporation and ionization of the entire sample.[22] Therefore the ion beam of the element is totally collected by a multi-collection system. This method was developed in order to overcome the mass fractionation. Other significant advantages can be noted: sample quantities reduction and improvement of the accuracy.[10,16] The total evaporation method is composed of three steps: adjustment, acquisition and shutdown.[10,16,23]
The adjustment phase was the same for all measurements using the total evaporation method. First, detectors were moved in order to collect uranium isotopes. Then the ionization filament was heated to a filament current of 4.5 A in 10 min. The ionization filament temperature was adjusted in order to obtain a 20 mV signal on 187Re+ ion beam. The 187Re+ ion beam from the ionization filament was then used to realize a “peak center” (mass calibration and ions beam centering in the detector) and to optimize the lens of the ion source: “focus setting” and “Z-focus”. The ionization filament temperature was then adjusted to a 80 mV signal on the 187Re+ ion beam. Next, the evaporation filament was heated to obtain a 238U+ ion beam of 1 mV. Peak center, focus setting and Z-focus were optimized using uranium isotope 238U+. Electronic baselines were then measured prior to data acquisition. When the data acquisition started, the evaporation filament current started to increase until the ion beam intensity of uranium isotopes reached the target intensity. This intensity was set by the operator. The target isotope and the optimized target intensities, depending on the uranium quantity and the type of detector, are presented in supplementary materials. The evaporation filament was then controlled to keep the ions beam intensity constant, by increasing the evaporation current when necessary. When the evaporation filament current reached a maximum value of 5 A and the ion beam decreased down to a 6 mV signal, the data acquisition was then terminated.
2.6. Methods evaluation
The results were evaluated relying to the NF T 90-210 norm regarding method validation.[24] This evaluation aims at studying the method accuracy by evaluating measurement trueness and precision. A maximal bias (MB)
was defined by the Laboratory of Analysis and Materials Metrology (LAMM) according to its requirements and the IAEA requirements.[8] This maximal bias (MB) was fixed to 0.28 % when isotope ratio involved 2 major isotopes (238U and 235U) and 5 % when isotope ratios involved a minor isotope (234U).
For each method and each uranium quantity, five independent determinations were realized. Bias, or measurement trueness, of the method was calculated with the following formula:
100
(%)
ref
ref
Z
Bias
(2)Where Z is the average of the series and ref is the certified value of the reference.
The precision control consisted in checking the repeatability, given by the relative standard deviation (RSD). Finally, the accuracy control (i.e. measurement trueness and precision) consisted in checking that the value obtained was within the limits defined by the laboratory. The method is validated in term of accuracy when the following inequality is verified:
MB
s
ref
Z
2
(3)Where s is the standard deviation of the series.
For the determination of measurement uncertainty, the normalized bias (NB) was calculated:
2 2 ref
u
s
ref
Z
NB
(4)Where uref is the uncertainty at k = 1 of the reference value.
When the normalized bias is below to 2, the observed bias is considered statistically negligible compared to and the uncertainty of the reference value uref must be taken into account in the final uncertainty calculation.[24] In this case, the following formula is used for the determination of the uncertainty (U) at k = 2:
2 2
2 s uref
U (5)
If the normalized bias is beyond to 2, a correction of the bias and the integration of this error in the final uncertainty is necessary.[24] In other words, equation (5) cannot be applied.
III. Results and discussion
Uranium isotope measurements have been performed both by the total evaporation method and the classical method with quantities varying from 1270 ng down to 1 ng. Five measurements were performed for the different quantities and methods. Table 1, Table 2 and Figure 3 report the results obtained for the 234U/238U and 235U/238U isotope ratio for each deposited quantity.
3.1.234U/238U isotope ratio measurement
3.1.1. Total evaporation with faraday cup
234U/238U isotope measurements have been performed by total evaporation method using the faraday cup to measure both 234U and 238U. The measurement trueness for a quantity of 1270 ng (1.1 %) and 250 ng (1.3 %) was lower than 5 %. However a degradation of the precision was observed for a deposit of 250 ng (RSD = 4.5 %) compared to a deposit of 1270 ng (RSD = 0.7 %). For a quantity of 250 ng, the signal obtained at m = 234 uma was in the limit of detection range of faraday cups, which is consistent with the observation of the precision
deterioration. Finally, the control of the accuracy (inequality (3)) showed that the method was only validated for 1270 ng.
3.1.2. Total evaporation using SEM (234U) and faraday cup (238U)
In order to improve the accuracy on the 234U/238U ratio, measurements have been performed by the total evaporation method using the SEM to measure 234U and the faraday cup to measure 238U. For uranium quantities from 1270 ng down to 10 ng, the measurement trueness and RSD were lower than 5 %. A degradation of the measurement trueness (1.5 %) and precision (RSD = 2.1 %) was observed for a 10 ng uranium deposit compared to larger quantities: for instance a measurement trueness of 0.2 % and a precision of 0.3 % were measured for a 50 ng deposit. As a consequence, the method accuracy was validated for uranium quantities between 50 and 1270 ng.
3.1.3. Total evaporation using MIC (234U) and faraday cup (238U)
In order to compare the performance of the SEM and the MIC, the same experiment as in section 3.1.2 was performed using the MIC to measure 234U. Results were similar to the ones obtained with the SEM. The measurement trueness and RSD were lower than 5 % for uranium quantities from 1270 ng down to 10 ng. The method was only validated in term of accuracy for uranium quantities from 1270 ng down to 50 ng. Indeed, a degradation of the measurement trueness and precision was observed for a uranium quantity of 10 ng which rendered the method inaccurate for such quantity.
3.2.235U/238U isotope ratio measurement
The measurement obtained with the SEM and the MIC in section 3.1 showed comparable results. However, contrary to the MIC, an automatic procedure for the intercalibration gain performance was incorporated in the software for the SEM, making the use of the latter detector more straightforward. Therefore, in this section, the isotope measurement using electron multipliers were only realized with the SEM.
3.2.1. Total evaporation with faraday cups
235U/238U isotope measurements have been performed using the total evaporation method with faraday cups for uranium quantities varying from 1270 ng down to 10 ng (five measurements for each quantity). The measurement trueness for a quantity of 1270 ng (0.10 %), 250 ng (0.01 %), 100 ng (0.10 %) and 50 ng (0.22 %) was less than 0.28 %. For a 10 ng quantity the measurement trueness increased to 1.38 %. A degradation of the repeatability was observed for the lowest amounts of sample. The residual standard deviation of 1270 ng (0.06 %), 250 ng (0.10 %), 100 ng (0.14 %) and 50 ng (0.45%) was calculated. Due to the degradation of the precision for the quantity of 100 ng, the method was inaccurate for this quantity. The method was validated for uranium quantities from 1270 down to 250 ng.
3.2.2. Total evaporation using SEM (235U) and faraday cup (238U)
235U/238U isotope measurements have been performed by total evaporation method using the SEM to measure 235U and the faraday cup to measure 238U. Uranium quantities ranged from 50 down to 10 ng. For a deposit quantity of 50 ng, the measurement trueness of the method was lower than 0.28 % and increased for lower quantities of uranium (> 0.5 %). However, the repeatability, 0.92 % for 50 ng, was important. Thereby, for a maximal bias equal to 0.28 %, the method accuracy was not validated for all the experiments to measure the 235U/238U ratio using SEM and faraday cup. In fact, the intensity detected on the faraday cup for the 238U isotope was too small (< 300 mV), deteriorating the stability of the signal, especially the repeatability of the measurement. To conclude, the simultaneous use of faraday cup and SEM for the detection of the major ratio 235U/238U was not suitable to significantly improve the results.
3.2.3. Classical method with peak-jumping SEM measurement 235
U/238U isotope measurements have been performed by the classical method using the peak-jumping measurements and the SEM to measure 235U and 238U. The measurement trueness and the repeatability was lower
than 0.28 % for uranium quantities of 50 ng (measurement trueness = 0.03 %, RSD = 0.11 %). For smaller uranium quantities (10 ng, 3 ng and 1 ng), the measurement trueness (0.03 %, 1.08 % and 42 %) and the repeatability (0.34 %, 2.05 % and 95 %) increased too much, more than 0.28 %, to validate the method. Finally, the control of the accuracy showed that the method was only validated for 50 ng.
3.3. Uncertainty
For all experiments, the normalized bias was lower than 2 (see supplementary materials). In this case, the different enlarged uncertainties (k = 2) were calculated using formula 5 (Figure 3 and supplementary materials). For the deposit quantities and cup configurations which conducted to the validated method, the 234U/238U isotope ratio repeatability was between 0.2 % and 0.7 %. The IRMM 052 certified reference material had a relative uncertainty (k = 2) of 0.4 % for the 234U/238U ratio. Therefore the repeatability and the reference value uncertainty had an equivalent contribution to the final uncertainty.
The 235U/238U isotope ratio of the material is certified with a low uncertainty (relative uncertainty of 0.04 % at k = 2). Therefore, in the present case, the reference value uncertainty represented a minor part in the final uncertainty, and the repeatability represented the major component in the final uncertainty. The repeatability was between 0.06 % and 0.11 % for the different configurations where the accuracy was achieved (Table 2)
The relative uncertainties of the 235U/238U isotope ratio for the different configurations were between 0.12 % and 0.23 %. These values were in agreement with the international target value recommended by the IAEA (0.28 %).[8].
IV. Conclusion
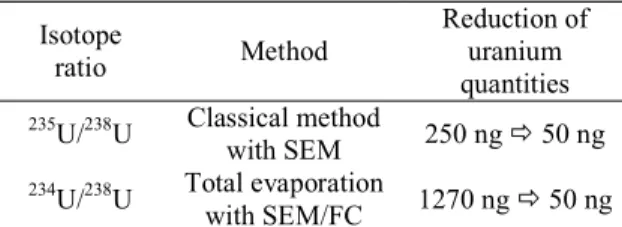
This study presents an analytical method to measure major and minor isotopes of natural uranium by TIMS using faraday cups, SEM and MIC. The 235U/238U and 234U/238U isotope ratios were studied in terms of measurement trueness, precision and accuracy according to the NF T 90-210 norm. The most effective methods, in term of accuracy and reduction of the analyzable quantities of uranium, to measure the 235U/238U and 234U/238U isotope ratios are summarized in the Table 3.
The minor isotope ratio 234U/238U was studied by total evaporation method using 3 different detector configurations: only faraday cups, SEM (234U) / faraday cup (238U) and MIC (234U) / faraday cup (238U). The analyzable quantity was reduced from 1270 ng down to 50 ng with an acceptable accuracy, thanks to the use of electron multipliers. Finally, the results obtained with the SEM were close to the ones obtained with the MIC. However, the straightforward use of the SEM and its stability conferred it an advantage when compared to the MIC.
The 235U/238U isotope ratio was studied by total evaporation method using 3 different detector configurations: only faraday cups, SEM (235U) / faraday cup (238U) and by the classical method using peak-jumping SEM measurement. The lowest analyzable quantity (50 ng) was achieved by peak-jumping measurement. Indeed, with the two others method, the intensity detected by the faraday cup was too small, lower than 300 mV and deteriorated the repeatability of the measurement. The method using only the faraday cups was accurate for uranium quantities between 250 ng and 1270 ng: the calculated uncertainties were below to 0.28 %, in agreement with the international target value recommended by the IAEA.[8] The use of electron multipliers (SEM) allowed to significantly decrease the analyzable quantities to 50 ng and respect the international target value as well.
Acknowledgements: We are grateful to S. Baghdadi (IRSN/PRP-Hom/SDI/LRC) for her precious advice on the present paper.
Bibliography
[1] E. Keegan, S. Richter, I. Kelly, H. Wong, P. Gadd, H. Kuehn, et al., The provenance of Australian uranium ore concentrates by elemental and isotopic analysis, Appl. Geochemistry. 23 (2008) 765–777. [2] M.E. Wieser, J.B. Schwieters, The development of multiple collector mass spectrometry for isotope ratio
measurements, Int. J. Mass Spectrom. 242 (2005) 97–115.
[3] S. Bürger, S.D. Balsley, S. Baumann, J. Berger, S.F. Boulyga, J.A. Cunningham, et al., Uranium and plutonium analysis of nuclear material samples by multi-collector thermal ionisation mass spectrometry: Quality control, measurement uncertainty, and metrological traceability, Int. J. Mass Spectrom. 311 (2012) 40–50.
[4] K. Mayer, M. Wallenius, I. Ray, Nuclear forensics--a methodology providing clues on the origin of illicitly trafficked nuclear materials., Analyst. 130 (2005) 433–41. doi:10.1039/b412922a.
[5] D.L. Donohue, Strengthening IAEA safeguards through environmental sampling and analysis, J. Alloys Compd. 271 (1998) 11–18.
[6] M. Wallenius, K. Mayer, I. Ray, Nuclear forensic investigations: Two case studies, Forensic Sci. Int. 156 (2006) 55–62.
[7] Z. Varga, M. Wallenius, K. Mayer, Age determination of uranium samples by inductively coupled plasma mass spectrometry using direct measurement and spectral deconvolution, J. Anal. At. Spectrom. 25 (2010) 1958–1692. doi:10.1039/c0ja00048e.
[8] Internaltional Atomic Energy Agnecy, International Target Values 2010 for Measurement Uncertainties in Safeguarding Nuclear Materials - STR368, Vienna, Austria, 2010.
[9] M. Kraiem, S. Richter, H. Kühn, Y. Aregbe, Development of an improved method to perform single particle analysis by TIMS for nuclear safeguards, Anal. Chim. Acta. 688 (2011) 1–7.
[10] E.L. Callis, R.M. Abernathey, High-precision isotopic analyses of uranium and plutonium by total sample volatilization and signal integration, Int. J. Mass Spectrom. Ion Process. 103 (1991) 93–105. [11] O.P. de Oliveira, W. De Bolle, S. Richter, A. Alonso, H. Kühn, J.E.S. Sarkis, et al., Evaluation of the
n(235U)/n(238U) isotope ratio measurements in a set of uranium samples by thermal ionization mass spectrometry, Int. J. Mass Spectrom. 246 (2005) 35–42.
[12] D. Suzuki, Y. Saito-Kokubu, S. Sakurai, C.-G. Lee, M. Magara, K. Iguchi, et al., A new method for isotope ratio measurement of uranium in trace amount by thermal ionization mass spectrometry: The continuous heating method, Int. J. Mass Spectrom. 294 (2010) 23–27.
[13] S.A. Goldberg, S. Richter, R. Essex, P. Mason, J. Schwieters, Iaea, Improved environmental and forensics measurements using multiple ion counters in isotope ratio mass spectrometry, Adv. Destr. Non-Destructive Anal. Environ. Monit. Nucl. Forensics. (2003) 155–164.
[14] S. Richter, H. Kühn, Y. Aregbe, M. Hedberg, J. Horta-Domenech, K. Mayer, et al., Improvements in routine uranium isotope ratio measurements using the modified total evaporation method for multi-collector thermal ionization mass spectrometry, J. Anal. At. Spectrom. 26 (2011) 550. doi:10.1039/c0ja00173b.
[15] K.J. Mathew, G. O’Connor, A. Hasozbek, M. Kraiem, Total evaporation method for uranium isotope-amount ratio measurements, J. Anal. At. Spectrom. 28 (2013) 866–876. doi:10.1039/c2ja30321c.
[16] S. Wakaki, S.-N. Shibata, T. Tanaka, Isotope ratio measurements of trace Nd by the total evaporation normalization (TEN) method in thermal ionization mass spectrometry, Int. J. Mass Spectrom. 264 (2007) 157–163.
[17] S. Bürger, L.R. Riciputi, D.A. Bostick, S. Turgeon, E.H. McBay, M. Lavelle, Isotope ratio analysis of actinides, fission products, and geolocators by high-efficiency multi-collector thermal ionization mass spectrometry, Int. J. Mass Spectrom. 286 (2009) 70–82.
[18] S. Richter, S.. Goldberg, Improved techniques for high accuracy isotope ratio measurements of nuclear materials using thermal ionization mass spectrometry, Int. J. Mass Spectrom. 229 (2003) 181–197. [19] K.J. Mathew, G.L. Singleton, R.M. Essex, A. Hasozbek, G. Orlowicz, M. Soriano, Characterization of
uranium isotopic abundances in depleted uranium metal assay standard 115, J. Radioanal. Nucl. Chem. 296 (2012) 435–440. doi:10.1007/s10967-012-2060-z.
[20] S. Mialle, A. Quémet, A. Ponvienne, A. Gourgiotis, M. Aubert, H. Isnard, et al., The use of total evaporation method using Channeltron electron multipliers by thermal ionization mass spectrometry for europium isotope ratio measurements on picogram sample amounts, Int. J. Mass Spectrom. 309 (2012) 141–147.
[21] K.. Ramakumar, R. Fiedler, Calibration procedures for a multicollector mass spectrometer for cup efficiency, detector amplifier linearity, and isotope fractionation to evaluate the accuracy in the total evaporation method, Int. J. Mass Spectrom. 184 (1999) 109–118.
[22] J.C. Dubois, G. Retali, J. Cesario, Isotopic analysis of rare earth elements by total vaporization of samples in thermal ionization mass spectrometry, Int. J. Mass Spectrom. Ion Process. 120 (1992) 163– 177.
[23] R. Fiedler, Total evaporation measurements: experience with multi-collector instruments and a thermal ionization quadrupole mass spectrometer, Int. J. Mass Spectrom. Ion Process. 146 (1995) 91–97. [24] AFNOR, NF T90-210 norm : Water quality - Protocol for the intial method performance assesment in a
Table
Quantity (ng) 234U/238U Measurement trueness (%) RSD (%) Accuracy Total evaporation with faraday cup (234U and 238U)
1270 0.00005610 1.1 0.7 Valid 250 0.00005618 1.3 4.5 Not valid Total evaporation using SEM (234U) and faraday cup (238U)
1270 0.00005498 0.9 0.7 Valid
250 0.00005515 0.6 0.5 Valid
100 0.00005552 0.1 0.3 Valid
50 0.00005535 0.2 0.3 Valid
10 0.00005463 1.5 2.1 Not valid
Total evaporation using MIC (234U) and faraday cup (238U)
1270 0.00005542 0.1 0.3 Valid
250 0.00005572 0.4 0.4 Valid 100 0.00005575 0.5 0.3 Valid
50 0.00005535 0.2 0.2 Valid
10 0.00005466 1.5 1.9 Not valid
Table 1: 234U/238U isotope ratio results obtained with different methods and deposited amounts. For each determination five measurements have been performed (certified value: 0.00005548 ± 0.00000011). The
method is validated in term of accuracy when the inequality 3 is verified.
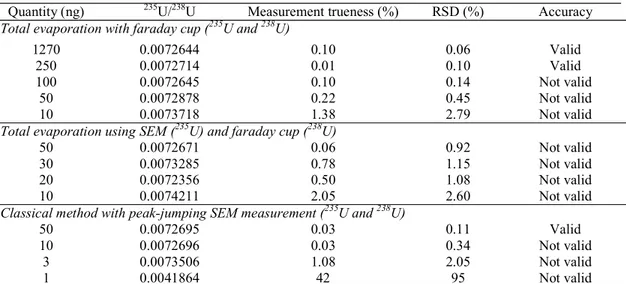
Quantity (ng) 235U/238U Measurement trueness (%) RSD (%) Accuracy Total evaporation with faraday cup (235U and 238U)
1270 0.0072644 0.10 0.06 Valid
250 0.0072714 0.01 0.10 Valid
100 0.0072645 0.10 0.14 Not valid 50 0.0072878 0.22 0.45 Not valid 10 0.0073718 1.38 2.79 Not valid Total evaporation using SEM (235U) and faraday cup (238U)
50 0.0072671 0.06 0.92 Not valid
30 0.0073285 0.78 1.15 Not valid 20 0.0072356 0.50 1.08 Not valid 10 0.0074211 2.05 2.60 Not valid Classical method with peak-jumping SEM measurement (235U and 238U)
50 0.0072695 0.03 0.11 Valid
10 0.0072696 0.03 0.34 Not valid 3 0.0073506 1.08 2.05 Not valid
1 0.0041864 42 95 Not valid
Table 2: 235U/238U isotope ratio results obtained with different methods and deposited amounts. For each determination five measurements have been performed (certified value: 0.0072718 ± 0.0000015). The
Isotope ratio Method Reduction of uranium quantities 235U/238U Classical method with SEM 250 ng 50 ng 234U/238U Total evaporation with SEM/FC 1270 ng 50 ng
Table 3: Summary of the most effective method for the 235U/238U and 234U/238U isotope ratio determination and the associated reduction of the uranium quantities in comparison to the method using total
Figure
Figure 1: Process for the electron multiplicators (MIC and SEM) calibration
Figure 2: Yield variation of the SEM (a) and the MIC (b) during the study
Adjustment of 234U on faraday cups Measurement of the dark noise < 10 cpm Measurement of the intercalibration gain Analysis
Increase of the voltage of the detector Change the detector
< 3000 V Yes No Yes No Yes No SEM: >90% MIC: >85% 80 85 90 95 100 Number of use 80 85 90 95 100 Number of use
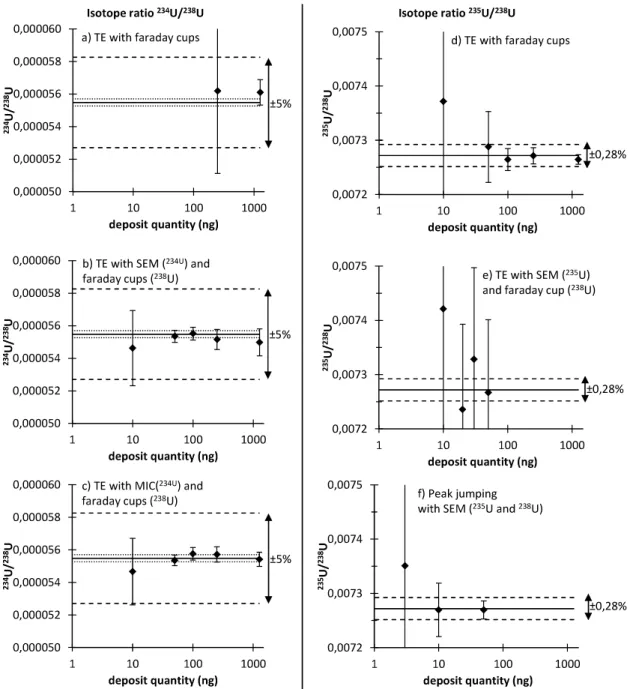
Figure 3: Results for 234U/238U isotope ratio measurements by total evaporation method using the faraday cups (a), the SEM (b) and the MIC (c) and results of 235U/238U isotope ratio measurements by total evaporation method using the faraday cups (d), the SEM (e) and by the peak-jumping SEM measurement
(f). Each point is represented with an uncertainty at k=2 (calculated according to equation 5. The dark line (-) corresponds to the reference value and the dotted line (…) represents its uncertainty at k = 2 (not represented for better clarity for the isotope ratio 235U/238U): 0.0072718 ± 0.00000030 for isotope
ratio 235U/238U and 0.00005548 ± 0.00000022 for isotope ratio 234U/238U. The prolonged dotted line (- - -) represent the maximal bias fixed by the laboratory