HAL Id: hal-01724272
https://hal.archives-ouvertes.fr/hal-01724272
Submitted on 6 Mar 2018
HAL is a multi-disciplinary open access
archive for the deposit and dissemination of
sci-entific research documents, whether they are
pub-lished or not. The documents may come from
teaching and research institutions in France or
abroad, or from public or private research centers.
L’archive ouverte pluridisciplinaire HAL, est
destinée au dépôt et à la diffusion de documents
scientifiques de niveau recherche, publiés ou non,
émanant des établissements d’enseignement et de
recherche français ou étrangers, des laboratoires
publics ou privés.
An ensemble learning approach to detect epileptic
seizures from long intracranial EEG recordings
Jean-Baptiste Schiratti, Jean-Eudes Le Douget, Michel Le van Quyen, Slim
Essid, Alexandre Gramfort
To cite this version:
Jean-Baptiste Schiratti, Jean-Eudes Le Douget, Michel Le van Quyen, Slim Essid, Alexandre
Gram-fort. An ensemble learning approach to detect epileptic seizures from long intracranial EEG recordings.
International Conference on Acoustics, Speech, and Signal Processing, Apr 2018, Calgary, Canada.
�hal-01724272�
AN ENSEMBLE LEARNING APPROACH TO DETECT EPILEPTIC SEIZURES FROM LONG
INTRACRANIAL EEG RECORDINGS
J.-B. Schiratti
1, Jean-Eudes Le Douget
2, Michel Le Van Quyen
2, Slim Essid
1, Alexandre Gramfort
1,31
LTCI, Tel´ecom ParisTech, Universit´e Paris-Saclay, 75013, Paris, France
2Bioelectrics lab, at Brain and Spine Institute (ICM), Paris, France
3
INRIA, Universit´e Paris-Saclay, Saclay, France
ABSTRACT
This paper proposes a patient-specific supervised classifica-tion algorithm to detect seizures in long offline intracranial electroencephalographic (iEEG) recordings. The main idea of the proposed algorithm is to combine a set of probabilistic classifiers, trained on a dataset of 1 s epochs, into a weighted ensemble classifier which can be used to analyze longer 5 s data segments. The method is trained and evaluated on 24 pa-tients, all suffering from focal medically intractable epilepsy, from the Epilepsiae database. The evaluation of the method, conducted using an average of 113 hours (min: 32 h, max: 229 h) of iEEG data per patient, shows that the proposed al-gorithm improves upon existing methods for seizure detection with iEEG.
Index Terms— Seizure detection, intracranial EEG, su-pervised learning
1. INTRODUCTION
Affecting approximately 1% of the world’s population, epilepsy is a chronic neurological disorder whose visible symptoms are recurrent seizures, a physical reaction to an excessive electrical discharge in the brain. Despite new treat-ments, in approximately 40% of the cases, epilepsy cannot be efficiently treated by medication. For these patients, re-sective surgery may be proposed as an alternative. It consists of an invasive treatment which aims at removing the seizure onset zone, the part of the brain responsible for the seizures. Prior to surgery, the localization of the epileptogenic zone is usually done using intracranial electroencephalography (iEEG) recordings from subdural strip, grid or depth elec-trodes. Several hours (or days) of EEG monitoring are often necessary. Later, the visual inspection of the (i)EEG records is a time-consuming and complex task during which a trained expert annotates the data by distinguishing between ictal and non-ictalbrain activity.
Methods and algorithms for the automatic detection of epileptic seizures are usually designed for scalp EEG or iEEG. Scalp EEG offers two advantages: it is not invasive and the position of the electrodes on the scalp is usually
comparable across individuals. For patients with pharma-coresistant epilepsy, iEEG is a more precise measurement - in terms of electrodes localization and signal quality - of brain activity close to epileptogenic regions. It is also less sensi-ble to eye or muscle artifacts. However, using iEEG for the detection of epileptic seizures remains challenging. Indeed, the position, type and number of electrodes may vary across patients and recording sessions. Also, in specific subtypes of epilepsy (especially focal epilepsy), the ictal activity may affect only a subset of the available electrodes.
The first methodological contributions to the problem of automatic seizure detection date back to the 1970s [1, 2]. In almost fifty years, contributions to this problem have focused on extracting relevant features (e.g., temporal, spectral) from the data and developing algorithms to discriminate between “ictal” or “non-ictal” data using a classifier. For a compre-hensive review of the features used in seizure detection algo-rithms, see [3, 4]. In [5], the authors proposed a 3-feature method to detect seizures using non-overlapping 2s segments of iEEG data recorded on two channels. The method was based on the discriminant analysis of the features. It was val-idated on a dataset of iEEG epochs equivalent to 1h of data for 8 patients and achieved a 90% − 100% accuracy and false positive rate (FPR) of 1/h. Later, Yadav et al. [6] proposed a patient-specific model which, when evaluated on 304 hours of single-channel iEEG recordings for 14 patients, reached 100% specificity (FPR=0/h) and 92.2% sensitivity. More re-cently, Grewal and Gotman proposed in [7] a seizure warning system which uses spectral features extracted from data fil-tered in different frequency bands. This system was validated on an iEEG dataset which consists of 389 hours of data for 19 patients and with 9 depth contacts. The authors report a sensi-tivity of 89.4% and a FPR of 0.22/h. With temporal, spectral and complexity features spatiotemporally integrated using a fuzzy rule-based system in [8], the authors obtained a 98.7% sensitivity and 0.27/h FPR on 302 hours of iEEG data for 21 patients. However, the method is tested on 6 channels previ-ously selected by an expert. Although the results reported in these contributions are remarkable, the proposed methods are often validated on iEEG data with a few selected channels.
Even for a trained clinician, selecting relevant channels in a large dataset, with multiple patients, can be a tedious task. In [9], a one-class Support Vector Machine (SVM) novelty detection reaches 97.1% sensitivity and 1.56/h FPR on ap-proximately 200 hours of data for 5 patients implanted with a number of grid or strip electrodes ranging from 20 to 34. In [10], the authors used the total energy of the data, filtered in 17 different frequency bands. Once extracted on 1 s epochs, the feature vectors of K = 3 consecutive epochs are con-catenated into a single “meta”-feature vector. These “meta” vectors are classified using a linear SVM with fixed parameter C = 1/1000. Concatenating the feature vectors on consec-utive epochs allows taking into account dynamical changes within the data. This method is evaluated on 875 hours of iEEG data from 10 patients. As opposed to other contribu-tions mentioned above, the full set of electrodes (from 34 to 114) was used. The authors report a 100% sensitivity on 8 patients out of 10 and an average FPR of 0.6 per 24 hours.
2. MATERIALS AND METHOD
This paper proposes a patient-specific supervised algorithm to detect seizures in iEEG recordings. As opposed to seizure warning systems, the detection is not done in real-time. Ideally, to automatically annotate long iEEG recordings in databases, one may want to process “long” data segments. However, given that the events we want to detect (seizures) can be relatively short (from 10s to several minutes), the duration of the data segments processed by our algorithm should be of the order of seconds. In the following, we chose to analyze 5 s data segments. Indeed, for all the patients considered in this work, the shortest annotated seizure was 12s long. Therefore, by analyzing 5 s segments, a seizure would consist of - at least - two consecutive epochs labeled as “seizure”. The proposed statistical learning algorithm con-sists of two main steps. The first step concon-sists in training a Logistic Regression (LR) classifier on a dataset of 1 s seg-ments using a nested cross-validation procedure. This step produces a set of trained LR classifiers which is later used in a second ensembling step. In this step, a dataset of 5 s segments is used to train a classifier which results from an ensembling of classifiers trained on the 1 s segments. Each 5 s data segment is divided in 1 s segments and probabilistic predictions on these 1 s segments are combined into a single prediction.
2.1. Recordings
The data used in this paper consists of data from the European multi-center EPILEPSIAE database [11]. A total of 253 pa-tients, with days of recordings, were included. Among these patients, 59 have iEEG recordings. For this work, we chose to consider a subgroup of 24 patients suffering from pharma-coresistant focal epilepsy and with a minimum of 2 annotated
seizures. For each patient, the data was recorded from depth, strip or grid electrodes, in at least two sessions called records. The sampling rate (from 256Hz to 1024Hz) and the number of electrodes (from 25 to 124) were different across patients but did not change across the records of a given patient.
Several methodological contributions to the problem of seizure prediction (classifying segments of data as either pre-ictalor interictal) have been proposed in the last decade [12, 13]. However, to the best of our knowledge, no seizure detec-tion algorithm was evaluated on this database.
2.2. Detection algorithm
Our seizure detection pipeline consists of five different stages: preprocessing, feature extraction, classification of 1 s seg-ments using a nested cross-validation procedure, classifi-cation of 5 s segments with an ensemble of classifiers and validation. This section presents the different steps of our method.
Data selection and preprocessings
For each patient, the records which contain at least 2 anno-tated seizures are used to train our algorithm whereas the other records (which might not contain annotated seizures) are used for the validation. The data is split into non-overlapping 1 s epochs. A linear detrend is applied to each epoch and the data is downsampled at 256Hz. An auto-matic rejection of epochs containing flat channels is used. No filtering or artifact rejection is applied. Each preprocess-ing is applied uspreprocess-ing MNE uspreprocess-ing the Python programmpreprocess-ing language [14].
In the following paragraph, we explain how the two datasets (1 s and 5 s segments) are created from the available records. For the second dataset, each 5 s data segment was epoched using a 1 s window with 50% overlap. Therefore, each 5 s data segment corresponds to nine 1 s epochs. Half of the available annotated seizures (complete seizures) was used for each dataset. Note that electrographic seizures (without clinical symptoms; visible only on EEG recordings) were not considered. The epochs falling inside an annotated seizure were labeled “seizure” (the positive class). For each dataset, the number of “non-seizure” samples (the negative class) was chosen to be 50 times the number of positive samples. In each case, non-seizure data segments were chosen randomly in non-annotated data. This method, which corresponds to subsampling the negative class, is a usually used to reduce the dramatic imbalance due to long recordings [15, 10]. Also, “non-seizure” samples are required to be at least one hour away from any seizure. This condition aims at ensuring that the samples of the negative class are actual interictal samples, not pre-ictal or post-ictal samples, and to avoid possible label noise affecting samples close to seizure onset/offset.
Feature extraction
A set of relevant time domain and frequency domain features is extracted from each epoch. The features which are com-puted electrode by electrode consist of: i) total energy of the data filtered in 18 frequency bands (from 0.5Hz to 35Hz with bandwidth of 3Hz and from 35Hz to 105Hz with 10Hz band-width) using a zero-phase filter similarly to [10] ; ii) decorre-lation time as well as Hjorth mobility and Hjorth complexity parameters [16] ; iii) the `2-norm of the approximation and detail coefficients obtained from a 6-levels Wavelet decom-position using a Daubechies db4 wavelet. The features also include correlation features which were used in the winning submissions to the Upenn and Mayo Clinic Seizure Detec-tion Challenge [17] as well as the American Epilepsy Society Seizure Prediction Challenge [18]. These features consist of the eigenvalues and the upper part of the correlation matrix, whose size equals the number of electrodes, computed either from the time series or from the power spectrum of these time series.
Classification of 1 s data segments
After the feature extraction, we used an implementation of Logistic Regression (LR) classifier with ElasticNet penalty from the Lightning Python module [19]. This choice of penalty allowed us to impose sparsity on the coefficients of the model and select relevant features. In the following, the weight of the `1 penalty term is fixed to 0.001. Only the weight of the `2 norm is optimized. The classifier was trained using the SAGA algorithm [20]. To avoid overfitting, the performance of the classifier on the dataset of 1 s epochs was evaluated using two nested levels of cross-validation. At the top level, a 10-fold cross-validation is used. For each split Xtrain, Xtest, the logistic regression classifier is wrapped in a GridSearchCV object (Scikit-Learn [21]) which uses an inner5-fold cross-validation. The GridSearchCV object, fit-ted on Xtrain, uses the inner cross-validation to estimate the “best” regularization parameter C using, as metric, the area under the Receiver Operating Characteristic (ROC) curve, ROC AUC score. This metric is usually used with imbalanced datasets as it does not suffer from class imbalance. Once fitted, the GridSearchCV object returns a “best estimator” (the LR with the optimal regularization parameter C) which is saved. This “best estimator” is used to make predictions on the test data Xtest from the outer cross-validation. The performance of this estimator is also evaluated using the ROC AUC score.
Ensembling step: classification of 5 s data segments The 10 fitted LR classifiers obtained from the previous step are combined into a single classifier, called Weighted Ensem-ble(WE) classifier, as follows. Recall that each 5 s data seg-ment corresponds to nine 1 s epochs. The j-th (1 ≤ j ≤ 10)
fitted classifier gives a probabilistic prediction pi,j ∈ [0, 1] that the label of the i-th epoch (1 ≤ i ≤ 9) is “seizure”. Weights (wj)1≤j≤10such thatPjwj = 1 are associated to the classifiers and the predicted probability that the i-th epoch is labeled with “seizure” is defined to be ˜pi=Pjwjpi,j. The weights (wj)1≤j≤10encode how much each of the fitted clas-sifiers contribute to values (˜pi)1≤i≤9. These weights are pa-rameters of the WE classifier. Eventually, the probability that a 5 s data segment is labeled with “seizure” is the arithmetic mean of (˜pi)1≤i≤9.
A 5-fold cross-validation procedure is used to evaluate the performance of this approach on the 5 s dataset. For each split Xtrain, Xtestof the data, Xtrain is used to estimate the opti-mal set of weights for the WE classifier. To obtain the op-timal set of weights, an implementation of Sequential Least SQuares Programming (SLSQP) is used to minimize the log loss between the true predictions (for the train data) and pre-dictions given (on each 5 s data segment) byP
1≤i≤9p˜i un-der the constraints that each weight belongs to (0, 1) and the weights sum to 1. Once fitted, the classifier is evaluated on Xtest. As above, the evaluation metric is the ROC AUC score. Results obtained on 5 s data segments with this WE clas-sifier are reported in Fig. 2. To confront our algorithm to a recently proposed method, we compared it our reimplemen-tation of the seizure detection algorithm described in [10]: a 5 s data segment is epoched using non-overlapping 1 s win-dows. On each 1 s epoch, only total energy features (in differ-ent frequency bands) are extracted from the data. The feature vectors corresponding to each of the five epochs are concate-nated into a single feature vector which is later classified us-ing a linear SVM with regularization parameter C = 1/1000, as suggested by the authors.
3. RESULTS
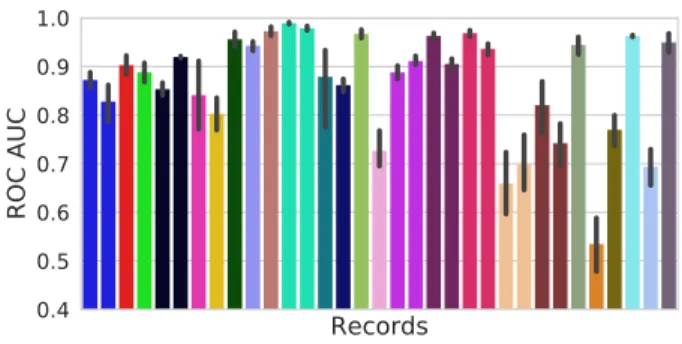
The results presented in Fig. 2 show that the average ROC AUC score of the WE classifier, evaluated using a 5-fold cross-validation described in Section 2.2, is almost prefect in most of the cases except for a single record. Comparing these results to the ones reported in Fig. 3 validates the idea that the ensemble method discussed in Section 2.2 actually allows for better predictive performance as opposed to a sin-gle LR model. Since our WE classifier is not coupled with an artifacts rejection method, the ensemble method failed on a single record for which high amplitude artifacts intro-duced many outliers among the extracted features. Fig. 2 also shows that for most training records, the variance of the ROC AUC score is also decreased. As mentioned above, the performance of the WE classifier is compared to a state-of-the-art algorithm for seizure detection in iEEG recordings. In Fig. 1, each dot above the solid black line represents a training record for which the WE classifier outperformed the algorithm described in [10]. It was the case in 29 training records out of 33. Still, the performance of both methods is
0.4
0.5
0.6
0.7
0.8
0.9
1.0
AUC (Kharbouch et al., 2011)
0.75
0.80
0.85
0.90
0.95
1.00
1.05
AUC (Weighted Ensemble)
Fig. 1: Scatter plot of the ROC AUC scores (averaged) ob-tained on record-specific datasets of 5 s data segments using a 5-fold cross-validation. The solid black line represents the straight line joining the point (0, 0) to (1, 1).
Records
0.4
0.5
0.6
0.7
0.8
0.9
1.0
ROC AUC
Fig. 2: ROC AUC scores (averaged) obtained on record-specific datasets of 5 s data segments using 5-fold cross-validation with the WE classifier. Each bar corresponds to an Epilepsiae record and adjacent bars of the same color cor-respond to records from the same patient.
evaluated on a dataset whose class imbalance is not realistic. Indeed, the comparison of these methods on unseen records is more meaningful.
Evaluation on complete left-out records
For each patient, the records which were not used for train-ing, “left-out records”, were used for evaluation. As the WE classifier, by design, outputs class probabilities, we chose to evaluate the performance of our method using the ROC AUC score. The validation of our method was conducted using 113 ± 48 hours of iEEG data. When the ROC AUC score is computed on each left-out record (with at least one annotated seizure), the ROC AUC score obtained with the WE classi-fier is 0.81 (±0.19), whereas the score is 0.62 (±0.28) for the algorithm from Kharbouch et al. By combining all the predicted probabilites from all left-out records, a single ROC AUC curve can be computed for each method. The area un-der this curves gives a measure of the overall performance of a given method. The results show that the WE classifier reaches
Records
0.4
0.5
0.6
0.7
0.8
0.9
1.0
ROC AUC
Fig. 3: ROC AUC scores (averaged) obtained on record-specific datasets of 1 s data segments using 5-fold cross-validation with the LR classifier.
a ROC AUC score of 0.87 whereas the ROC AUC score of the other method is 0.813.
4. DISCUSSION AND CONCLUSION
In this paper, we proposed a seizure detection algorithm which is designed to analyze 5 s data segments by combining prediction from classifiers fitted on a dataset of 1 s epochs. The results presented in this paper show that a weighted en-semble of LR classifiers outperforms a given state-of-the-art seizure detection algorithms on left-out records. However, a comparison with other state-of-the-art methods and perfor-mance metrics should enrich the evaluation of our method. Also, the influence (on the performance on left-out records) of the number of classifiers in the ensemble should be care-fully investigated. The results of the paper also show that the performance of the WE classifier may drop when applied on records with artifacts. Therefore, the WE classifier could be further improved by being coupled with an automatic artifacts rejection method. Note that the proposed method is flexible as it may be applied with any classifier that can predict class probabilities. Eventually, similarly to [13], the methodology presented in this paper could be used for seizure prediction, where one aims at classifying a segment of data as either preictal, ictal, postictal or interictal. Such a method could allow identifying pre-seizure states in (i)EEG data.
Acknowledgments
This work was supported by the MEDATALAB grant.
5. REFERENCES
[1] S. S. Viglione, V. A. Ordon, and F. Risch, “A methodol-ogy for detecting ongoing changes in the EEG prior to clinical seizures,” 21st western institute on epilepsy, pp. 27–28, 1970.
[2] S. S. Viglione and G. O. Walsh, “Proceedings: Epileptic seizure prediction.,” Electroencephalography and clini-cal neurophysiology, vol. 39, no. 4, pp. 435, 1975. [3] K. K. Jerger, T. I. Netoff, J. T. Francis, T. Sauer, L.
Pec-ora, S. L. Weinstein, and S. J. Schiff, “Early seizure detection,” Journal of Clinical Neurophysiology, vol. 18, no. 3, pp. 259–268, 2001.
[4] A. T. Tzallas, M. G. Tsipouras, D. G. Tsalikakis, E. C. Karvounis, L. Astrakas, S. Konitsiotis, and M. Tzaphlidou, “Automated epileptic seizure detec-tion methods: a review study,” in Epilepsy-histological, electroencephalographic and psychological aspects. In-Tech, 2012.
[5] A. M. Murro, D. W. King, J. R. Smith, B. B. Gal-lagher, H. F. Flanigin, and K. Meador, “Computerized seizure detection of complex partial seizures,” Elec-troencephalography and Clinical Neurophysiology, vol. 79, no. 4, pp. 330–333, 1991.
[6] R. Yadav, A. K. Shah, J. A. Loeb, M. N. S. Swamy, and R. Agarwal, “Morphology-based automatic seizure de-tector for intracerebral EEG recordings,” IEEE Trans-actions on Biomedical Engineering, vol. 59, no. 7, pp. 1871–1881, 2012.
[7] S. Grewal and J. Gotman, “An automatic warning system for epileptic seizures recorded on intracerebral EEGs,” Clinical neurophysiology, vol. 116, no. 10, pp. 2460–2472, 2005.
[8] A. Aarabi, R. Fazel-Rezai, and Y. Aghakhani, “A fuzzy rule-based system for epileptic seizure detection in in-tracranial EEG,” Clinical Neurophysiology, vol. 120, no. 9, pp. 1648–1657, 2009.
[9] A. B. Gardner, A. M. Krieger, G. Vachtsevanos, and B. Litt, “One-class novelty detection for seizure analysis from intracranial EEG,” Journal of Machine Learning Research, vol. 7, no. Jun, pp. 1025–1044, 2006. [10] A. Kharbouch, A. Shoeb, J. Guttag, and S. S. Cash,
“An algorithm for seizure onset detection using intracra-nial EEG,” Epilepsy & Behavior, vol. 22, pp. S29–S35, 2011.
[11] J. Klatt, H. Feldwisch-Drentrup, M. Ihle, V. Navarro, M. Neufang, C. Teixeira, C. Adam, M. Valderrama, C. Alvarado-Rojas, A. Witon, et al., “The epilep-siae database: An extensive electroencephalography database of epilepsy patients,” Epilepsia, vol. 53, no. 9, pp. 1669–1676, 2012.
[12] H. Feldwisch-Drentrup, M. Ihle, M. Le Van Quyen, C. Teixeira, A. Dourado, J. Timmer, F. Sales,
V. Navarro, A. Schulze-Bonhage, and B. Schelter, “An-ticipating the unobserved: Prediction of subclinical seizures,” Epilepsy & Behavior, vol. 22, pp. S119–S126, 2011.
[13] M. Valderrama, C. Alvarado, S. Nikolopoulos, J. Mar-tinerie, C. Adam, V. Navarro, and M. Le Van Quyen, “Identifying an increased risk of epileptic seizures us-ing a multi-feature EEG-ECG classification,” Biomed-ical Signal Processing and Control, vol. 7, no. 3, pp. 237–244, 2012.
[14] A. Gramfort, M. Luessi, E. Larson, D. A. Engemann, D. Strohmeier, C. Brodbeck, L. Parkkonen, and M. S. H¨am¨al¨ainen, “MNE software for processing MEG and EEG data,” Neuroimage, vol. 86, pp. 446–460, 2014. [15] A. Van Esbroeck, L. Smith, Z. Syed, S. Singh, and
Z. Karam, “Multi-task seizure detection: addressing intra-patient variation in seizure morphologies,” Ma-chine Learning, vol. 102, no. 3, pp. 309–321, 2016. [16] F. Mormann, T. Kreuz, C. Rieke, R. G. Andrzejak,
A. Kraskov, P. David, C. E. Elger, and K. Lehnertz, “On the predictability of epileptic seizures,” Clinical neuro-physiology, vol. 116, no. 3, pp. 569–587, 2005.
[17] A. Temko, A. Sarkar, and G. Lightbody, “Detec-tion of seizures in intracranial EEG: Upenn and mayo clinic’s seizure detection challenge,” in Engineering in Medicine and Biology Society (EMBC), 2015 37th An-nual International Conference of the IEEE. IEEE, 2015, pp. 6582–6585.
[18] B. H. Brinkmann, E. E. Patterson, C. Vite, V. M Vasoli, D. Crepeau, M. Stead, J. J. Howbert, V. Cherkassky, J. B. Wagenaar, B. Litt, et al., “Forecasting seizures using intracranial eeg measures and svm in naturally oc-curring canine epilepsy,” PloS one, vol. 10, no. 8, pp. e0133900, 2015.
[19] M. Blondel and F. Pedregosa, “Lightning: large-scale linear classification, regression and ranking in Python,” 2016.
[20] Aaron Defazio, Francis Bach, and Simon Lacoste-Julien, “Saga: A fast incremental gradient method with support for non-strongly convex composite objectives,” in Advances in Neural Information Processing Systems, 2014, pp. 1646–1654.
[21] F. Pedregosa, G. Varoquaux, A. Gramfort, V. Michel, B. Thirion, O. Grisel, M. Blondel, P. Prettenhofer, R. Weiss, V. Dubourg, J. Vanderplas, A. Passos, D. Cournapeau, M. Brucher, M. Perrot, and E. Duches-nay, “Scikit-learn: Machine learning in Python,” Jour-nal of Machine Learning Research, vol. 12, pp. 2825– 2830, 2011.