HAL Id: hal-01142012
https://hal.sorbonne-universite.fr/hal-01142012
Submitted on 14 Apr 2015HAL is a multi-disciplinary open access
archive for the deposit and dissemination of sci-entific research documents, whether they are pub-lished or not. The documents may come from teaching and research institutions in France or abroad, or from public or private research centers.
L’archive ouverte pluridisciplinaire HAL, est destinée au dépôt et à la diffusion de documents scientifiques de niveau recherche, publiés ou non, émanant des établissements d’enseignement et de recherche français ou étrangers, des laboratoires publics ou privés.
Structural stability of anhydrous proton conducting
SrZr0.9Er0.1O3-δ perovskite ceramic vs.
protonation/deprotonation cycling: Neutron diffraction
and Raman studies�
Aneta Slodczyk, Philippe Colomban, Settakorn Upasen, Frederic Grasset,
Gilles André
To cite this version:
Aneta Slodczyk, Philippe Colomban, Settakorn Upasen, Frederic Grasset, Gilles André. Struc-tural stability of anhydrous proton conducting SrZr0.9Er0.1O3-δ perovskite ceramic vs. protona-tion/deprotonation cycling: Neutron diffraction and Raman studies�. Journal of Physics and Chem-istry of Solids, Elsevier, 2015, 83, pp.85-95. �10.1016/j.jpcs.2015.03.025�. �hal-01142012�
Structural stability of anhydrous proton conducting SrZr0.9Er0.1O3-δ perovskite ceramic vs. protonation/deprotonation cycling: neutron diffraction and Raman studies
Running title: Structural stability of anhydrous SrZr0.9Er0.1O3-δ proton conducting perovskite
Aneta Slodczyka,b , Philippe Colombana,b* Settakorn Upasena,b, Frederic Grassetc and Gilles Andréd
a Sorbonne Universités, UPMC Univ Paris 06, UMR 8233, MONARIS, 75005, Paris, France
b CNRS-IP2CT, UMR 8233, MONARIS, F-75005, Paris, France
c AREVA NP, Université Montpellier 2, Montpellier, 34095, France
d Laboratoire Léon Brillouin CNRS-CEA, CEA Saclay, 91191 Gif-sur-Yvette, France
*corresponding author (philippe.colomban@upmc.fr, tel: +33 1.44.27.27.85)
Abstract
Long-term chemical and structural stability of an ion conducting ceramic is one of the main criteria for its selection as an electrolytic membrane in energy plant devices. Consequently, medium density SrZr0.9Er0.1O3-δ (SZE) anhydrous proton conducting ceramic – a potential electrolyte of SOFC/PCFC, was analysed by neutron diffraction between room temperature and 900°C. After the first heating/cooling cycle, the ceramic pieces were exposed to water vapour pressure in an autoclave (500°C, 40 bar, 7 days) in order to incorporate protonic species; the protonated compound was then again analysed by neutron diffraction. This procedure was repeated two times. At each step, the sample was also controlled by TGA and Raman spectroscopy. These studies allow the first
comprehensive comparison of structural and chemical stability during the
protonation/deprotonation cycling. The results reveal good structural stability, although an irreversible small contraction of the unit-cell volume and local structure modifications near Zr/ErO5[] octahedra are detected after the first protonation. After the second protonation easy ceramic crumbling under a stress is observed because of the presence of secondary phases (SrCO3, Sr(OH)2) well detected by Raman scattering and TGA. The role of crystallographic purity, substituting element and residual porosity in the proton conducting perovskite electrolyte stability is discussed.
Keywords
A: ceramics; B: chemical synthesis; C: neutron scattering, Raman spectroscopy; D: crystal structure
1. Introduction
Proton conducting perovskite ceramics, i.e. A2+(Ba, Sr etc.) Bx4+(Zr, Ce, Ti, Nb etc.) B’3+1-x(Y, Yb, Er etc.) O3-δ, are widely investigated due to their huge application potential as electrolyte membranes and/or cermet electrodes of new generation clean energy devices such as fuel cells, water electrolyzers and CO2/Syngas converters [1-8]. Comprehension of the relation between crystal structure, proton conduction and chemicals supplied at anode and cathode is a key point to optimize their lifetime and performance. Most of available literature data are focused on a material synthesis, its, mostly room temperature and/or low water pressure, characterization (X-ray, MEB) and conductivity measurements [6-16]. Such studies prove a possibility to obtain various perovskite materials with a significant proton conduction in an intermediate temperature range (400-600°C), convenient to avoid the use of expansive catalysers and steels. However they are not sufficient to guarantee successful industrial applications because of the lack of data concerning their lifetime. In order to go further than laboratory cells, complex stability/ageing (chemical, mechanical and structural) tests performed on demonstrators in industrial, operating conditions (typically 10 to 20 bar p(H2O)) [17-19] are the must. The use of high water pressure by industrialists allows an efficiency increase and in consequence to reduce the cost of Hydrogen production/conversion [20-23]. Our previous studies, performed in a strict collaboration with industry partners, showed however that such high water pressure can significantly accelerate a material ageing. Consequently, our protonation procedure performed under very high pressure (40 bar p(H2O)) can be considered as an accelerating stability test which allows very fast to choose the most stable electrolytes and/or electrodes [18,24,25].
It is noteworthy, prior to any stability test, the H-content and the discrimination between surface protonic species (hydroxides, hydroxyoxycarbonates …) and bulk protons – the only species responsible of proton conduction through a dense anhydrous membrane, i.e. the determination of an exact bulk proton nature, should be established [25-30]. The question if the Proton is a Guest or a Host in an anhydrous oxide has been addressed by Y. Baikov [31]. The nature of chemical bonds between the proton and a perovskite framework (hydroxyl ion, free, ionic proton …) remains debated [7,28,29,31-33]). What are the H bulk content and the filling ratio of oxygen vacancies created by the B-cation partial substitution? The proton nature and their content play a crucial role in thermal stability, structural (local or long range order) modifications [25,29] and in consequence in a conduction mechanism. The apparent lack of such studies performed on ceramics with different densification levels is evident.
Neutron diffraction measurements appear as a very good method to study the chemical and structural stability as a function of proton conduction/proton departure in a wide temperature range [34,35]. Moreover due to its huge sensibility to hydrogen element, they allowed to measure the proton content [25,29,34]. Up to now, this technique has been rarely employed to study proton conducting perovskite materials. Apart from some works performed at low temperature and then not pertinent to understand the proton conduction mechanisms (review in [34]), we can highlight those of Malikova et al. [36] and the group of Irvine [37] dealing with structural modifications in an operating temperature range. For these reasons we have conducted series of neutron diffraction and quasi-elastic neutron scattering campaigns to address these points better [34,38-41].
We present here neutron diffraction measurements performed in a wide temperature range, RT-900°C, on medium density (90% of the theoretical density) SrZr0.9Er0.1O3-δ (δ ≤ 0.05) ceramic pieces in non-protonated and two times protonated/deprotonated states. This study was undertaken in order to go further in our general goal, i.e. the characterisation of eventual structural modifications caused by conducting protons during
the protonation/deprotonation cycles [25-30,38-41]. Moreover, the results allowed to complete our previous ones performed on high density SrZr0.9Yb0.1O3-δ ceramics [41]. Note, our previous neutron diffraction studies showed clearly that a very small content of free bulk protons (1-5 10-3 mole/mole), i.e. protons that do not form strong covalent bonds with the perovskite framework and consequently do not show any IR fingerprint [28,32,40,41], induces small, but measurable long range structural modifications. These modifications seem to remain weak enough to guarantee high mechanical and structural stability. It should be stressed that these previous measurements suffer however from few drawbacks [41]: i) the used, high density SZYb and HSZYb ceramics originated from two different batches which excluded a possibility of their direct comparison; ii) the obtained neutron beam-time allowed us recording one protonation/deprotonation cycle only. Note, the deprotonation state can be easily obtained by a thermal treatment above 700°C during a few hours under high dynamic vacuum (10-7 Torr). Consequently, for this new neutron measurement campaign (see details in experimental section) the SZE ceramics of lower density (90%) than SZYb (98%) were selected. Such choice allowed us also to study an impact of surface/interface secondary phase(s) on structural/chemical modifications since the surface reaction mechanisms drive an ageing of ceramic membranes. Note, in the case of high density ceramics the presence of surface protonic species in the form of secondary phases can be minimized or even excluded and then one can follow the behaviour of bulk protons only. Hence, the use of medium density ceramics (90%) allows the analysis of both surface (maximized if the sample is made of small grains or is in the form of fine powder) and bulk effects and makes the experimental conditions more comparable with most of literature data performed on not fully dense ceramics [16,34]. As it can be clearly detected, we changed also a kind of substituting element, namely we replaced the Yb by Er due to its higher stability and monovalency, i.e. Er+3, which hinders internal redox reactions and associated changes of oxygen vacancy number.
Finally it should be stressed that the aim of our neutron diffraction studies (this and
the previous ones) was to determine the structural/chemical stability vs.
protonation/deprotonation cycling. In order to record many diffraction patterns as a function of temperature in a short time and to avoid the ceramic deprotonation we chose a diffractometer which offers a high neutron flux but a middle resolution. The quality of obtained data does not allow us to determine a complete structure model but is sufficient to compare temperature dependences of the unit-cell parameters of non-protonated and protonated/deprotonated ceramics. Consequently, in order to complete the neutron diffraction data, TGA curves and Raman spectra were systematically recorded before and after each neutron measurement step (Fig. 1). Note, Raman and TGA techniques are more sensitive to the secondary phase detection than diffraction experiments [25-30].
2. Material and Methods
2.1 Samples and experimental procedure
Round shaped SrZr0.9Er0.1O3-δ, δ ≤ 0.05 [25,39] (called here-after SZE_NH, NH for non hydrated) medium density (90% of theoretical density) perovskite ceramic pellets (diameter of 20mm) were prepared by the AREVA NP group using the method described elsewhere [17-19,41,42]. X-ray, Raman, SEM, elemental analysis, density, TGA and dilatometry measurements were used to verify the ceramic quality and crystallographic purity as previously described [25,42-45].
Pristine, non protonated ceramics, broken into small pieces with the widths lower than 5 mm (to fill a vanadium cylindrical sample holder) were used in the first step of this neutron diffraction campaign. In order to study structural modifications of this
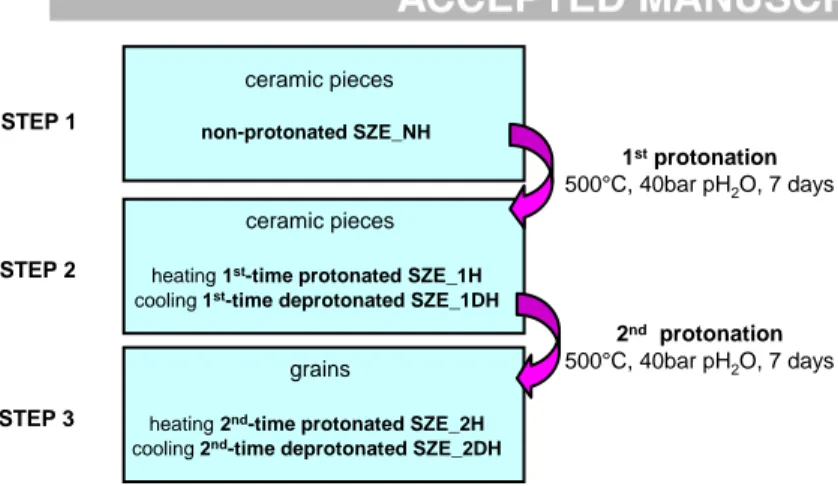
non-protonated, Er-substituted perovskite 20 neutron diffraction patterns were recorded during a heating and a cooling cycle, respectively. As sketched in Figure 1, after the first step of neutron measurements, the ceramic pieces were placed into a high temperature/high pressure autoclave device [43] and treated at 500°C, under 40 bar of carbonate-free water vapour pressure during 7 days in order to insert protonic species. According to previous studies, such duration is sufficient to guarantee an homogeneous proton distribution through a ceramic thickness [25,45]. Such 1st time protonated sample (SZE_1H, H for hydrated) was then used during the second step of neutron measurement campaign: a heating cycle allowed to follow the behaviour of protonated (SZE_1H) ceramic whereas a cooling cycle is characteristic of the 1st time deprotonated sample (SZE_1DH, DH for dehydrated). The ceramic after the first protonation/deprotonation cycle was then protonated second time in the autoclave following the same procedure. After 7 days of protonation process, a crumbling of ceramic pieces was observed. Consequently the third step of neutron diffraction measurement campaign was performed on millimetric grains: a heating cycle is characteristic of the 2nd time protonated (SZE_2H) and a cooling of the 2nd time deprotonated sample (SZE_2DH).
2.2 Neutron diffraction
Neutron diffraction measurements were performed in the French neutron facility Orphée research reactor at the CNRS-CEA Léon Brillouin Laboratory (Saclay, France) [46]. The samples (9g of pristine ceramic pieces and finally 8g of grains because of fine powder elimination and a sampling for TGA measurements) were placed into a cylindrical vanadium sample holder. Neutron experiments were carried out on a G4.1 Cold Neutron Two-Axis Diffractometer PYRRHIAS equipped with a vertical focusing pyrolytic graphite monochromator and a 800-cells multidetector [46]. The 0.24226 nm wavelength was used. The home-made furnace requiring high vacuum (10-7 Torr) allowed collecting neutron diffraction patterns in the 25-900°C temperature range, both on heating and cooling. Each diffraction pattern was recorded during 1 hour approximately. As explained above, in the case of protonated sample the heating cycle is characteristic of protonated state and the cooling one represents a behaviour of the deprotonated sample. The deprotonation, departure of protons with the temperature increase, is a common feature of proton conducting perovskites. Our previous study showed that a complete deprotonation can be obtained after a thermal treatment above 700°C during a few hours under high vacuum [25,38,39]. Note, the control of a vacuum pressure helps to follow the deprotonation process because of a temporary increase of the pressure value during protonic species departure, the deprotonation being complete when the minimal (10-7 Torr) pressure value is again reached. Ex situ TGA measurements confirm the complete deprotonation.
In order to determine the temperature evolution of unit-cell parameters, the FullProf software was used [47]. It should be stressed that the G4.1 limited resolution and 2 theta values (10-95°) do not allowed determining the atom positions. Each diffraction pattern was refined using the Le Bail matching profile procedure [48]. The successful parameters (minimal values of Bragg R factor (RB), weighted profile R factor (Rwp) and χ2) obtained at a given temperature were used as starting ones at a following temperature value. A few examples of neutron diffraction pattern refinements can be found in Fig. 2 as well as in Fig. S1 and Fig. S3 (S notes Supplementary Materials).
2.3 Raman and Thermogravimetric analyses.
Before and after each step of the neutron diffraction campaign the samples were carefully controlled by thermogravimetric analysis and Raman scattering. The obtained TG curves and Raman spectra were then compared with our own database containing the TG/Raman signatures of host perovskite structures and all possible secondary phases [25,26,27,45].
TG analysis was performed between 40 and 1000°C using a Setaram Setsys Evolution thermobalance (Caluire, France). The use of Pt-crucible and He-inert gas atmosphere allowed the significant enhancement of a measurement accuracy that is
essential in the case of small mass modifications (few % maximally) typical of proton conducting perovskites.
Raman scattering measurements were carried out using a Horiba Jobin Yvon HR800 spectrometer (Lille, France) equipped with a Peltier effect cooled CCD detector. Raman spectra were recorded in a wide spectral range using 458 nm wavelength of an Ar+ ion Coherent Laser (~10mW at the sample) through a x50 long distance working Nikon objective. Note, the presence of Er element gives rise to strong electronic transitions overlapping the Raman signature of host perovskite structure in a large wavelength range and hence imposes the choice of this blue laser excitation wavelength.
3. Results
3.1 Non protonated SrZr0.9Er0.1O3-δ (SZE_NH)
Room temperature neutron diffraction pattern of non-protonated SZE ceramic (Fig. S1, Fig. 2, Fig. 3a) shows an orthorhombic symmetry with the Pnma space group. This is in good agreement with previous structural data characteristic of pure SrZrO3 and SrZr0.9Yb0.1O2.95 [41,49], and shows clearly that the use of Ln ions (Yb or Er) as a substituting element does not distort the pristine Pnma orthorhombic symmetry. However a higher level of background and a small broadening of Bragg peaks (Fig. 3a and zoom in Fig. S2), well detected in the 2 theta 52-70° range, suggest the presence of secondary phases. Their very low intensity and important width allowed us to assign them to traces of not well symmetrised phases such as SrO. The presence of AO-type traces in the grain boundary is a common problem in the case of perovskite proton conductors [27,30,42]. Note, a small alkali earth excess is systematically added in order to optimize a ceramic sintering. If this excess is not totally consumed during the sintering, alkaline earth-based oxide traces react with (carbonated) water and then give rise to the formation of hydroxides and/or carbonates, mostly at the grain boundary surface [27,30,43]. It should be stressed that these secondary phases were ignored in our refinement model. This together with the fact that polycrystalline, proton conducting ceramics exhibit a high local disorder related to the presence of oxygen vacancies and protonic species can explain rather high values of reliability factors (Table 1), typical of these compounds [16,34,37].
The Raman spectrum (Fig. 4a) confirms well the orthorhombic symmetry of SZE ceramic (characteristic triplet at 116-144-164 cm-1) and simultaneously reveals the traces of SrCO3 (narrow peak at 1071cm-1), Er2O3 (600 cm-1) and very probably the ZrO2 crystallised within a cubic symmetry. Note, it is impossible to confirm unambiguously the presence of cubic ZrO2 traces by Raman scattering because of the overlapping of its low intense broad Raman signature with that of SZE perovskite. We suppose its presence by the lack of clear splitting of the low wavenumber triplet (116-144-164 cm-1) and an unusual high baseline in the same spectral region (see Raman fitting in Fig. 4b). It should be however stressed that both Raman and neutron diffraction measurements show clearly that the traces of secondary phases are low. The use of such ceramics containing small traces of secondary phases allows following an accelerate ageing.
As presented in Fig. 3b, with the temperature increase some Bragg peaks disappear. This is in agreement with a continuous structural phase transition from the orthorhombic Pnma symmetry to the Imma pseudo-tetragonal one in the vicinity of 700°C as already reported for non-substituted SrZrO3 [49]. The neutron diffraction patterns characteristics of both distinct symmetries are presented in Figure 5. The results of Le Bail refinements are presented in Fig S3. The orthorhombic-pseudo tetragonal phase transition is well detected by the temperature evolution of unit-cell parameters presented in Fig. 6: above 700°C a significant deviation from the linear increase is detected in the case of b parameter, simultaneously the a and c parameters reach the same values. The b parameter temperature evolution allows detecting, through a small non-linear deviation, another subtle
structural “anomaly” in the vicinity of 300°C (Fig. 6). Note this modification can be well described within the Pnma space group. Both structural modifications, i.e. the 700°C phase transition and the small anomaly at 300°C, seem to be in agreement with our previous neutron diffraction results obtained for highly dense SZYb ceramics [41]. It should be stressed however that in the case of SZYb this additional structural modification was detected near 450°C. The reason of such temperature difference is not clear. First of all, an important question can be asked: is the ~300°C anomaly detected in SZE an intrinsic feature of the perovskite Pnma symmetry or is it related to the presence of alkaline earth-based secondary phases and stoichiometry modifications? Note, near 300°C the decomposition of hydrated SrO is observed. Simultaneously, the SZYb ceramic was almost free from Sr(OH)2 [41]. Further studies performed on higher resolution diffractometer are necessary to clarify this aspect. If this structural modification does not originate from secondary phases, the temperature difference can be explained by the effect of substituting element on the host perovskite structure. It is noteworthy that our previous high pressure Raman study [50] showed clearly that the impact of substituting element on the host structure is much higher than that caused by the presence/diffusion of protons. This is then probable that the Yb and Er ions can give rise to different content and organization of oxygen vacancies and in consequence to different local structural modifications.
With the temperature decrease, a return to the Pnma orthorhombic symmetry is clearly observed. As shown in Fig. 3a the neutron diffraction patterns and thus symmetries of the SZE ceramic before and after thermal treatment are almost the same. The temperature evolutions of unit-cell volume (Fig. 7a) characteristic of heating and cooling cycles show also the same behaviour. As presented in Table 1, the values of unit-cell parameters before and after thermal treatment are very similar, revealing that the structural modifications as a function of temperature are perfectly reversible.
Table 1. Unit-cell parameters and volume determined by Le Bail profile matching method at the beginning and at the end of each neutron measurement cycle characteristic of non-protonated, 1st time protonated/ deprotonated and 2nd time protonated/deprotonated SZE proton conductor. Reliability factors (Rwp, χ2) are given for better comparison. Values of incoherent background levels (BL) reflecting the H content, are also marked in the case of protonated/deprotonated compounds.
SZE_NH SZE_1H SZE_2H
heating T=25C a = 5.821 (7) Å b = 8.239 (4) Å c = 5.789 (2) Å v=277.63 Å3 Rwp = 9.5 χ2 = 4.3 T=20C a = 5.816 (1) Å b = 8.228 (1) Å c = 5.784 (6) Å v=276.79 Å3 BL = 3860 Rwp = 10.2 χ2 = 5.6 T=25C a = 5.818 (8) Å b = 8.229 (2) Å c = 5.785 (1) Å v=276.94 Å3 BL = 2050 Rwp = 9. 2 χ2 = 5.1
cooling T<100C a = 5.822 (3) Å b = 8.240 (4) Å c = 5.790 (5) Å v=277.65 Å3 Rwp = 9.1 χ2 = 4.2 T=32C a = 5.815 (8) Å b = 8.228 (4) Å c = 5.784 (6) Å v=276.74 Å3 BL = 960 Rwp = 8.8 χ2 = 4.8 T=30C a = 5.817 (9) Å b = 8.229 (1) Å c = 5.784 (8) Å v=276.86 Å3 BL = 980 Rwp = 8.6 χ2 = 4.5
3.2 First time protonated (SZE_1H)/deprotonated (SZE_1DH) SrZr0.9Er0.1 O3-δ
Room temperature neutron diffraction pattern (Fig. 3a, Fig. S1) and Raman analysis (Fig. 4) show that SZE ceramic maintains its major orthorhombic symmetry (Pnma) after the first protonation. This symmetry is also observed once the ceramic pieces are deprotonated due to the thermal treatment. However, as it can be clearly seen (Fig. 3a), the neutron diffraction patterns characteristic of the 1st time protonated and deprotonated compound show some differences.
The most significant difference is related to the level of incoherent background intensity, namely, the protonated ceramic shows much higher background level. Since the incoherent background intensity is proportional to the hydrogen content [34,39,41], this confirms the presence of protonic species. With the temperature increase the background level decreases according to the deprotonation process. The temperature dependence of background intensity, in very good agreement with the TG analysis, is plotted in Figure 8a. The TG and neutron data reveal that the protonated ceramic contains surface water (departure at 100°C), hydroxide ions (departure at 300-400°C) and a small amount of bulk protons (departure above 550°C). Consequently, the following formula can be proposed for the 1st time protonated SZE: SrZr0.9Er0.1O3-δ (OH)0.006 H0.004,0.015 H2O. Such small content of bulk protons has been already observed in our previous studies [25,28,29,34,39,41] and seems to be a fingerprint of anhydrous protonated zirconates.
An important content of surface water in room temperature seems to have an impact on the host perovskite structure. Namely, neutron diffraction pattern (Fig. 3a, Fig. 3b, Fig. S1) reveals the presence of additional low intensity Bragg peaks detected at 2 theta: 21.8° (the most intense) and 31.2° (most probably, but it is difficult to distinguish it from a background noise). These additional Bragg peaks may have different origin: secondary phases or a kind of superstructure reflections. These Bragg peaks disappear at 100°C simultaneously with the departure of surface water. This can suggest that the presence of ordered water layer forms a kind of superstructure and/or structural distortions allow the appearance of Bragg peaks with the hkl not observed within the Pnma space group. Shpanchenko et al. [51] pointed out that the coexistence of perovskite and BaO rock salt type phases allows to incorporate large quantities of water (e.g. Ba2ZrO4 can incorporate 2 moles of water). Consequently, such organization can give rise to superstructure Bragg peaks. However in our study the additional peaks are detected only at a low 2 theta range and it is then not possible to determine unambiguously their origin. Further neutron diffraction study performed on a diffractometer offering higher resolution is necessary to
determine clearly the type of distortions caused by the hydration.
Careful analysis of room temperature diffraction patterns recorded after the first protonation, and especially deprotonation, reveals the disappearance of the background and broadening near 2 theta = 50-70° well observed in the case of non-protonated pristine ceramic (Fig. 3a, Fig. S2). This, together with the fact that Bragg peaks are more symmetrical and show little bit lower FWHM values, suggests higher level of crystallinity/symmetrization. Some differences can be also detected in Raman spectra (Fig 4). The most important features are the disappearance of some Raman peaks (Er2O3 traces at 600 cm-1) and the increase of those related to the SrCO3 (1071 cm-1). It should be stressed that due to the huge Raman cross section and narrowness, the strontium carbonate phase gives a strong signal even if is limited to traces [25,26,45]. Some modifications in the vicinity of Raman peaks centred at 750 cm-1 can be also detected (Fig 4b). Note, as described in our previous articles [44,50] the Raman modes in this spectral range are attributed to the vibrations of the ZrO6 octahedron perturbed by substituting elements, oxygen vacancies and protons. Consequently, this reveals that the first protonation modifies the local structure around the Zr/ErO5[] octahedron, according to the filling of some oxygen vacancies and the proton presence.
The structural modifications detected by neutron diffraction and Raman scattering show that two different phenomena can take place during the first protonation process. First of all, it is clear that the high temperature (500°C), high water vapour pressure (40 bar) treatment has a direct impact on the presence and type of secondary phases: namely the SrO traces were transformed into Sr(OH)2 and SrCO3. The second consequence is a diffusion of the Er ions and O2-/VO leading to their new distribution. The insertion of water (protons + oxygen ions) modifies also the oxygen vacancy level and distorts/symmetrises the octahedral network, as observed for all studied perovskites (A= Sr, Ba; B = Zr, Ti, Al, Y, Yb) [13,25,27,30,43-45].
With the temperature increase, the similar orthorhombic – pseudo tetragonal phase transition is observed near 700°C (Fig 3b, Fig. 6, Fig. 7a, Fig. S3). As for non-protonated ceramic, the a and c unit-cell parameters achieve the same value and a small deviation from the linear increase behaviour is detected in the case of b one. Analysis of the temperature evolution of b parameter behaviour reveals also another very small deviation detected near 300°C (Fig. 6). This anomaly is smaller that the one detected in the case of non-protonated ceramic, in agreement with the fact that the presence of protons symmetrises the host perovskite structure [44,50]. Significant traces of Sr(OH)2 (Fig. 8a) can suggest however that this anomaly is due to the decomposition of Sr(OH)2 observed in the same temperature range. Only additional neutron diffraction experiments performed on a higher resolution diffractometer can clarify this discrepancy.
During the cooling cycle characteristic of structural behaviour of the 1st time deprotonated ceramic, a continuous, reversible structural phase transition from the Imma pseudo-tetragonal symmetry to the Pnma orthorhombic one is clearly detected. The temperature evolutions of unit-cell parameters (open symbols in Fig. 6a) show very linear behaviour without any deviation. Their values are very similar to those characteristic of the 1st time protonated compound. Consequently, the room temperature unit-cell parameters (Table 1) are very similar, almost identical if we take into account values of a standard error deviation. It should be stressed that in the case of SZYb measureable differences were detected between the protonated and deprotonated states.
Finally it is important to underline that as during our previous neutron measurements [41] performed on SZYb, the SZE ceramic also exhibits small (0.3%), but measurable
contraction of the unit-cell volume (Table 1, Fig. 7b, Fig. S4) after the first protonation. This contraction indicates an irreversible modification of the host perovskite structure.
In conclusion, after the first protonation-deprotonation cycle, the SZE ceramic preserves its mechanical/structural properties and shows even higher level of structural order. We detected also very small chemical modifications, i.e. the SrO trace removing and SrCO3 content increase, as well as the presence of small, irreversible contraction of the unit-cell volume.
3.3 Second time protonated (SZE_2H)/deprotonated (SZE_2DH) SrZr0.9Er0.1 O3-δ
After the second protonation, performed in the same conditions, surprisingly a loss of mechanical properties was detected. Namely, applying a small stress (agate pestle), the ceramic pieces crumbled easily into small pieces, smaller than 2mm approximately, and a small part (~1/8) turned into powder. Note, such submillimetric powder was eliminated and the further measurements were performed on the ceramic grains only. The crumbling can be explained by a high reactivity of the grain boundary when traces of secondary phases are present [25,27,30]. Our previous ageing/protonation studies performed in the autoclave on BZIn, BZYb and SZYb show that the crumbling is observed when traces of secondary phases are detected by Infrared and/or Raman spectrometry [25,27,30,43,45]. Transmission Electronic Microscopy measurements are necessary to deal better with the grain boundary characterization.
Raman study of the SZE grains (Fig. 4a) shows that the Pnma orthorhombic structure is well preserved. Moreover, a comparable level of SrCO3 was detected before (SZE_1DH) and after the second protonation (SZE_2H). Again, the main difference concerns the Raman peaks in the vicinity of 750 cm-1 that reveals the incorporation of protonic species (Fig. 4b). We can thus confirm that the ceramic crumbling has no impact on structural and chemical properties of the SZE bulk material.
Neutron diffraction pattern of the 2nd time protonated SZE (Fig 2, Fig. 3a, Fig. S1) is in good agreement with the Raman results and confirms the presence of well crystallised orthorhombic symmetry with the Pnma space group. Note, the same symmetry is observed in the case of deprotonated compound (SZE_2DH). The level of incoherent background intensity is higher in the case of protonated sample (Fig. 3a) in agreement with the presence of protonic species. This background level is however smaller that the one detected in the case of 1st time protonated ceramic (Fig. 3a, Fig. 8). The comparison of temperature evolutions of the background intensity and TG analysis (Fig. 8b) reveals the traces of surface water, hydroxides and as usually a small amount of bulk protons. Following formula can be then proposed for the 2nd time protonated SZE: SrZr0.9Er0.1O3-δ (OH)0.004 H0.003,0.002 H2O.
With the temperature increase, the orthorhombic – pseudo tetragonal phase transition is observed near 700°C. As for the 1st time protonated compound, a very small deviation from the linear behaviour observed in the case of b parameter vs. temperature, suggests a kind of structural anomaly in the vicinity of 350°C. The same question can be asked: is it due to the hydroxide departure or is it an intrinsic feature of protonated system? The 2nd time deprotonated SZE undergoes also the reversible, pseudo-tetragonal-orthorhombic phase transition in the vicinity of 700°C. With further temperature decrease, a very linear behaviour of the unit-cell parameters is observed revealing the lack of additional structural modifications. As presented in Fig. 7a the temperature evolution of unit-cell
volume is very similar for the 2nd time protonated and deprotonated SZE ceramic grains. The room temperature unit-cell parameter values (Table 1) are almost the same. Raman analysis (Fig. 4) confirms also good reversibility of symmetry. The presence of SrCO3 is once again detected. The differences in intensity of the main stretching carbonate peak detected near 1071cm-1, measured across a ceramic piece fracture, show its heterogeneous distribution, the content is higher on the surface and very small into the bulk.
It is noteworthy that the room temperature unit-cell parameter values after the second protonation are very similar to those determined after the first protonation (Table 1, Fig. 7). This reveals that the second protonation has no important impact on structural modifications and in consequence a high structural reversibility as a function of protonation/deprotonation. However, with the temperature increase, above 200°C actually, the unit-cell volume values characteristic of the 2nd time protonated SZE are systematically a little bit higher that those of the 1st time protonated ceramic (Fig. 7b). Similar tendency is observed in the case of deprotonated compound.
In conclusion, after the second protonation/deprotonation cycle the SZE compound shows rather good structural stability with the small structural modifications very similar to those detected already after the first protonation/deprotonation. Simultaneously, the traces of secondary phases are still present and a significant ceramic crumbling was easily obtained under hand mortar pestle action.
4. Discussion
Three successive neutron diffraction campaigns performed on the same batch of non-protonated as well as two times protonated/deprotonated SrZr0.9Er0.1O3-δ allowed us to go deeper in the study of the structural and chemical stability of anhydrous proton conducting perovskites. These neutron results, supported by Raman and TGA analyses, show that the SZE perovskite exhibits a good structural stability as a function of protonation/deprotonation cycling with a high level of reversibility. The most important structural modification giving rise to the small irreversible unit-cell volume contraction (0.3%) is detected after the first protonation performed at 500°C under 40 bar of water vapour pressure (Fig. 7b). After the second protonation, similar values of the unit-cell parameters are detected (Fig. 7b, Table 1). Simultaneously, the first protonation plays also a major role (Fig. 4, Fig. 3, Fig. S2) in the presence and type of secondary phases. Namely, during this protonation the SrO/Er2O3 traces are transformed into hydroxides and carbonates (Fig. 4, Fig. 8a). This transformation seems to stabilize the host perovskite symmetry, and even to enhance a crystallization level (Fig. 3, Fig. S2). Consequently, after the first protonation a quite good chemical stability is observed (Fig. 4). However the presence of secondary phases and their important reactivity with water and CO2 lead to an easy ceramic crumbling, detrimental for industrial applications, already after the second protonation. Note, previous studies showed that high density ceramics (> 95%) retain their pristine mechanical strength after 5 weeks of operating at 500°C under 50 bar of H2O pressure [43,45]. This points out that a particular reactivity of the grain boundary can be controlled by the ceramic processing.
These interesting results compared with the previous ones obtained on high density SZYb ceramics [41] allowed us to consider a few important questions/aspects:
exhibit medium density (90%), lower than the ceramics previously used in our studies (95-99%). The results reveal the presence of secondary phase traces: SrO, Er2O3 and SrCO3 (Fig. 4). This is related to the excess of Er and Sr oxides during the synthesis in order to promote a high densification and nominal stoichiometry of a perovskite phase [27,30,42,45]. The presence of secondary phases shows that this excess has not been completely removed during the sintering. The crystallographic/chemical purity of pristine ceramic is the must: our studies (this and previous ones [24,25,43]) show clearly that a lifetime of a material containing secondary phases is rather short. The highest structural/chemical stability has been observed in the case of high density SZYb ceramics showing a single perovskite phase only [41,43,45].
ii) The role of secondary phases. The presence of secondary phases plays a key role in the protonation process. It is clear that the traces of SrO and SrCO3 interact strongly with water vapour leading to the hydroxide formation and to the SrCO3 content increase (Fig. 4, Fig. 8). The Sr(OH)2 content detected after each protonation (Fig. 8) is systematically removed above 300°C which seems to have a small impact on the temperature evolution of lattice parameters/unit-cell volume (Fig. 6, Fig. 7) as well as on conductivity measurements [16,52]. The SrCO3 content is limited to traces but seems to increase slightly with the number of protonation/deprotonation cycles (Fig. 4). The results show that secondary phases present once in a pristine material, remain always present in a protonated/deprotonated compound. Moreover, they can easily react with water/CO2 and then transform themselves into more complex forms [26]. In consequence, the presence of secondary phases will always lead to a premature ageing. The SZE crumbling is its first consequence. Further on, more or less important chemical/structural decomposition of perovskite phase appears as it was already detected in the case of Ba-based homologues [27,30,43].
iii) The type and content of protonic species. The use of lower density ceramics should, in theory, make the incorporation of protonic species easier due to a higher surface of gas/solid exchange. Indeed, higher content of protonic species was detected in the case of SZE protonated compound (Fig. 8) in comparison with that characteristic of SZYb [41]. However, TGA and incoherent background measurements (Fig. 8) reveal clearly that this increase concerns the surface protonic species (water, Sr(OH)2) only! The content of bulk protons is small, i.e. 2-4 10-3 mole/mole, comparable to that previously determined in the case of high density homologues [25,29,34]. Important question can be then asked: is it possible to enhance the bulk proton content or does any threshold exist? In order to answer this question, one should consider an effective content of oxygen vacancies, their distribution and how many of them we can fill during the protonation process. These aspects have not been fully resolved yet [33,45,53]. Raman study showing important differences in the 700-800 cm-1 spectral range (Fig. 4) assigned to the vibrations of octahedra perturbed by the substituting elements, oxygen vacancies and protons (Fig. 4) points that the oxygen vacancy distribution/filling differs between a sample bulk and surface. Further study should be performed on single crystal to determine the content and the role of oxygen vacancies in the proton species incorporation mechanism as well as in local structure modifications.
case of the first protonation process, the ceramic contains higher water level that modifies the pristine symmetry giving rise to the structure distortions (Fig. 3). Once the SZE ceramic crumbled into small pieces/powder the observed water level is smaller what can suggest that water was present at the total surface (including the pore surface) due to higher porosity and/or in the grain boundary. Simultaneously, the contents of Sr(OH)2 and bulk protons are comparable whatever the dense ceramic or grains.
iv) The role of substituting element. Important structural differences were detected between the SZYb and SZE compounds. These differences are related to the presence of additional small structural modifications (450°, 550°C) as well as the structural irreversibility detected as the unit-cell volume contraction after deprotonation in the case of SZYb ceramic [41]. On the contrary, the Er-based SZ material shows rather high structural reversibility after three thermal heating/cooling and two protonation/deprotonation cycles. Only, very small contraction of the unit-cell volume was detected after the first protonation which suggests that the use of monovalent Er as a substituting ion enhances the reversibility between the protonated and deprotonated states. On the other hand, the Er-substituted compound shows the loss of mechanical strengths related to the presence of secondary phases. Since the SZYb and SZE ceramics exhibit different density, the structural/chemical/mechanical differences cannot be explained by the type of substituting element only. In order to go further in the determination of perfect compromise between the composition, especially the substitution level, density and their role in protonation/deprotonation aspects and long term stability, the similar study should be performed but on the ceramics free from secondary phases using a higher resolution diffractometer.
5. Conclusions
Neutron diffraction, TGA and Raman studies show that SrZr0.9Er0.1O3-δ, a potential candidate for electrolytic membrane of hydrogen economy devices, exhibits rather good structural/chemical stability vs. protonation/deprotonation cycling. Simultaneously, these studies reveal a complex structural behaviour of this anhydrous proton conducting perovskite. The first protonation is crucial, not only because seems to stabilize the major perovskite symmetry and secondary phase level but especially because it changes the local structure, very probably allows the homogenization of substitution element and oxygen vacancy distribution. Further studies, such as environmental XPS, EXAFS, NMR and TEM very sensible to a local ion environment, performed on ceramics and single crystals are necessary to go further in understanding these local modifications. Consequently, the first protonation gives rise to small irreversible structural/chemical modifications which do not change any more through further protonation/deprotonation cycling. The crumbling of SZE ceramic after the second protonation shows clearly that the presence of secondary phases (SrO, SrCO3, Sr(OH)2, …), even limited to traces, at the grain boundary would always lead to a premature ageing. Note, under high pressure enhancing significantly ageing mechanisms, any instability can be detected very fast. This allows us to optimize the structural/chemical stability of a material and in consequence to propose a good membrane with a very long lifetime (more than 10 000h) for industrial applications. Further study is however necessary to determine the relations between the structural modifications and proton dynamics vs. operating cycling. The priority should be given to measurements
allowing the coupling of diffraction experiment with quasi-elastic ones, performed if possible in situ or even in operando.
Acknowledgments
The authors would like to thank Thierry Seropian (MONARIS) for technical support during the autoclave treatment. Partial financial support of ANR PAN-H Celeva and H-PAC Heleva projects are acknowledged. Dr Olivier Lacroix and co-workers from AREVA NP
References
1. F Forrat, G. Dauge, P. Trevoux,. G. Danner, M. Christan, Acad. Sci. Paris, 259 (1964) p. 2813
2. H. Iwahara, T Esaka, H. Uchida, N. Maeda, Solid State Ionics, 3/4 (1981) p. 359
3. Ph. Colomban Ed.: Proton Conductors Solids, membranes and gel – materials and devices. Cambridge University Press, Cambridge (1992)
4. M. Ni, M.K.H. Leung, D.Y.C. Leung, Int. J. Hydrogen Energy, 32 (2007) p. 4648
5. H. Matsumoto, S. Okada, S. Hashimoto, K. Sasaki, R. Yamamoto, M. Enoki, T. Ishihara, Ionics, 13 (2007) p. 93
6. Ph. Knauth, M.L. Di Vona,. Eds.: Solid State Proton Conductors. Properties and Applications in Fuel Cells, John Wiley & Sons, Chichester (2012)
7. K.D. Kreuer, Annu. Rev. Mater. Res., 33 (2003) p. 333 8. T. Norby, Solid State Ionics, 125 (1999) p. 1
9. T. Kobayashi, K. Abe, Y. Ukyo, H. Matsumoto, Solid State Ionics, 138 (2001) p. 243 10. S. Tao, J.T.S. Irvine, J.A Kilner, Advanced Materials, 17 (2005) p. 1734
11. A.S. Nowick, Y. Du, Solid State Ionics, 77 (1995) p. 137
12. S. Ricote, N. Bonanos, G. Caboche Solid State Ionics, 180 (2009) p. 990
13. A. Grimaud, J.M.Bassat, F. Mauvy, P. Simon, A. Canizares, B. Rousseau, M.Marrony, J.C.Grenier, Solid State Ionics, 191 (2011) p. 24
14. Q. Chen, T.W.Huang, M. Baldini, A.Hushur, A. Pomjakushin, S. Clark, W. Mao, M. Manghnani, A.Braun, T. Graule, J. Phys. Chem. C, 115 (2011) p. 24021
15. F. Giannici, M. Shirpour, A. Longo, A. Martorana, M. Merkle, J.Maier, Chem Materials, 23 (2011) p. 2994 16. I. Ahmed, C.S. Knee, M. Karlsson, S.G. Eriksson, P. F. Henry, A. Matic, D. Engberg, L. Borjesson, J. Alloys
Comp., 450 (2008) p. 103
17. B. Sala, O. Lacroix, S.Willemin, K. Rhamouni, H.Takenouti, A. van der Lee, P. Goeuriot, B Bendjeriou, Ph.Colomban, Procédé d’optimisation de la conduction ionique d’une membrane conductrice ionique, AREVA, CNRS, ARMINES, SCT, PCT patent WO 2008/152317 A2 (18-12-2008)
18. B. Sala, F. Grasset, O. Lacroix, A. Sirat, K. Rhamouni, M. Keddam, H. Takenouti, D. Goeuriot, B.
Bendjeriou, Ph. Colomban, A. Slodczyk, G. Pourcelly, A. Van der Lee, J.G.Sanchez Procédé de génération d’hydrogène par électrolyse de vapeur, AREVA, CNRS, ARMINES : French Patent FR 1159221, 12/11/2011 19. O. Lacroix, K. Rahmouni, A. Sirat, H. Takenouti, C. Deslouis, M. Keddam, B. Sala, J. Power Sources, 270
(2014) p. 506
20. L.A Chick, O.A. Marina, C.A. Coyle, E.C. Thomsen, J. Power Source, 236 (2013) p. 341
21. L. Magistri, A. Traverso, F. Cerutti, M. Bozzolo, P. Costamagna, A.F. Massardo, Fuel Cells, 5 (2005) p. 80 22. W.J. Yang, S.K. Park, T.S. Kim, J.H. Kim, J.L. Sohn, S.T Ro, J. Power Source, 160 (2006) p. 462
23. W. Burbank Jr, D. Witmer, F. Holcomb, J. Power Sources, 193 (2009) p. 656
24. S. Upasen, P. Batocchi, F. Mauvy, A. Slodczyk, Ph. Colomban J. Alloys Comp. 622 (2015) p. 1074 25. Ph. Colomban, O. Zaafrani, A. Slodczyk, Membranes, 2(3) (2012) p. 493
26. Ph.Colomban, C. Tran, O Zaafrani, A. Slodczyk, J. Raman Spectrosc., 44 (2013) p. 312
27. A. Slodczyk, B. Dabrowski, N. Malikova, Ph. Colomban, MRS Proceedings, 1311 (2011) doi: 10.1557/opl.2011.107.
28. A. Slodczyk, Ph. Colomban, O. Zaafrani, O. Lacroix, B. Sala, Mater. Res. Soc. Proc., 1309 (2011) p. 34 29. Ph. Colomban, Fuel Cells 13 (2013) p. 6
30. A. Slodczyk, M.D. Sharp, S. Upasen, Ph. Colomban, J. Kilner, Solid State Ionics, 262 (2014) p.870 31. Y.M. Baikov, W. Gunther, V.P. Gorelov, Ph. Colomban, R. Baddour-Hadjean, Ionics, 4 (1998) p. 347
32. Ph. Colomban, J. Tomkinson, Solid State Ionics, 97 (1997) p.123
33. Q. Chen, F. El Gabaly, F.A. Akgul, Z. Liu, B.S. Mun, S. Yamaguchi, A. Braun, Chem. Mater., 25 (2013) p. 4690
34. Ph. Colomban, A. Slodczyk, European Physical J. Special Topics, 213 (2012) p. 171 35. M. Karlsson, Dalton Trans,. 42 (2013) p. 317
36. N. Malikova, C.K. Loong, J.M. Zanotti, F. Fernandez-Alonso, J. Phys. Chem., C111 (2007) p. 6574
37. A.K. Azad, A. Kruth, J.T.S. Irvine, Intern. J. Hydrogen Energy, 39 (2014) p. 12804
38. A. Slodczyk, Ph. Colomban, D. Lamago, M.H. Limage, F. Romain, B. Sala, S. Willemin, Ionics, 14 (2008) p. 215
39. A. Slodczyk, Ph. Colomban, D. Lamago, G. André, O. Zaafrani, O. Lacroix, A. Sirat, B. Sala, J. Mater. Res., 27 (2012) p. 1939
40. A. Slodczyk, Ph. Colomban, O. Zaafrani, N. Malikova, S. Longeville, J.-M. Zanotti, O. Lacroix, B. Sala, Solid State Ionics, 252 (2013) p. 7
41. A. Slodczyk, Ph. Colomban, G. Andre, O. Zaafrani, F. Grasset, O. Lacroix, B. Sala, Solid State Ionics, 225 (2012) p. 214
42. B. Bendjeriou-Sedjerari, J. Loricourt, D. Goeuriot, P.Goeuriot, J. Alloys Compd., 509 (2011) p. 6175
43. A. Slodczyk, O. Zaafrani, M.D. Sharp, J.A. Kilner, B. Dabrowsky, O. Lacroix, Ph. Colomban, Membranes, 3(4) (2013) p. 311
44. A Slodczyk, Ph Colomban, S. Willemin, O. Lacroix, B. Sala, J. Raman Spectrosc., 40 (2009) p.513
45. O. Zaafrani PhD Thesis, UPMC Paris (2010) 46. www.llb.cea.fr
47 J. Rodriguez-Carvajal, FullProf Software, http://www.ill.fr/ 48. A. Le Bail, Powder Diffraction, 20 (2005) p. 316
49 C.J.Howard, K.S. Knight, B.J. Kennedy, E.H. Kisi, J. Phys. Condens.Matter, 12 (2000) p. L677 50. A. Slodczyk, M.H. Limage, O. Zaafrani, Ph. Colomban, F. Grasset, J. Loricourt, B. Sala, J.Raman
Spectroscopy, 42 (2011) p. 2089
51. R. V. Shpanchenko, E. V. Antipov, L. M. Kovba, Zh. Neorg. Khim, 38 (1993) p. 599
52. N. Jalarvo, C. Haavik, C. Kongshaug, P. Norby, T. Norby, Solid State Ionics. 180 (2009) p. 1151
Figure captions
Fig. 1 Sketch presenting the samples used in 3 steps of neutron diffraction campaign. Fig. 2 Examples of neutron diffraction pattern refinement characteristic of a) non-protonated, pristine b) 2nd time protonated SZE proton conductor. Other examples can be found in Fig. S1.
Fig. 3 Neutron diffraction patterns recorded at the beginning and the end of each measurement cycle (a) and temperature dependences of Bragg peak positions (b) characteristic of non-protonated, first time protonated and second time protonated SZE proton conductor. Zoom of neutron diffraction patterns presented in Fig 3 can be found in Fig. S2.
Fig. 4 a) Raman spectra (S-surface, B-bulk) of non-protonated as well as first and second time protonated/deprotonated SZE proton conductor. The presence of the most characteristic stretching mode of SrCO3 is marked by the asterisks. b) Fitting of Raman spectra (s-surface, b-bulk) characteristic of non-protonated as well as first and second time non-protonated/denon-protonated SZE proton conductor. The reduced scale allows to distinguish modifications in the ~750 cm-1 spectral region related to the oxygen vacancies and protonic species.
Fig. 5 Neutron diffraction patterns in limited 2 theta range characteristic of non- protonated SZE ceramics recorded at 25°C and 750°C. The disappearance of some Bragg peaks reveals the presence of long range order structural phase transition from the Pnma orthorhombic to the Imma pseudo tetragonal symmetry. Results of neutron diffraction refinements at RT, 500°C and 800°C can be found in Fig. S3.
Fig. 6 Temperature dependences of the unit-cell parameters of non-protonated, first and second time protonated SZE proton conducting ceramic.
Fig. 7 a) Temperature dependences of the unit-cell volume of non-protonated, first and second time protonated SZE proton conductor. b) Comparison of the unit-cell volume vs. temperature between the compound in non-protonated/protonated and non-protonated/deprotonated states. Small vertical lines marked below the sample description give an idea of error values. The b graph with experimental errors can be found in Fig. S4.
Fig. 8 Comparison of temperature dependences of incoherent background intensity proportional to the content of protonic species and TGA curves characteristic of SZE ceramic protonated first (a) and second (b) time.
STEP 1 STEP 2 STEP 3 ceramic pieces non-protonated SZE_NH 1stprotonation 500°C, 40bar pH2O, 7 days ceramic pieces
heating 1st-time protonated SZE_1H
cooling 1st-time deprotonated SZE_1DH
grains
heating 2nd-time protonated SZE_2H
cooling 2nd-time deprotonated SZE_2DH
2nd protonation
500°C, 40bar pH2O, 7 days
Fig. 1 Sketch presenting the samples used in 3 steps of neutron diffraction campaign.
a) b) 20 40 60 80 100 0 10000 20000 30000 exp. data calc. data difference SZE_NH beginning Int en sit y (co un ts) 2 theta (deg) 20 40 60 80 100 0 10000 20000 30000 exp. data calc. data difference SZE_2H Intensity (coun ts) 2 theta (deg)
Fig. 2 Examples of neutron diffraction pattern refinement characteristic of a) non-protonated, pristine b) 2nd time protonated SZE proton conductor. Other examples can be found in Fig. S1.
0 200 400 600 800 20 32 34 Temperature (°C) 50 56 58 B ra gg p ea k p os it io n (d eg ) 80 85 90 92 60 62 66 68 70 72 0 200 400 600 800 20 34 Temperature (°C) 50 56 58 80 85 90 92 60 62 66 68 70 72 0 200 400 600 800 20 34 Temperature (°C) 50 56 58 80 85 90 92 60 62 66 68 70 72
a) b) SZE_NH SZE_1H SZE_2H
20 40 60 80 0 10000 20000 30000 SZE_NH --- beginning --- end 2 theta (deg) 0 10000 20000 30000 SZE --- 1H --- 1DH Intens ity ( c ounts ) 0 10000 20000 30000 SZE --- 2H --- 2DH
Fig. 3 Neutron diffraction patterns recorded at the beginning and the end of each measurement cycle (a) and temperature dependences of Bragg peak positions (b) characteristic of non-protonated, first time protonated and second time protonated SZE proton conductor. Zoom of neutron diffraction patterns presented in Fig 3 can be found in Fig. S2.
200 400 600 800 1000 1200 * * * * * B Wavenumber (cm-1) SZE_NH S Ram an I nten sity B SZE_1H S B SZE_1DH S SZE_2H SZE_2DH 200 400 600 800 1000 1200 * * * * * * B Wavenumber (cm-1) SZE_NH S 200 400 600 800 SZE_NH Wavenumber (cm-1) SZE_DH1_b SZE_DH1_s Ram an int ens it y SZE_DH2_b SZE_DH2_s 200 400 600 800 SZE_NH Wavenumber (cm-1) SZE_H1_B SZE_H1_s SZE_H2_b SZE_H2_s a) b) Fig. 4 a) Raman spectra (S-surface, B-bulk) of non-protonated as well as first and second time protonated/deprotonated SZE proton conductor. The presence of the most characteristic stretching mode of SrCO3 is marked by the asterisks. b) Fitting of Raman spectra (s-surface, b-bulk) characteristic of non-protonated as well as first and second time non-protonated/denon-protonated SZE proton conductor. The reduced scale allows to distinguish modifications in the ~750 cm-1 spectral region related to the oxygen vacancies and protonic species.
60 80 0 5000 10000 15000 20000 25000 SZE_NH 25°C (Pnma) 750°C (Imma) In te ns it y (c ou nt s ) 2 theta (deg)
Fig. 5 Neutron diffraction patterns in limited 2 theta range characteristic of non- protonated SZE ceramics recorded at 25°C and 750°C. The disappearance of some Bragg peaks reveals the presence of long range order structural phase transition from the Pnma orthorhombic to the Imma pseudo tetragonal symmetry. Results of neutron diffraction refinements at RT, 500°C and 800°C can be found in Fig. S3.
0 200 400 600 800 5.75 5.80 5.85 8.25 8.30 b Temperature (°C) Temperature (°C) u n it -c e ll p a ra m e te rs ( Å ) b b NH_Tinc NH_Tdec Temperature (°C) 0 200 400 600 800 5.75 5.80 5.85 8.25 8.30 H1 DH1 0 200 400 600 800 5.75 5.80 5.85 8.25 8.30 H2 DH2
Fig. 6 Temperature dependences of the unit-cell parameters of non-protonated, first and second time protonated SZE proton conducting ceramic.
200 400 600 800 276 278 280 282 284 286 NH_Tincrease NH_Tdecrease Temperature (°C) 276 278 280 282 284 286 H1 DH1 u n it-c e ll v o lu m e (Å 3 ) 276 278 280 282 284 286 I H2 DH2 200 400 600 800 276 278 280 282 284 286 I NH H1 H2 u n it-ce ll v o lu m e (Å 3 ) Temperature (°C) 200 400 600 800 276 278 280 282 284 286 I b) a) NH Tdeacrese DH1 DH2 u n it-ce ll v o lu m e (Å 3 ) Temperature (°C)
Fig. 7 a) Temperature dependences of the unit-cell volume of non-protonated, first and second time protonated SZE proton conductor. b) Comparison of the unit-cell volume vs. temperature between the compound in non-protonated/protonated and non-protonated/deprotonated states. Small vertical lines marked below the sample description give an idea of error values. The b graph with experimental errors can be found in Fig. S4. . 200 400 600 800 1000 2000 3000 4000 SZE_1H Ba ck g ro u n d in te n si ty 200 400 600 800 1000 2000 3000 4000 SZE_2H 200 400 600 800 97.5 98.0 98.5 99.0 99.5 100.0 Temperature (°C) T G (% ) Temperature (°C) 200 400 600 800 97.5 98.0 98.5 99.0 99.5 100.0 a) b)
Fig. 8 Comparison of temperature dependences of incoherent background intensity proportional to the content of protonic species and TGA curves characteristic of SZE ceramic protonated first (a) and second (b) time
200
400
600
800
276
278
280
282
284
286
SrZr
0.1
Er
0.9
O
3-
NH
H1
H2
u
n
it
-c
e
ll vo
lu
m
e
(
Å
3
)
Temperature (°C)
HighlightsNeutron diffraction, TGA and Raman study of SrZr0.9Er0.1O3-δ proton conductor First study of structural stability during protonation/deprotonation cycling
SrZr0.9Er0.1O3-δ shows high structural stability vs. protonation/deprotonation cycles First protonation is crucial for long-term structural/chemical stability