HAL Id: halshs-00986912
https://halshs.archives-ouvertes.fr/halshs-00986912
Preprint submitted on 5 May 2014HAL is a multi-disciplinary open access
archive for the deposit and dissemination of sci-entific research documents, whether they are pub-lished or not. The documents may come from teaching and research institutions in France or
L’archive ouverte pluridisciplinaire HAL, est destinée au dépôt et à la diffusion de documents scientifiques de niveau recherche, publiés ou non, émanant des établissements d’enseignement et de recherche français ou étrangers, des laboratoires
Financial Consumption and the Cost of Finance:
Measuring Financial Efficiency in Europe (1950-2007)
Guillaume Bazot
To cite this version:
Guillaume Bazot. Financial Consumption and the Cost of Finance: Measuring Financial Efficiency in Europe (1950-2007). 2014. �halshs-00986912�
WORKING PAPER N° 2014
– 17
Financial Consumption and the Cost of Finance:
Measuring Financial Efficiency in Europe (1950-2007)
Guillaume Bazot
JEL Codes: E2 ; G2 ; N2 Keywords:
P
ARIS-
JOURDANS
CIENCESE
CONOMIQUES48, BD JOURDAN – E.N.S. – 75014 PARIS
TÉL. : 33(0) 1 43 13 63 00 – FAX : 33 (0) 1 43 13 63 10 www.pse.ens.fr
Financial Consumption and the Cost of Finance:
Measuring Financial Efficiency in Europe (1950-2007)
Guillaume Bazot
∗Abstract
This paper proposes to assess financial intermediation efficiency in Germany, France, the UK, and Europe more broadly, over the past 60 years. I rely on Philippon’s (2012) methodology, which calculates the unit cost of financial intermediation through the ratio of ‘financial consumption’ — measured by financial income — to ‘financial output’ — approximated by the sum of outstanding assets intermediated.
The contribution of this paper is threefold. First, because financial industry VA ig-nores banks’ capital income (capital gains, dividends and interest on securities) it is an imperfect measure of the consumption of financial intermediation. So long as capital income generates wages and profits to financial intermediaries, it is akin to an im-plicit consumption of financial services. Using banking income instead of banking VA to measure the consumption of banking services, I show that the GDP share of finance has increased continuously in Germany, France, the UK and Europe as a whole. Sec-ond, the unit cost of financial intermediation increased over the past 40 years, except in France where, overall, it stagnated. In addition, the European unit cost matches the US unit cost calculated by Philippon (2012). Finally, because financial intermediaries deal with nominal stocks and flows, and because the unit cost increases during periods of monetary troubles, I focus here on nominal rates of interest to explain the evolution of unit cost. I show that a rise in nominal rates of interest increases the spread of bank interest, so that 1970s and 1980s high unit costs are statistically explained by increases in short-term interest rates. On the other hand, post-1990s high unit cost seems to coincide with the development of new market-based activities. (JEL codes E2, G2 and N2)
∗Paris School of Economics, 48 Boulevard Jourdan, 75014 Paris; e-mail: gbazot@gmail.com. I thank,
Antoine Bozio, Benoˆıt Lallemand, Mathias L´e, Eric Monnet, Thomas Piketty, Thomas Philippon, Thierry Philipponnat, Angelo Riva, Moritz Schularick and Gabriel Zucman for helpful comments and suggestions. This research has been made in the Institut des Politiques Publiques and supported by Finance Watch.
Introduction
The main function of finance is to transfer resources from actors that have it to those that need it. In this process, financial intermediation pools the risks, provides liquidity and reduces information asymmetries that impede the transfer of funds. According to neoclassical models of growth, financial intermediation should enhance growth in two ways : it remunerates savers according to their risk aversion, thereby encouraging saving and investment ; and it allocates funds according to their best use. So long as financial intermediation facilitates the efficient allocation of funds, more finance should trigger more growth. However, some other factors can reduce this effect. In particular, the frequency of financial crises has upset the idyllic vision of financial development and raises new questions about the effects of the size of the financial sector on financial efficiency (Haldane et al. 2010, Philippon 2013). A key question in the debate is whether recent financial developments justify the accrued importance of finance in our economies and whether, as some propose, regulation should be aimed at reducing its importance.
The reduction of regulatory barriers and the increasing size of financial industry since the early 1980s brought about new financial issues. First, fees and remunerations in finance soared due to new, human capital-intensive activities (Philippon and Reshef 2012 and 2013) whereas no evidence has been found that active investors have been able to outperform the market (Fama and French 2010). Second, entry by financial intermediaries entails that investor portfolios shift to riskier and more expensive financial products (Gennaioli et al. 2013). Third, the “too systemic to fail” problem emerged following banks’ restructuring, which increased banks leverage ratio and encouraged risk-taking while creating privatized short term gains and socialized long term losses (Blundell–Wignall et al. 2009). Therefore, following Philippon’s (2013) study of the US case, this paper proposes to calculate the unit
cost of financial intermediation for Germany, France, the UK, and Europe1
as a whole from 1950 to 2007, as a way of assessing the efficiency of financial services production. This unit cost, defined as the average cost of producing and maintaining one unit of a synthetic financial service during one year, is thus calculated by the ratio of the domestic income of the finance sector to the quantity of domestic finance services produced.
The income of financial services is commonly assessed through financial VA (Berger and Humphrey 1992, Philippon 2012, Philippon and Reshef 2013). This choice is straightforward :
1. Since the relevant data are not systematically available for all European countries, “Europe” here includes its largest countries, Germany, France, the UK, Italy, Spain and the Netherlands. This simplification is unproblematic because these countries account for almost 85 per cent of Europes GDP throughout the covered period.
it ignores the hidden costs of systemic risk, but accounts for all fees and spreads. However, banking institutions have increased considerably the volume of securities held in their ba-lance sheets over the past 30 years. These securities create income for banks in the form of dividends and interest on securities and capital gains not captured in a national accountant’s perspective (Stauffer 2004). Because such income belongs to banks’ risk management stra-tegy (Diamond and Rajan 2009) and because banks increasingly substitute non-traditional income for interest income (Stiroh 2004), capital income is akin to an implicit consumption of financial services. This generates a transfer of income from the economy to the financial industry. Although this issue should not dramatically affect results for the US, due to the limited share of banking activities in total financial activity there, it could have a great im-pact in Europe, where banks — along with their subsidiaries — are the principal financial intermediaries, even in the UK. In this respect, this paper proposes to “correct” financial VA, using banking income instead of banking VA in the calculation. This correction proves to be of prime importance since, unlike the ratio of ‘plain financial VA’ to GDP, which reaches a plateau in the 1990s in most European countries (Philippon and Reshef 2013), the ratio of ‘corrected financial VA’ to GDP increases continuously over the covered period.
The ‘financial output’ series aims to take into account all services produced by the finan-cial industry — namely, transfer of funds, liquidity and advisory services. In order to provide their services, financial intermediaries produce and manage financial assets. Assuming that a financial asset needs to be intermediated, either at the time of issue or during its life, I measure the output through the sum of extant domestic financial assets in the economy. For all studied countries, the ratio of financial output to GDP booms after countries’ financial deregulation occurring from late 1970s to early 1990s (see figure 1.1.1). Deregulation proves to be of prime importance regard to financial asset development in France — due to the development of financial market — and the UK — due to the boom of banking credit.
The unit cost calculation show that the cost of producing financial services in Europe turn around two to three per cent. In addition national unit costs tend to converge after the 1990s along with financial globalization. Thus, it costs from two to three euro-cents to create and maintain one euro of financial asset in the considered period. More importantly, the unit cost increases over the period, except in France, where it increases during the 1970s then decreases in the early 1990s. Finally, comparing the result with the US series, I show that European and US unit costs follow a very similar path over the period.
So as to explain the increasing trend of the unit cost I focus my analysis on two main mechanisms. I first look at the evolution of interest rate especially during the 1970s as inflation increased the spread between lending and deposit rates. Second, I propose to assess
the effect of the development of market-based business comparing the evolution of banks’ capital income with the unit cost of finance. This choice refers to the evolution of financial industry income as capital income has substituted to interest income along with financial deregulation.
I show that 1970s and 1980s high unit costs are statistically explained by the evolution of nominal rates of interest. On the other hand, it is difficult to explain the post-1990s high values. This unexplained cost, assessed through the residual of a regression explaining the unit cost by nominal rates of interest, is then compared to the ratio of banks capital income to all financial income. The comparison show that the development of banks’ “market-based” income coincide with the high unit cost after the 1990s.
All those results finally challenges empirical analyses showing that regulation increases the costs of financial intermediation (see Demirgu¸c–Kunt et al. (2004) and Levine (2011) amongst others). One possible explanation is that, unlike these studies, this calculation accounts for the whole financial industry, not just banks, and non-interest incomes. The deregulation of banking may have reduced interest margins because banks have developed profitable market activities on the shoulders of traditional ones. The development of shadow banking raised the number of transactions involved in the intermediation process (Greenwood and Scharfstein 2013) and thereby increased market-based income (most often capital income and fees) at the expense of bank-based (interest spreads) income.
The rest of this paper is organized as follows : Section 1 explains the method used to calculate the unit cost of financial intermediation ; section 2 presents the German, French and UK cases in detail ; section 3 proposes an estimation of the unit cost of financial inter-mediation in the whole of Europe and section 4 explains unit cost evolution and identifies the sources of financial intermediation cost.
1
Measuring financial consumption, financial output
and the unit cost of finance
What is a unit cost ? Lets take the example of the electricity industry in order to restate the basic logic of this idea. The total cost of production or of consumption of electricity is what society pays out to get electricity given the cost of raw material such as oil or uranium. The unit cost of providing electricity thus corresponds to the income earned by the electricity industry divided by total production of electricity. From this calculation derives the average cost, or unit cost, per kilowatt in a given period. Such a calculation can seem redundant however, given that the price of a kilowatt is regularly published in numerous
sources. The situation is different in the finance sector, where the heterogeneity of financial services renders impossible the use of pricing to measure unit cost. To measure the cost of finance, I thus rely on aggregate data. The methodology used in this paper is inspired by the work done on American data by Thomas Philippon (2013) and relies on macroeconomic data on the finance sector. It aims to measure a unit cost of financial intermediation, defined as the real cost of the creation and maintenance of one euro of financial service over one year. The unit cost hence corresponds to the ratio of the domestic income of the finance sector to the quantity of domestic finance services produced.
1.1
Financial consumption
The income of the finance industry, measured as a percentage of GDP, gives an idea of the rhythm of the annual growth of domestic financial consumption and of the economic significance of the finance industry. According to national accounting principles for calcula-ting value added (VA), this income can be measured in two ways : on the one hand, as the sum of revenues received by the finance industry minus the consumption required for the production of financial services and on the other hand, as the sum of profits, wages and taxes distributed by the financial industry for its domestic services. However, the specificities of the finance sector do not always allow the equating of these two measures, especially in the banking sector. Indeed, some activities are not considered in the national accounts to be the products of financial intermediation, even though they give rise to profits, wages and taxes. Therefore, a puzzle emerges as we compare the value added calculated by national ac-counts with the net incomes of financial institutions. In particular, banks have increased considerably the volume of securities held in their balance sheets over the last 30 years. Se-curities bring income to financial institutions – especially dividend and interest on seSe-curities and capital gains – that are not counted in a national accountant’s perspective (Stauffer
2004) even though they increase wages and profits2
. These incomes are linked to activities of portfolio management and market making and in this sense constitute income from finan-cial intermediation. In fact, banks use traditional activities to develop new market activities and vice versa.3
While banking VA measures banking intermediation in a limited way,
nota-2. It appears in particular that the compensation share of finance becomes much higher than the GDP share of finance over the past 20 years even though compensations series ignores ’other remunerations’ — like stock options or fees back — that increase dramatically during the period.
3. This is the case when banks use securitization, which allows them to do business on trading markets while extending their volume of credit. To quote from an interview with John Reed – former chair and chief executive of Citycorp and Citygroup – in the Financial Times of September 9, 2013 : “when trading was small in proportion to everything you could have a group of high bonus professionals that you treated
bly to respect the homogeneity of the accounting framework in other economic sectors (the calculation of VA does not take into account income from property or from capital gains in other sectors), banking income measures intermediation in a broad sense. For that reason, we should not rely only on a national accountant’s perspective to address the issue of financial services consumption.
I use two different indicators of the consumption of financial intermediation services, in this regard. I first take the “plain” value-added series calculated by the national accountant. Second, I address the issue revealed by Stauffer (2004) using a bank’s perspective of income
using OECD data on banking income4
. Because the data does not cover the whole considered period, I use the average growth rate of the difference between banks value added and banking income to extend the series to 1950. So as to measure financial income I simply add insurances and other intermediaries value added to banking income. I call this series ‘corrected value added’ or ‘corrected VA’.
1.2
Financial industry output
Financial output is supposed to account for all services provided by financial interme-diaries. The calculation includes transfer of funds and liquidity services. Because financial intermediaries create and manage assets to provide financial services, the easiest way to mea-sure the total production of financial services intermediated is to sum real financial assets
intermediated (Philippon 2012).5
Two questions emerge about this calculation. First, what is a real intermediated asset ? Second, is the calculation able to take all kind of financial
differently and it didn’t affect the culture of the whole organization. As trading becomes more important then it becomes harder and harder to keep those cultures separated. And it began to work into the risk-taking culture as well. Risk officers would say to someone who wanted to make a loan : ‘I dont like this credit. We aren’t going to do it. Stop. Period. But now they would recognize that if a certain transaction didnt go through, his colleague wasn’t going to be paid that year. It became very difficult to say ‘Sorry. Dont do it. Your colleague was being compensated for doing transactions... It became infectious. (...) These cultures don’t mix well and one tends to push out the other (...).”
4. Along with differences vis-a-vis capital income, it is worth noting that some charges are excluded from the VA but included in banking income. Those charges are mostly related to the definition of intermediary consumption. However those charges represent a small a constant part of banking income, at least in Germany and France for which data helps do this calculation.
5. Philippon (2012) estimates the financial output compiling two different estimations. The first estimation is the one used in this paper. The second estimation use the flow of credit, money and security issuance. I do not use this method here due to data availability issue. It is however worth noting that both estimations are very similar in Philippon’s study. There is thus no reason to think that this simplification could bias the results.
services into account ?
A real intermediated asset is an asset that provides a financial service to non-financial industry customers that must be intermediated. The real assets are intermediated because they require the intervention of a financial intermediary at the moment of their creation and thereafter during the course of their life. For example, in making a loan to a business, a bank creates a debt that it manages until its term is reached. In return, this debt appears in the form of deposits or securities – after securitization – whose management also depends on financial intermediaries. Thus, the volume of services produced by the finance industry coincides with the volume of intermediated real financial assets. These assets are loans, transferable securities (stocks and bonds), public debts and the money supply in the broad sense. The loans, public debts and transferable securities corresponds to the activity of the transfer of funds ; the indicator of broad money corresponds to the service of liquidity, including the creation of liquid assets in the parallel banking sector that operates outside banking regulations. The sum of credit and market capitalization accounts for both supply and demand sides of the transfer of funds services. Insofar as financial assets are most often owned by asset managers, capital management service is captured by the calculation (see discussion in section 4.3). Because credit entails monitoring and screening services, and because market capitalization is related to the emission of securities, both series capture financial services related to capital provision.
The calculation does not add derivatives for three reasons. First, derivatives “derive” from real financial assets. These contracts are of zero net supply. Second, although derivatives help spread the risk, this service is already indirectly taken into account. In fact, the positive effects of risk management are supposed to include that it increases the volume of financial services (e.g. the amount of domestic credit) and reduces borrowing costs. In both cases, it is accounted in the output calculation and in the corrected VA. Third, the liquidity service related to shadow banking, if any, is captured by broad money aggregate that account for shadow banking risk-free asset creation.6
Lastly, some derivatives are supposed to provide a direct service to the economy especially through risk management — e.g. interest risk management through plain vanilla swaps. This represents less than 10% of all derivatives in
6. As theoretically explained by Gorton and Metrick (2012) and Sunderam (2012), shadow banking liabi-lities constitute substitutes for money. In particular, repos and money market funds share might be seen as shadow deposits. This is why I use M3 monetary aggregate to account for shadow banking risk-free assets. However, it is worth noting that the money service provided by shadow banking assets remains inferior to deposits and decreases with size. Shadow banking assets are not government guaranteed and rely on more volatile secondary markets. In addition, the money service declines with the quantity of shadow banking assets produced, as they tend to be backed by riskier assets.
2007 according to the BIS. Based on ISDA data, 10% of the world ‘gross credit exposure’ — that is, gross market value of derivatives (total OTC) after netting, which reflects the
amount of risk managed through derivatives — corresponds approximatively to B✩ 330, that
is, less than 0.5% of European total asset intermediated. Therefore, ignoring such services does not have any effect on the series.
So as to compile financial assets into one synthetic series it is important to account for assets intensity of intermediation. Because such information is hard to obtain quantitatively, I do the hypothesis that each asset has the same intensity of intermediation, normalized to unity, except in the case of public debt which is discounted by a factor ten7
. By the same token I assume that it is as intensive to provide one euro of financial service today as 50 years ago. This hypothesis is, however, conservative as financial innovation tends to reduce the incentive for financial intermediaries to screen and monitor borrowers. Because those assumptions may affect the results, I discuss their potential effects on the shape of the unit cost curve in section 2.5 and section 3.4.8
1.3
The unit cost of financial intermediation
Given both parts of the calculation (domestic consumption of financial services and finan-cial output), the unit cost (z) of finanfinan-cial intermediation is obtained through the following formula :
z = f inancial consumption
credit+ money + capitalization + 0.1debt
According to the indicator of financial consumption used in the calculation, two different series are produced. The first one, use corrected financial VA and is simply called ‘unit cost’ ; the second one use plain financial VA and is called ‘plain unit cost’.
It is finally worth noting that because the unit cost calculation entails numerous sources, details on series calculation and sources are provided in the data appendix joined to this paper.
7. In fact, government debt is weakly intermediated, although debts must be traded and generate duration risk (Philippon 2012). It is therefore assumed that the management of public debt is less intensive.
8. It is however worth noting that price series in traditional industries rarely account for goods quality. For instance, we all know that the average price of a meter squared in Paris, London or New York has dramatically increased over the past 20 years. But this information does not account for real estate quality improvement. By the same token, Paris’ average meter squared price does not make any distinction between ‘in front of the Louvre’ flat and ‘in front of the train tracks’ one.
2
Three European cases : Germany, France and the
UK
Because Germany, France and the UK account for more than 60 per cent of European GDP throughout the period under study, it is important to examine the specific evolution of the unit cost in those countries.
2.1
Germany
2.1.1 German bank-based system, some historical facts
Bank-based financial systems are characterized by the role of banks in capital allocation (Allen and Gale 2001). Germany is often considered the prototype of bank-based financial systems, with particularly powerful banks.9
Along with the role of banks in capital allocation, Germany is also known for its so-called universal banks. The main characteristic of universal banking is that it follows companies all along their live, thanks to the scope of its financial activity. The costs and advantages of universal banking are hard to assess, though, depending crucially on regulation and on trade-offs between competition and stability (Carletti and Vives 2009). While universal banking may have ambiguous effects on risk taking, it is often argued that it decreases competition and increases the cost of financial services. Nevertheless, two points must be taken into account while considering the “universal” nature of German banks. First, financial markets were weak throughout the second half of the twentieth century (see figure 2.1.2 below) ; unlike in the US and the UK, the scope of bank activity in Germany was hampered by the difficulty of acting in financial markets, at least before the reforms of the 1990s. Second, as documented by Fisher and Pfeil (2004), business activities are highly separated among banking institutions. In particular, investment banking has not been a significant area of business for most saving and cooperative banks, so, universal banking in the modern sense – that is, banks doing business in both retail and investment banking – concerned only a small number of large commercial banks (Deutsche Bank, Dresdner Bank and Commerzbank) rather than German banking as a whole before the mid-1990s. The German bank-based system was, until twenty years ago, mostly characterized by banks whose role was to collect deposits and provide credit.
Whether regulation helped to shape or was dependent on this financial system is hard to know, but the Bundesbank was a fervent defender of the financial system status quo.
Be-9. As documented by Vitols (2003), the proportion of banking system assets total financial assets in 2003 are 74.3 per cent in Germany and 24.6 per cent in the US.
cause of its anti-inflation policy, the central bank was comfortable with the existing financial system as it assisted its monetary policy objectives. Indeed, because the financial market can generate monetary instability, the Bundesbank feared losing control over monetary po-licy. As a consequence, financial reforms occurred later in Germany than in other European countries.
Although Germany was less regulated than other OECD countries till the 1980s10
, the liberalization of the German financial system began slowly, with the abolition of the “gent-leman’s agreement” in 1985. The possibility of a foreign financial institution being a lead underwriter of DM-denominated issues of foreign entities was a first step toward more com-petition. Nevertheless, because financial markets had been weak till the 1990s, the wave of deregulation and liberalization created by the European Directive of 1992 (implemented in 1994) on developing financial markets had important consequences on the development of market activities. The full effects of the reforms are not clear, however. It appears that the German financial market, in particular, did not experience the success that reformers ex-pected. Although IPOs increased quickly after the creation of the neuer market, this proved to be short-lived ; it was declared a failure in 2003. In addition, the distribution of German financial system liabilities by type of financial institutions barely changed between 1993 and 2003 (Vitols 2003), with banks keeping high market share despite the liberalization. On the other hand, bank deposit margins – that is, the difference between money-market rates and rates for time and savings deposits of equal maturity – decreased significantly with the ope-ning of money market funds in 1994 (Domanski 1997 and Fisher and Pfeil 2004). However, this decrease might have been more than compensated for by new income, which evolves in proportion to assets managed and brings about capital income.
2.1.2 Financial consumption and financial output
One of the main problems in evaluating financial costs in Germany stems from the way banking income data are provided. Whereas the evaluation must account for domestic activi-ties, the OECD data relies on German banking activity both in Germany and abroad. Since the data account for the subsidiaries of foreign banks but exclude the foreign subsidiaries of German banks, we can simply assume that foreign banks have to create subsidiaries in order to access the German market and vice versa.
Figure 2.1.1 plots the evolution of GDP share of finance in Germany with both plain financial VA and with its corrected estimation adding banks’ capital income. In both cases, the GDP share of finance increases over the covered period. Moreover, the figure shows that
using banking incomes in the calculation has no impact on the shape of the curve before 1992, that is, until after the second European banking directive liberalizing market activities. After that year, the series diverge increasingly.
Figure 2.1.2 plots the ratio of financial output to GDP in Germany per type of assets. We can see that credit – of which almost the entire part is composed of bank loans – is the major source of financial output in Germany throughout the period, confirming the bank-based character of the German financial system. Most of the increase that occurs after the mid-1990s is due to post-EU 1992 directive on market capitalization. This confirms the new orientation of German financial system, although, as argued in the preceding paragraph, this does not mean that non-bank financial intermediaries kept banks out of financial market business.
2.1.3 The unit cost in Germany
Figure 2.1.3 plots the unit cost of financial intermediation depending on whether or not bank capital income is used in the calculation. This figure shows that overall, the unit cost increases when banking incomes are included. Because Germany is a bank based financial system I also plot the ratio of banking income to total credit as a robustness check. Indeed, as argued in section 2.1.1, financial liberalization in Germany has not produced dramatic modification of the financial system. Figure 2.1.4 shows that such alternative measure of the unit cost does not have any effect on the result. It appears in both measures that the unit cost remains fairly constant from 1970 to today, suggesting that financial reforms, although not as tough as in France and the UK, did not have any impact on the cost of intermediation. This puzzle is all the more salient since the ’plain unit cost’ increased during the 1970s then decreased in the 1990s, returning to its 1960’s value. This result suggests that similar forces have pushed up both unit cost and plain unit cost in the 20 years following 1970. On the other hand, those forces seem to have vanished in the 1990s, thereby reducing plain unit cost. High unit cost values during the 1990s should thus be explained by factors asymmetrically affecting the unit cost and the plain unit cost after that date. As is shown in section 4 below, increases in nominal rates of interest during macroeconomic turmoil explain very well the rise in the unit cost before the 1990s. When nominal rates decreased, the plain unit cost decreased too. On the other hand, the unit cost remained high after that date. Because the difference between plain unit cost and unit cost series arises from capital incomes, those incomes – and all things promoting their development -- might have been responsible for the unit cost remaining high.
2.2
France
2.2.1 The French financial system after WWII : from the state to the market
The French financial system was subject to numerous evolutions in the second half of the twentieth century. From the Reconstruction to European monetary union, it had to adapt continuously to new economic and political agendas. From the end of the WWII to the early 1980s, the French government was broadly active in credit markets. Commercial banks sup-plied short and middle-term credits, while semi-public institutions (Cr´edit National, Caisse des D´epˆots, etc.) provided long-term loans. The control of long-term credit was an element of the strategy of coordination that the French government pursued to accelerate econo-mic recovery. The related semi-public banking system, with the French Treasury at its core, thus aimed to encourage investments in strategic sectors to spur economic growth (Monnet 2012a and Quennouelle–Corre 2000 and 2005). At the same time, the Bank of France ai-med at controlling inflation and stabilizing the franc against the dollar. The discount rate followed the FED rate to prevent capital movement, while credit controls were used to ma-nage inflation (Monnet 2012b). However, this strategy generated some market distortions. In particular, it discouraged competition, kept alive inefficient banks and created rents for incumbents. The financial system was not without consequences for the development of fi-nancial markets, either. The availability of low-cost credit discouraged firms from issuing securities for their investment (Marnata 1973) while the private sector was too small to provide the depth that the financial market needed to function correctly (Hautcoeur 1996). During the 1970s, it became evident that the institutional environment inherited from the Reconstruction and the Bretton Woods era was not adapted to new circumstances. First, economic openness and the end of Bretton Woods changed dramatically the international equilibrium. National institutions had to adapt to a new set of constraints, which contribu-ted to monetary instability (Loriaux 1991). Second, inflation grew too high to be ignored by the French government. In order to tackle inflation and monetary instability, the Bank of France was urged to put a permanent cap on commercial bank lending (’encadrement du credit’). However, the crisis of 1973 and its consequences for firms’ profitability encouraged the government to intervene even more in the credit market. Thanks to subsidized loans, para-public banks – under control of the Treasury – were encouraged to extend their credits to support private investment and export. Because those banks were not subject to the Bank of France ’encadrement’ policy, subsidized loans progressively crowded out commercial loans. The contradiction between the objectives of the Bank of France and those of the govern-ment exacerbated inflation (Blanchard 1997) and damaged the allocation efficiency of credits (Bertrand et al. 2007). In addition, firms became so highly indebted that new solutions had
to be found to restore their financial health and profitability. The set of constraints that pre-dominated in the early 1980s thus encouraged the structural reform of the financial system. Last but not least, because of public debt increase, the government found advantageous to open financial markets.
The related deregulation and liberalization were not instantaneous though, and it was not until 1984 – after the failure of the nationalization of the banking system – that Laurent Fabius’ center-left government carried out a significant deregulation of the financial system which impacted on both financial and intermediaries markets. The reforms of 1984 and 1986 encouraged direct funding on the market, while the banking reform act of 1985 increased bank competition and transparency (Lacoue–Labarthe 2001). The wide-ranging privatization reforms also gave the depth that financial markets needed to work more efficiently. Firms and investors were all encouraged to “play” on financial markets, since securities turned out to be readily tradable. The so-called “disintermediation” of the financial system was the most visible consequence of this structural change.
2.2.2 Financial consumption and financial output
As for Germany, although OECD data cites French bank activities in both France and abroad, banking income data include the subsidiaries of foreign banks in France but not the foreign subsidiaries of French banks. I therefore do the same hypothesis as for Germany. Based on Fournier and Marionnet (2009) analysis, this hypothesis seems unproblematic.
Figure 2.2.1 plots the evolution of GDP share of finance in France either with plain financial VA or with its corrected estimation that adds bank capital income. In both cases, the finance sector share of GDP increases over the covered period. The figure shows that using banking incomes in the calculation has no impact on the shape of the curve before 1990. After that, the ratio of financial VA to GDP decreases while the ratio of corrected financial VA to GDP continues to increase. It is also worth noting that, unlike in Germany, the difference between both series was already high in the 1980s. However, this might be due to the conservative hypothesis I do to extend the banking income data before 1988 (see on line appendix for details).
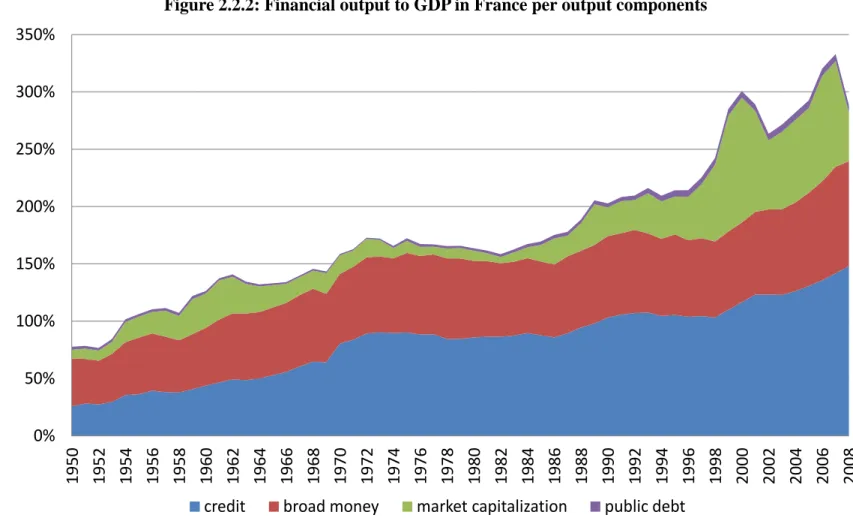
Figure 2.2.2 displays financial output. As in the German case, credit accounts for a large part of the financial output in France from the late 1960s to the early 1990s. Before the 1970s, liquidity management was the most important aspect of financial intermediation. The 1984-86 reforms show clearly in the data as the weight of market capitalization increases significantly in the 1980s. Unlike in Germany, market capitalization is not the only variable explaining post-1990s financial output increase in France. In fact, credit and broad money
rose rapidly throughout the last 20 years of the sample. This is typical of blurred financial systems where bank-based and market-based businesses are tied closely together.
2.2.3 The unit cost in France
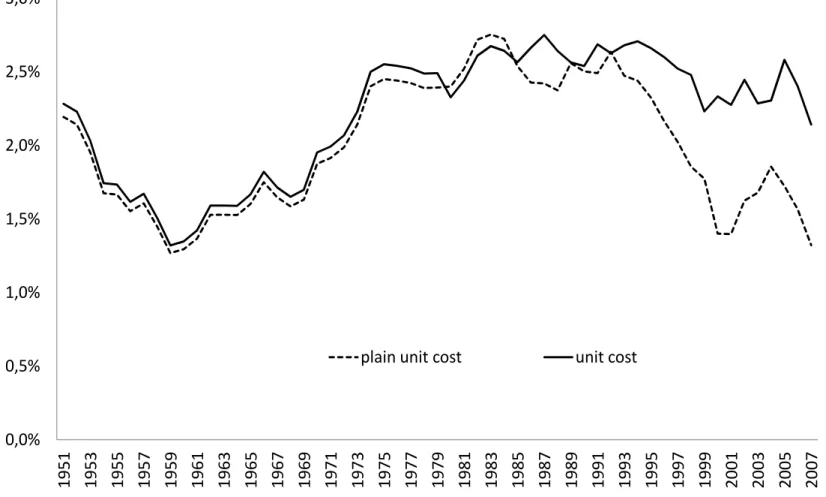
Figure 2.2.3 plots the unit cost according to whether bank capital income is included in the calculation or not. It shows that the unit cost is stagnant overall when capital incomes are used but decreases otherwise (plain unit cost globally decreasing). Interestingly, we see that the post mid-1980s unit cost decreases, suggesting that, unlike in Germany, financial deregulation might have reduced financial costs in France. In fact, credit control and subsi-dized loans during the 1970s may have helped French banks to make rents (Monnet 2012a). This is all the truer since firms could not turn their back on the banks because financial markets were not sufficiently developed to offer alternatives to bank loans. For that reason, because credit control and subsidized loans are mostly used in France from the late 1950s to the early 1980s, the higher unit cost observed in France compared to other countries before the 1990s is not highly surprising.
2.3
The UK
2.3.1 The UK market-based system, some historical facts
The UKs financial system did not follow the same path as the French and German ones. Although financial regulation was tough till the 1970s, the UK financial system allowed more room for financial market activity. Firms could obtain long-term funds on the market, while banks helped enterprises in their need for short-term liquidity. The financial system was less centralized than in France and Germany despite financial intermediaries that behaved much like a cartel. The Bank of England had to comply with government economic policy and exchange controls. Its rates movement was mainly used to maintain sterling value while not jeopardizing government borrowing (Monnet 2012b). Like the Bank of France, the Bank of England resorted to credit ceilings to achieve its monetary objectives. So as to cope with new economic constraints (especially the development of international trade and inflation), the 1971 reform was the first attempt to deregulate the post-war financial system. The new approach called Competition and Credit Control (CCC) aimed at promoting competition among banks and used interest rates to control monetary growth and inflation. This reform was tailored to suppress credit ceilings and restrict banks so-called rents. However, it proved to be a monetary failure. By relaxing some of the previous lending constraints, the CCC encouraged financial institutions to increase their credit considerably, thereby increasing the
amount of outstanding money and inflation. The Bank of England reacted at the end of 1973 with the Supplementary Special Deposit (SSD), a device forcing banks to make non-interest-bearing deposits with the Bank of England whenever their non-interest-bearing eligible liabilities grew too great. Nevertheless, the SSD did not prevent the banking crisis of 1974, and economic troubles and inflation continued to plague the economy, due to the 1973 petroleum crisis. The sterling crisis of 1976 then led the government to adopt monetary targets (Davies 2012) that remained in place for two decades.
The end of exchange control under the new conservative government of Margaret That-cher was a major change. This rupture helped the application of monetarist principles. Along with the privatization of the economy and the reduction of state spending, the government aimed to control inflation through monetary policy. Furthermore, the big bang of 1986 put an end to fix commission and brokers single capacity, encouraging market funding and fi-nancial innovation in an increasingly internationally competitive environment (Michie 1999). Freed from previous restrictions, financial intermediaries started to deal with new financial market businesses. This encouraged universal banking business, wherein economies of scope helped banks to grow rapidly and to concentrate. The ‘small bank crisis of 1991-94 marked a rupture. Many small banks collapsed thanks to their ineffective efforts to mimic the US model of investment banking in a highly deregulated and globally competitive environment (Logan 2000). The activity of Wall Street investment banks squeezed both merchant bank resources and profits. The restructuring took many years — especially after the UK’s short-lived commitment to the European Monetary System (1990-92) – and it was not before the 2000s that the UK financial system really stabilized. The stabilization came, however, at the cost of financial enterprises passing into foreign hands ; between 1995 and 2000, a large part of the investment banking sector was sold to overseas owners (Roberts 2005).11
Nevertheless, the legal framework of UK financial market activity proved to be so attractive that London became a central hub of the world capital market, thereby attracting capital from around the world and redistributing it to its best remuneration in the UK and abroad.
11. To quote Roberts (2005) : “As the investment banking business globalised, the UK merchant banks found themselves struggling because of the huge advantage enjoyed by the US firms, whose domestic market constituted half the world market. (...) [T]he sales of UK merchant banks in the 1990s were shrewd cash outs at the top of the market cycle from an industry which had been artificially cosseted by barriers to entry and cartel-like practices. (...) ”. In other words : “By the beginning of the twenty-first century more than half of the Citys workforce worked for foreign banks or foreign financial firms, and amongst the top international investment banks not one was British. It was a state of affairs sometimes compared to Wimbledon tennis tournament, for which the UK provides the venue and sells the strawberries and cream but where most of the players, and winners, are foreigners”.
2.3.2 Financial consumption and financial output
Accounting for financial costs in the UK is difficult because of the increasing role played by the London financial market : it is hard to separate domestic from international financial services. The first thing to do is to control for trade balance of financial activity, but this is not sufficient to account for capital gains made by UK banks abroad. I therefore make the conservative hypothesis that the share of domestic capital gains is the same as the share of domestic financial VA. It is also worth noting that banking income data account for largest
banking group12
activities in the UK and abroad. While the data does not account for foreign banks business in the UK, it does include the overseas activities of UK banks. Therefore, the fact that the UK banking system is highly concentrated may help to account for the many activities of bank subsidiaries, especially market activities that are most often declared in tax havens.
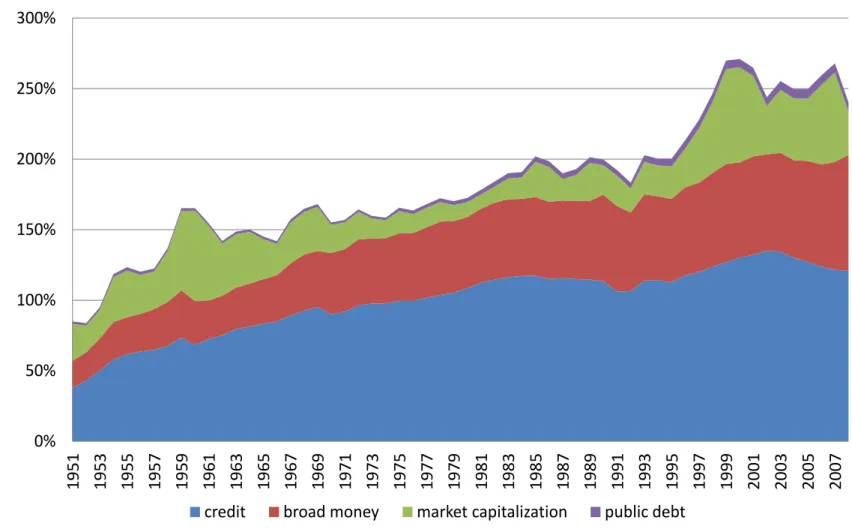
Figure 2.3.1 plots the GDP share of finance, using financial VA in its plain and corrected forms. It shows that the GDP share of finance increases overall during the period. It also shows that a major change occurred in the early 1980s, that is, after the financial reforms of 1979. This is evidence of the impact of the liberalization and deregulation of the UK financial system on the increasing role role played by the financial industry. A comparison of the two series shows that corrected financial VA tends to move away from financial VA in the late 1990s, that is, with the boom of credit and securitization.
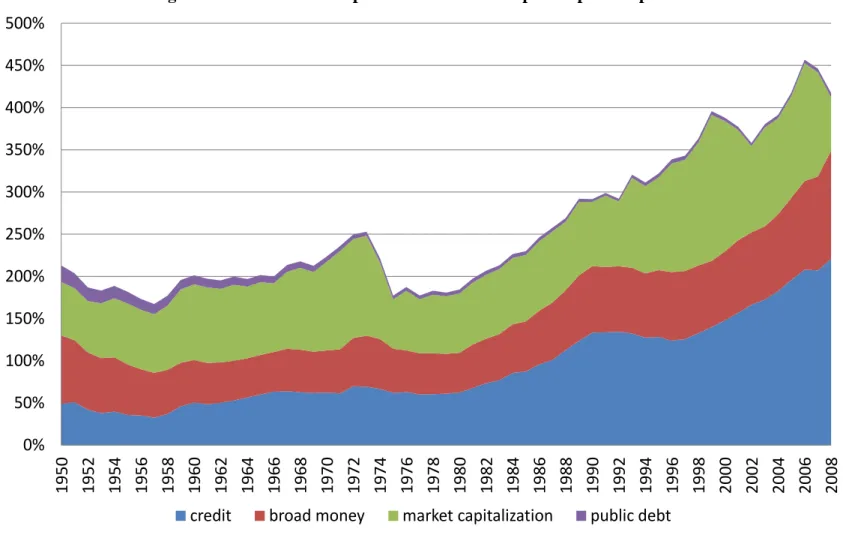
Figure 2.3.2 plots the GDP share of financial output. The UK financial output increases at the same pace as GDP till the early 1980s. After that, this ratio increases steeply until 2008. Unlike in Germany and France, the role of market capitalization is very important throughout the covered period, so that credit development – in particular, banking credit – helps to explain most of the financial output increase over the last 30 years of the period. Interestingly, the credit development inflection point corresponds to 1979. As in France, credit volume and market capitalization increase together after the mid-1990s, thereby feeding each other. This is why the financial output share of GDP reaches the astonishing value of 457 per cent in 2006, with credit explaining 45 per cent of financial output compared with 34 per cent in 1979.
12. Barclays Group ; Bradford and Bingley Group (included in the coverage starting 1999) ; HSBC Bank Group ; Lloyds Banking Group (comprising the former LloydsTSB Group and HBOS Group, included in the coverage starting 1996) ; Northern Rock Group (included in the coverage starting 1997) ; Santander UK Group (including the former Abbey National Group, the Alliance and Leicester Group, included in the coverage starting 1996) ; Royal Bank of Scotland Group. Prior to 1996, the Standard Chartered Group was included.
2.3.3 The unit cost in the UK
Figure 2.3.3 plots the unit cost according to whether banking incomes are included in the calculation or not. It shows that the unit cost increases overall when banking income is used in the calculation. However, the plain unit cost increases during the 1970s then decreases in the 1990s to come back to its 1960s. It is worth underscoring that the shape of the unit cost follows specific historical facts. First, the increase occurring from mid-1970s to early 1990s corresponds to the period of deregulation but also to the Bank of England’s monetarist policy. Second, the decrease during the 1990s corresponds to banking restructuring. Third, the increase following 2000 is characterized by the development of originate-to-distribute finance following financial innovation, along with the rebirth of London as a first order financial center.
It is important to note that the plain unit cost decreases during the 1990s, moving away from the unit cost. Like in the German case, it appears that nominal rates of interest explain quite well the evolution of the unit cost till 1990 (see section 4). Therefore, the unit cost increase we can observe after 2000 might be related to bank capital income increase too.
It is finally worth noting that the international character of the UK financial industry makes the unit cost calculation difficult. Unlike France and Germany, whose financial in-dustries are highly domestically focused, the UK financial industry depends increasingly on international capital and activities. Due to the difficulty to disentangle national from international businesses in the data, the overall analysis of the unit cost tends to be less precise.
2.4
Accounting for banks capital income in the US
Because Philippon (2012) does not account for bank capital income, this section proposes to “correct” the US estimation of the unit cost. Hence, I merely substitute VA in banking for banking income. Because data are not available before 1980 I use the same process as for Germany, France and the UK, to extrapolate the series from 1950 to 1980.
Figure 2.4.1 plots the GDP share of finance using plain VA and corrected VA. We see that the series move away from each other during the mid-1980s but remain stable thereafter. Unlike in European countries, accounting for capital gains does not greatly affect the US series. This is probably due to the lesser importance of banking in the US financial system. As a comparison, while the financial VA share of the Federal Reserve bank, credit intermediation and related activities decreases from 51 per cent in 1978 to 45 per cent in 2007 in the US, the financial VA share of banking goes from 75 per cent to 68 per cent in Germany.
Figure 2.4.2 plots the unit cost of financial intermediation in the US using both corrected VA and plain VA. Although the unit cost is a little higher from the mid-1980s to 2007, the general shape of the curve is not really affected by the correction of the series. Philippon’s main finding thus remains.
2.5
Comparing national series
To give a broader view of the co-evolution of national unit costs, figure 2.5.1 plots all national series calculated hitherto. This figure also adds the US unit cost calculated by Philippon (2012). Although national unit costs evolve in a quite similar way over the period – increasing during the 1970s and stagnating thereafter, with the exception of France, where it decreases after 1990 – differences can be substantial across countries. However, the series tend to converge progressively over the period (figure 2.5.2). The US unit cost is close to the mean value, suggesting that the US case is “normal”. On the other hand, the French unit cost appears far higher throughout the covered period. The end of credit control and subsidized loans devices in the 1980s might explain why the French unit cost decreases after the 1990s while it overall stagnates in other countries.
Comparing national series can also help us deal with the hypothesis made about financial asset intensity of intermediation. Using simple econometric devices it is possible to look at the effect of the output share of each kind of financial asset on the unit cost. The mechanism is the following : if the intensity of intermediation of one kind of asset is underestimated, an increase of its output share should reduce the unit cost. For example, assume that the intensity of intermediation of credit is higher than one — that is, higher than the intensity of intermediation of equities and broad money —, any increase of the output share of credit should impact positively the unit cost due to misspecification. Therefore, if the output share of credit increases in a country A but not in a country B we should observe an increase of the unit cost in A but not in B. This is the effect econometric analysis helps account for. Let’s first compare the case of Germany with the case of the US to understand the logic at stake. The output increase occurring after 1990 in Germany is due to market capitalization while the output increase in the US is due to credit. Insofar as we do not observe any impact of those shifts on the unit cost either in Germany or in the US, we cannot reject the hypothesis stating that the intensity of financial assets is the same for credit as for equities. This is what confirms the OLS-within regression including all four countries of interest plus Italy and Spain for which data is available from 1970 to 200713
. Regressions cover the whole period
13. Two things must be added in this respect. First, I do not provide full analysis of Spain and Italy unit cost series precisely due to data availability issues before 1970. Pre-1970 data is indeed essential to account
and two sub-period lasting from 1950 to 1990 and from 1991 to 2007. Table 1 shows that the explaining variables are not significant whatever the period used for the analysis. This tend to confirm that the hypotheses made about financial assets intensity of intermediation do not bias the results either before 1990 or after 1990.
It is finally worth noting that national unit costs converge around 2 and 2.3 per cent after the liberalization of capitals movement occurring in the 1980s. This coincides with alternative measure of the cost of financial intermediation in the US (see Mehra et al. 2011 and Gennaioli et al. 2013). In other words, in all four countries for which the unit cost has been calculated, it costs about 2 and 2.3 cents to create and maintain one monetary unit of financial asset in 2007.
3
Estimation of the European unit cost
So far, this study has focused on national series, thereby ignoring banks foreign activities. However, the national view does not account for all European financial business, especially in the case of the UK, which exports many financial services to other European countries. Calculating the unit cost for Europe avoids this problem.
To obtain the indicator of the unit cost of financial intermediation for Europe additional hypotheses are needed. This section provides two different methods of calculation. The first uses the sum of the countries corrected value added divided by the sum of their financial output. The second method uses the weighted sum of countries unit cost based on the share of each country in the total GDP. In both cases, the international activities of financial intermediaries are captured in the calculation. Those activities are assumed to be provided in favor of other European countries. In other words, Europe is seen as a closed economy, in which financial activities are unequally spread over its individual parts. This point is particularly important in the case of the UK since the calculation now accounts for its positive financial intermediation trade balance. Nevertheless, because banking income data do not always account for banks overseas activities, the aggregate corrected VA can be either overestimated or underestimated. It will be underestimated if the data does not capture such activity in countries that export a lot of financial services. It will be overestimated if the data accounts twice for banks off-shore activities, in countries exporting and in countries importing financial services. Finally, it is worth recalling that the data are not systematically available
for the effect of the 1970s rupture. Second, as shown in the next section of the paper some data exists for the Netherlands too. I do not account for this country here as banking income data seem abnormally high after 1990. However, including the Netherlands into the data do not change the results.
for all European countries so the calculation includes only Germany, France, the UK, Italy, Spain and the Netherlands. This simplification is unproblematic because these countries
account for almost 85 per cent of Europe’s GDP throughout the period under study.14
Since data is not available before 1970 for Italy and Spain, nor before 1961 for the Netherlands, the unit cost is estimated with the remaining countries before those years.
3.1
Method 1 : Summing national series
In this subsection, the unit cost of financial intermediation is estimated using the sum of countries corrected value added divided by their financial output. Three different calculations are proposed. The first (“Europe 1”) takes all the countries of the panel (Germany, France, the UK, Italy, Spain and the Netherlands) into account and runs from 1970 to 2007. The second (“Europe 2”) takes Italy and Spain out of the equation and runs from 1961 to 2007. The third calculation (“Europe 3”) takes out Italy, Spain and the Netherlands, and runs from 1951 to 2007. Due to data restrictions, the final European series is estimated using “Europe 3” from 1951 to 1961, “Europe 2” from 1961 to 1969 and “Europe 1” from 1970 to 2007. Comparing the three series also helps assess the robustness of some of the hypotheses used to estimate the European unit cost. It helps to know first, whether data unavailability before 1970 biases the series and second, whether the series is over- or underestimated. While Germany, France and the UK use a “parent view” (activities of national banks and foreign subsidiaries in the country) of banking income, Italy, Spain and the Netherlands use a “country view” (banking activity inside country regardless of the national origin of the banks). If those differences are significant, then the series should diverge significantly.
In order to gauge the robustness of the final series, let us look at the evolution of the ratios of the corrected financial VA to GDP and financial output to GDP. Figure 3.1.1 shows the results of the ratio of the corrected financial VA to GDP using all types of calculations. The three calculations provide close results. Overall, the ratio displays an increasing trend throughout the period as the GDP share of financial income equals 2.2 per cent in 1950 and 8.3 per cent in 2007. Similarly, figure 3.1.2 plots the ratio of financial output using all three calculations. Results are also very close, whichever set of countries is used in the estimation. The ratio increases slowly before the 1990s and exponentially thereafter. In both figures 3.1.1 and 3.1.2, the series are almost the same whatever type of calculation is used. Therefore, the hypotheses used to estimate the European unit cost before 1970 should not have distorted
14. It is worth noting too, that Luxembourg and Ireland, countries in which financial activity is particularly important because of their tax-haven status, are not included because of data problems. As a consequence, the European unit cost estimation might have been undervalued after 1990.
the results. This result is not really surprising as Germany, France and the UK account for the largest part of all six countries’ GDP all over the period. Finally, figure 3.1.3 plots the unit cost of financial intermediation using all three calculations. As with the previous results, the series prove to be very similar. The set of selected countries used in the calculation seems not to distort the estimation of the European unit cost.
Figure 3.1.3 shows that the unit cost of financial intermediation increases throughout the considered period. A sharp rise occurs during the 1970s and the 1980s – that is, during the period of restructuring of financial systems and macroeconomic troubles. The unit cost then tends to decrease during the second half of the 1990s and increases again after 2000. Overall, the unit cost never returns to its initial level of the 1960s, demonstrating that it is costlier to obtain one unit of financial service today than it was 50 years ago. Indeed, it cost 1.4 cents to create and maintain one euro of financial asset in 1960, while it cost 2.4 cents to create and maintain one euro of financial asset in 2007. In other words, given that I did not control for the evolution of the intensity of intermediation of financial assets, for the unit cost to be the same in 2007 and 1960, the overall intensity of intermediation needs to be 71% higher in 2007 than in 1960. Based on the results obtain in section 2.5, this turns out to be improbable (see also the discussion in sections 3.4 and 4.3 below).
Nevertheless, some questions might be raised about this conclusion. In particular, it could be argued that the series are not homogenous. In order to address such potential criticism, another method of aggregation is proposed.
3.2
Method 2 : the country-weighted view
In this section, the unit cost of financial intermediation is estimated using the weighted sum of countries unit costs based on the share of each country in total GDP. The series is built using Germany, France and the UK from 1951 to 1960 ; it adds the Netherlands from 1961 to 1969, and includes all selected countries after 1969. Figure 3.2.1 plots this new series along with the series calculated using the first method. It shows that differences between the two series are small. There is thus no evidence of bias related to aggregation methodology.
Because the results are very similar regardless of the method used for the calculation, it is possible to deconstruct the financial output per type of financial asset without the risk of generating misleading facts. Figure 3.2.2 shows that the distribution of financial assets in Europe is not greatly different today than it was in the 1960s. In fact, the relative size of each component did not change dramatically except in 1970s and 1980s, because of a reduction in market capitalization. This is an important fact, as value differences between 1951 and 2007 unit costs barely depend on the relative weight of each series in the financial output
calculation.
3.3
Comparison with the US unit cost
In order to ensure the robustness of this calculation, it is useful to compare the European unit cost with the US one, calculated in section 2.4. In addition, comparing these series using banking VA in lieu of banking income provides new clues about the effect of capital income on the shape of the unit cost curve. The “plain” unit cost is calculated using the first method - that is, with the ratio of the sum of selected countries’ VA to the sum of selected countries financial output.
Figure 3.3.1 shows that European and US unit costs follow a very similar path over the period. Both increase during the 1970s and reach a plateau in the 1980s. The European unit cost appears slightly higher from the early 1970s to the mid-1990s, then joins that of the US in the late 1990s.
Comparing European the US “plain” unit costs provides interesting facts, too. In particu-lar, figure 3.3.2 shows that both series follow the same path until 1990 but diverge thereafter. This is evidence of the increasing role of bank capital income in European financial inter-mediary business. The deregulation of financial systems seems thus to have increased bank capital income in larger extent in Europe than in the US. This result is probably due to the fact that the financial system depends dramatically more on banks in Europe than in the US. Because financial wealth management depends on mutual funds business, financial wealth management income in the US is largely accounted by financial VA through fees. This is not the case in most European countries (even in the UK), where financial wealth ma-nagement income emerges due to banks’ capital income. Therefore, national accounts must underestimate financial VA the higher as banks dominate financial intermediation.
3.4
Robustness check and quality adjustment discussion
Because the way banking income is estimated in the UK accounts for all UK banking group business, including their overseas subsidiaries, overlapping data with other European series could overstate the European unit cost.15
Hence, the unit cost was calculated using UK plain financial VA instead of banking income. This prevents the calculation from taking UK
15. It is worth noting, however, that the UK series does not account for foreign bank activity in the UK. This therefore underestimates the corrected VA and might compensate for any overestimation. In addition, because Luxembourg and Ireland are not included in the calculation, the estimation is naturally biased downward.
banks’ capital income into account, thereby understating the unit cost. Figure 3.4.1 shows that, despite such underestimation, the European unit cost still increases over the covered period. A small difference emerges with regard to the initial estimation after 1999, probably due to the boom of financial market activities and banks’ capital gains in the UK after that date.
Since insurance companies also provide non-financial services to their client, I exclude
insurance VA16
from the calculation. Based on the preponderant role played by banks and insurances companies in European countries’ financial systems, withdrawing insurance VA from financial consumption is akin to look at banking income only. This robustness check is not too restrictive in the case of Europe since banks represent by far the largest part of the financial intermediation business. Figure 3.4.2 shows that the shape of the unit cost is left unchanged when insurance VA is not taken into account, thereby confirming that banking incomes increase more rapidly than the financial output.
The weight attributed to each series composing the financial output does not affect the result, either. I compare the evolution of corrected value added with the evolution of each single series used in the output calculation. In all cases, the ratio of corrected VA to the volume of selected asset increased over the period. Because the relative size of market ca-pitalization diminished dramatically in the 1970s and ’80s, and because financial market activities were not particularly active in Europe during that time, except in the UK, I plot an alternative unit cost, which ignores market capitalization. Because this unit cost displays a similar shape, figure 3.4.3 shows that market capitalization does not affect the result.
Finally, since the calculation of the output does not account for the evolution of financial assets intensity of intermediation, the main conclusions might be driven by output miss-pecification. Let’s discuss this point in details. First, credit development is largely due to mortgage credit, whose collateral size tends to discourage monitoring and screening behavior (Manove et al. 2001). At the same time, because rating agencies use hard information such as credit scoring or loan-to-value ratio for notations, banks relied increasingly on hard infor-mation too (Rajan et al. 2008) which is less intensive to manage. In addition, securitization tends to lead to lax screening (Keys et al. 2012). These effects should diminish the intensity of intermediation. Second, the rise of market capitalization in Europe is largely due to the wave of privatization occurring from the mid-1980s to the late 1990s, activity for which in-termediation intensity should not have been great. Third, so long as diseconomies of scale do not prevail at the industry level, there is no reason for financial wealth management to
16. It is worth noting that statistical publication does not make distinction between insurances and pension funds.
be more intensive today than it was in the 1960s. In fact, today’s comparison between active and passive funds manager profit does not display any superiority of the former over the latter (Fama and French 2010).
Even though I do not make quality adjustment of the series what would happens if I used Philippon’s (2013) methodology — which the aim is to account for the increasing intensity of intermediation related to poor households and low cash firms access to credit. Based on the results found and methodology used by Philippon (2013) this should not have a radical effect on the results produced here for two reasons. First, households income inequalities have increased more in the US than in Europe (Alvaredo et al. 2013). Therefore, the related cost of poor household access to credit must have been higher in the US than in Europe. Second, the economy as been less subject to IPO in Europe after the 1990s, so that low cash firms should have not had a better access to credit in Europe than in the US. This is all the truer since corporate credit tends to be stable in France and Germany after 1970. Because the US unit cost remain increasing after quality adjustment and because both European and US unit costs have similar shape, there is thus no reason for the European adjusted unit cost to not increase over the past 30 years.
4
Explaining the unit cost evolution : the role of
nomi-nal rates of interest and new market-based business
Looking at the shape of unit cost series, either in their plain or corrected forms, it is easy to identify increasing values during the 1970s and 1980s. Those years were a period of ma-croeconomic turmoil which affected nominal variables. Nominal interest rates are important in the case we are dealing with because financial intermediation aims to manage nominal stocks and flows. In other words, nominal interest rates are directly related to the way fi-nancial intermediaries fix the price of their services. It is thus essential to account for this variable to explain the unit cost evolution. In addition, the development of the originate-to-distribute model of finance leads us to focus on the effect of securitization and the underlying capital income on the unit cost after 1990.
4.1
The effect of nominal rates of interest
According to Smith (2003) and Paal, Smith and Yang (2013) the effect of nominal in-terest rate on the unit cost depends on the bank function as liquidity provider. So long as the quantity of money is fixed exogenously, banks must cope with a contradiction between
liquidity provision and investment strategy. Keeping unproductive funds in order to meet depositors demands for cash is considered an opportunity cost whose value increases as no-minal interest rates rise. Banks are consequently encouraged to expand their credit when nominal rates increase, at the expense of their cash reserves. Such a trade-off means that the ratio of credit to reserves is a positive function of the nominal interest rate (r). Assuming that the interest spread (i) between loan and deposit rates is constant, a banks unit cost increases in r. Although the impact of an increase in nominal rates of interest on i is ignored, the unit cost of financial intermediation increases with nominal rates of interest.
Another effect of the nominal interest rate emerges with the asymmetric evolution of nominal rates and deposit rates. Indeed, so long as deposit rates are sufficiently rigid in relation to nominal rates17
, due to, say, deposit rate ceiling (e.g. regulation Q) or a reduction of the amount of money put “under the mattress”, a rise in the latter increases the spread between lending and deposit rates. Figure 4.1.1 demonstrates this positive relationship in Germany, France and the UK. Although the fit appears tenuous in the case of the UK, it is particularly accurate in the case of France and Germany, countries in which credit depends on banks.
Because nominal rates of interest are directly related to interest margins, it is valuable to compare them with the unit costs. Instead of comparing the two series directly, I used a lowess-smoothing of short-term rates to deal with the volatility of the series. In addition, smoothed values is necessary so long as past rates continue to affect financial intermedia-tion for some years. Figure 4.1.2 shows that short-term interest rates explain the unit cost
until 1990 in Germany and the UK18
and in Europe as a whole.19
On the other hand, we can see that the distance between both (scale-adjusted) series increases after that date. The unexplained part of unit cost increase with time. The consequence of those results is straight-forward : whereas the cost of traditional activities is largely explained by the evolution of nominal rates, the costs related to originate-to-distribute activities remain hard to observe due to intermediaries ability to source new income from securitization and underlying trading businesses.
In the case of France, Figure 4.1.3 shows that nominal rates tend to explain the evolution of the unit cost over the whole period20
. In addition, Figure 4.1.3 shows that the four years
17. In fact ‘on demand’ deposit yield no interest rate. There is thus some deposit rate rigidity to nominal rates per definition.
18. Note that interest rate data is not available in th UK before 1958.
19. Since there were no European short-term rate data until recently, additional calculations (and hypo-theses) are needed to build the European series. Hence, the European rate is estimated using the GDP share of selected countries’ interest rates.