HAL Id: halshs-00815731
https://halshs.archives-ouvertes.fr/halshs-00815731
Submitted on 28 Sep 2014
HAL is a multi-disciplinary open access
archive for the deposit and dissemination of sci-entific research documents, whether they are pub-lished or not. The documents may come from teaching and research institutions in France or abroad, or from public or private research centers.
L’archive ouverte pluridisciplinaire HAL, est destinée au dépôt et à la diffusion de documents scientifiques de niveau recherche, publiés ou non, émanant des établissements d’enseignement et de recherche français ou étrangers, des laboratoires publics ou privés.
Network diversity and maritime flows
César Ducruet
To cite this version:
César Ducruet. Network diversity and maritime flows. Journal of Transport Geography, Elsevier, 2013, 30, pp.77-88. �10.1016/j.jtrangeo.2013.03.004�. �halshs-00815731�
Network diversity and maritime flows
Ducruet César
CNRS & UMR Géographie-Cités
13 rue du Four F-75006 Paris France Tel. +0033(0)140464000
Pre-final version of the paper published in Journal of Transport Geography, Vol. 30, pp. 77-88.
Abstract
Coupled and interdependent networks constitute a relatively recent research field that has been so far little invested by port and maritime specialists. The extent to which certain ports benefit from being connected to multiple commodity flows in the maritime network has in fact been poorly addressed. A global database of merchant vessel inter-port movements that occurred in October and November 2004 allows building the respective weighted graphs of solid bulk, liquid bulk, container, general cargo, and passenger / vehicles. Main results underline a very strong influence of commodity diversity on the distribution of maritime traffics among ports and links between them. The research also underlines the role of different regional settings in the specialization of traffic flows.
Keywords: commodity flows, coupled networks, multigraph, port hierarchy, sea transport.
1. Introduction
A wide range of studies across many research fields have investigated the influence of diversity on the size and growth of various objects, such as cities (Pumain et al., 2009). This is also the focus of studies on networks where a node with multiple linkages is assumed to have a strong position toward others. This idea was well summarized by Eagle et al. (2010, p.1031): "Do more diverse ties provide greater access to social and economic opportunities? Although the causal direction of this relation—whether network diversity promotes opportunity or economic development leads to more diversified contacts—cannot be established, social network diversity seems to be at the very least a strong structural signature for the economic development of a community".
Within studies of maritime flows among ports many questions have remained unaddressed with regard to the relation between cargo, or commodity diversity, and other crucial issues such as unequal traffic distribution and port hierarchies. Ports are often classified according to their operational differences, such as the dominant commodity handled (Bichou and Gray, 2005), which is an essential element of their activity. The contemporary specialization of maritime transport and port operations resulted in a variety of local combinations, each port handling a different set of commodities, from the most specialized to the most diversified, with many ports becoming redundant for a few large gateways concentrating all kinds of traffics (Mayer, 1973; Von Schirach-Szmigiel, 1973). Yet, containers remain "black boxes" because their precise content is often unknown, and port activities are measured in volume rather than value most of the time, thus making economic assessments difficult about their true performance and impact (Lemarchand, 2000). The fact that every port cannot welcome every vessel, beyond capacity aspects, creates the need to understand why and how certain ports are specialized in certain commodities and not in others. The very few attempts providing general answers to such questions have relied on classical methods of data analysis based on the distribution of port tonnage by port and by commodity type. Based on urban and regional studies that discuss the advantages of agglomeration, specialization, and diversification for cities, Ducruet et al. (2010) confirmed that ports handling larger traffic volumes are usually more diversified than ports handling smaller traffic volumes. Small and medium-sized ports can also be diversified just like large ports can be highly specialized, but this depends on a wide range of factors such as location, industry and regional linkages, etc. It was also empirically found that global city-regions possessing multiple ports and airports tend to be more attractive towards logistics activities than those possessing only one mode (O'Connor, 2010).
The goal of this paper is to approach the specialization of ports from the perspective of multigraphs, i.e. networks having diverse types of links between nodes. Such a framework is potentially very useful to study the diverse maritime connections between ports and their uneven overlap. Although network analysis has been applied to maritime flows already (Kaluza et al., 2010), the different vessel types remain analyzed separately while liner shipping received foremost attention (Wang and Wang, 2011; Ducruet and Notteboom, 2012). Due to the absence of a specific mathematical definition of the properties of multigraphs, it is necessary to review how they have been analyzed across diverse fields. The ambition of this paper is thus to investigate how different commodity types are coupled with each other in the
maritime network and what the effects of couplings between commodity types on port specialization and hierarchy are.
This paper is organized as follows. The second section proposes a review about the definition and studies of multigraphs in various contexts such as graph theory, social, complex, and spatial networks. The third section introduces maritime flow data and the fourth is the core of the paper as it presents the main results obtained. The last section concludes about the outcomes of the research and discusses their potential support to policy making.
2. Multigraphs, multiplex graphs, and coupled networks
Most research on networks focuses on simple (or uniplex) graphs where only one type of links occurs among nodes. While this is largely due to the absence of a proper mathematical definition of multigraphs (or multiplex graphs), the possibility and implications of having two or more types of links were approached by sociologists since the 1960s (Mitchell, 1969; Burt, 1992; Eve, 2002), notably looking at the effects of having both personal and professional relations within a given organization on individuals' career evolution. Such multiedge relations are thus called two-dimensional in social network analysis in opposition to single-stranded edges or links (Larson and Starr, 1993 ; Degenne and Forsé, 1999); they sometimes allow directionality (multidigraph) and the existence of loops, self-loops, or self-edges (pseudograph). In practice, multigraphs are often analyzed as simple graphs where links have multiple attributes allowing the application of conventional network analytical methods (Wasserman and Faust, 1994; Newman, 2010). Yet, some scholars have insisted on the specific issues raised by the coupling of different networks in terms of interdependency, mutual specializations and vulnerabilities notably in the transport sector (Van Geehuizen, 2000; Zhang et al., 2005). The coupled network or network of networks has thus been a fruitful approach to the multimodal dimension of global urban centrality (Ducruet et al., 2011), the trust relationships among individuals in the firm (Chollet, 2002; Grossetti and Barthe, 2008), the structure of a corpus (Boulet, 2011), and the learning of a language (Gautier and Chevrot, 2012) among other possible fields.
In their study of coupled networks, Buldyrev et al. (2010) particularly underlined the influence of simple networks' respective structure on the coupled network's characteristics. One main finding is that the vulnerability of the coupled network is higher when the simple
graphs are coupled via their large degree nodes, i.e. those having a high number of links or adjacent neighbors, but remains lower if the coupling occurs randomly (see also Vespignani, 2010). Such effects are even stronger for scale-free networks than for random networks, the two models being defined by a power law and a normal degree distribution respectively. Empirical works have been done to verify the effect of network coupling mostly on the level of the overall topological structure such as electrical and Internet networks in Italy (Rosato et al., 2008) or air and sea transport networks in the world (Parshani et al., 2010). The latter work notably proposed specific measures of network coupling to test the probability for coupled nodes to share same coupled neighbors and to have comparable degree levels in each network. Another approach based on time series of road, canal, and port creation on the 1760-1830 period focused on detecting possible inter-modal coevolutions (Bogart, 2009). Mathematics and operations research better focus on the cost minimization and routing optimization of multicommodity flows in multimodal networks based on modeling and programming (Lee et al., 2006; Christiansen et al., 2012).
The local effects of network coupling were approached in more empirical ways, such as by Jin et al. (2010) proposing an aggregate measure of transport dominance, based on three other standardized indices (density, proximity, accessibility), which is compared to local socioeconomic characteristics. Social Network Analytical (SNA) methods such as blockmodelling were applied to various networks made of different types of relations, such as Snyder and Kick (1979) about world regionalization based on commercial flows, military interventions, diplomatic relations, and joint treaties between states (see also Beauguitte, 2010), and Padgett and Ansell (1993) about the combined role of parenthood, kinship, and economic ties among 92 Italian families of the 15th century in the emergence of the Medici as a central and dominant actor in politics. Ducruet et al. (2011) investigated the respective role of air and sea transport networks in shaping the global hierarchy of urban accessibility, based on the comparison of betweenness centrality scores in single and coupled networks. This study also applied single linkage analysis to reveal certain interdependencies between the respective specialization of dominant and subordinate cities in the network. Finally, Berroir et al. (2012) proposed a joint analysis of 7 networks1 linking French urban areas providing novel results about the specialization of regional networks outside the Paris region.
1commuting flows, residential mobility flows, high speed air and rail flows, headquarter-branch relations in
innovative sectors, European scientific partnerships, headquarter-branch relations in all sectors, and relations between main residences and holiday homes.
3. Application to maritime flows
Data were obtained from Lloyd's List, a world leader maritime intelligence that insures about 80% of the world fleet. It provides information on the daily movements of merchant vessels, including the sequence of port calls, vessels' carrying capacity, type of commodity, etc. We extracted the data from paper versions of Lloyd's Voyage Records (LVR) over the period October to November 2004. Due to partial information on vessel types and capacities, missing data were retrieved from additional vessel databases such as Fairplay World Shipping Encyclopedia2, MIRAMAR Ship Index3, DNV Exchange4, and the World Shipping Register5. This required considerable efforts due to the absence of IMO (International Maritime Organization) numbers of vessels. Since many vessels regularly change their names and flags, the risk of confounding them across databases was avoided by taking into account their type, subtype, year of build, and former names.
Another methodological issue was the choice of tonnage capacity. Although deadweight tonnage (DWT) provides a more accurate picture of a vessel's commercial capacity (excluding reservoirs, decks, rooms, etc.), the Gross Registered Tonnage (GRT), which corresponds to the volume of the entire vessel, was selected due to its wider availability. In any case, the occupancy ratio of vessels (i.e. the number of tons actually carried on each trip) as well as the exact volume of freight handled at each port, is not specified by the data sources. Vessel capacities were summed by port and by inter-port link during each period of movement taking into account the volume and frequency of vessel trips.
Five main categories of commodities covering the whole maritime business are retained: liquid bulk (i.e. asphalt, crude oil, oil products, chemicals, liquefied natural gas, liquefied petroleum gas, water, wine, edible oil, and unspecified tankers), solid bulk (i.e. aggregates, cement, ores, and unspecified bulks), containers, and passengers/vehicles (roll-on / roll-off, cruise, ferries, vehicles), and general cargo. Although passengers are not commodities, they were kept in this study based on the argument that such flows also contribute to the diversity of port activities. The data source and traffic measure based on GRT have the advantage of counting passengers using the same metric as commodities. This differs from more
2http://www.ihs.com/products/maritime-information/ships/world-shipping-encyclopedia.aspx 3 http://www.miramarshipindex.org.nz 4http://exchange.dnv.com/exchange/Main.aspx 5http://e-ships.net/
conventional sources in which different metrics are used. In the case of combined vessels such as "bulk carrier with container capacity", "combined oil and ore carrier", "general cargo with container capacity", and "roll on roll off with container capacity", capacity was equally distributed among respective categories. A more detailed analysis was impossible because vessels are not always identified by their subtype. A total of 28,277 vessels have thus been identified as seen in table 1 that details the distribution based on available information.
Table 1– Fleet distribution by commodity type
Sub-type No. vessels % Total capacity (000s GRT) % Type No. vessels % Total capacity (000s GRT) % Containers 4,225 14.9 102,792 15.5 Containers 4,225 14.9 102,792 15.5 General cargo 7,279 25.7 41,292 6.2 General cargo 8,479 30.0 49,780 7.5 Reefer & fresh products 1,200 4.2 8,487 1.3
Solid bulks 6,531 23.1 197,491 29.8 Solid bulks 6,531 23.1 197,491 29.8 Passengers 581 2.1 15,530 2.3 Passengers &
vehicles 2,221 7.9 47,079 7.1 Vehicles 1,640 5.8 31,549 4.8
Chemicals 2,071 7.3 27,095 4.1
Liquid bulks 6,773 24.0 264,125 39.9 Liquid, natural gas 1,009 3.6 30,256 4.6
Crude oil & oil products 1,876 6.6 161,789 24.4 Other liquid bulks 1,817 6.4 44,983 6.8
Other vessels 48 0.2 759 0.1 Other vessels 48 0.2 759 0.1
Total 28,277 100.0 662,029 100.0 Total 28,277 100.0 662,029 100.0
The category "other vessels" was excluded from the subsequent analyses due to the absence of information or the non-cargo nature of vessels that operate training and research activities for instance. It was also necessary to aggregate different terminals, and even different ports, and thereby create coherent spatial units for the analysis, resulting in a total of 1,815 ports instead of 2,737. One example is Piraeus port to which a dozen of other terminals are directly adjacent and in fact serve the same city-region and hinterland of Athens. Measuring specialization at city/urban region level aims at fully embracing the diversity of cargo traffics at port gateways.
The chosen approach has been to merge the five commodity flow networks altogether into one simple graph. This inclusive approach keeps all ports and links from distinct networks as opposed to the exclusive approach where only common ports and links are kept (see figure 1). One crucial choice has been to consider direct and indirect voyages between ports along the
sequence of successive calls. It means that each vessel creates a complete graph and the resulting network is the overlap of all complete graphs. One important drawback of the data source is the impossibility of knowing the ports of origin and destination along given routes, since Lloyd's List reports all movements of vessels from the date their operation start until their activity ends or is interrupted (e.g. wreckage, repair, etc.). This would constitute an opportunity to test the role of diverse network configurations among commodity types, such as containers being regular (e.g. pendulum) shipping operated through transshipment and pendulum calls, and bulks being on-demand (tramping), point-to-point shipping. The application of one and the same methodology of network building to all commodity types thus raises the question of the uneven relevance of adjacent calls, with a higher importance of proximity for transit flows in liner shipping than for bulks. Links and ports are differentiated according to the nature of traffic, the number of commodity types handled, and the volume of such flows. Self-loops were excluded from the matrix as well as reflexive links (i.e. those between merged terminals and ports), and the graph was kept simple (i.e. without directionality of links). The analysis can thus focus on either the coupled network or the multigraph depending on the question raised.
In terms of port traffics, the resulting matrix exhibits certain disparities in comparison to other data sources such as Eurostat (figure 2). Two main differences with the latter are the lower shares of solid bulks at Hamburg and Antwerp and the higher share of containers at Rotterdam and Le Havre. One main reason is the high frequency of container vessels that inflates their traffic. Other reasons may refer to differences in time coverage (yearly versus inflates traffic at the latter two ports. Other reasons may refer to differences in time coverage (yearly versus monthly), in fleet coverage, as Lloyd's List does not track every existing vessel, and to a seasonal effect whereby the month of October constitutes a peak of activity for container shipping (cf. manufactured goods imports from Asia). Although it is clear that different commodity types have different economic values and therefore different economic weights (Charlier, 1994), no weighting rule or ratio has been applied to the data in order to avoid relying on arbitrary measures.
Figure 1 – From vessel movements to multigraph and coupled network
One difficulty assessing port specialization is the definition of the threshold from which a port can be said specialized or not. Based on global vessel traffic, figure 3 provides a possible categorization of ports where each of the eight classes retained in the map correspond to at least 70% of each port's total traffic. While such an approach clearly demonstrates the existence of many ports, large or small, specialized in one commodity type, many others are better defined by a mix of those commodities, such as containers / bulks. Liquid bulk ports concentrate at extraction, production, and transformation areas for gas and oil (e.g. Middle East, Gulf of Mexico, Guinea Gulf, North Africa, Black Sea, and Scandinavia), container ports are fewer in comparison while drawing an East-West line among the main economic poles, solid bulk ports reflect the importance of large import or export countries of raw materials such as Australia for coal and minerals, South Africa for ores, and ports handling passengers and vehicles (sometimes combined with containers) concentrate in Europe and the Caribbean. One category remains difficult to define as no clear dominance appears among commodities. Other methods of classification could have been used, such as multivariate and clustering methods, but they usually require a wider set of variables.
Figure 2 – Comparison of two data sources for measuring port specialization
Figure 3 – Distribution of traffic specialization at world ports
4. Commodity coupling in the global maritime network
4.1. Single vs. multiple commodity ports and links
The uneven effects of commodity variety on traffic distribution and network topological properties are presented in table 2, which provides a set of various indicators based on the number of commodities at ports and at links. The most diversified links (five commodities)
are the least populous category (1.4%) but the second largest one in terms of traffic weight (23.2%). In comparison, most diversified ports occupy a higher share (24.4%) but their relative traffic weight is by no means dominant reaching over 80% of total world traffics. The number of commodities seems to greatly affect total port performance as there is a rapid increase of this share from 1.5% for single commodity ports to 81.3% for most diversified ports. Such result is directly comparable with the traffic share of each subgraph: the most diversified ports concentrate no less than 40% of all links and 68% of world traffics, while more than 90% of world traffics occur among ports handling 4 to 5 commodity types. Links between most diversified ports are on average also the most diversified and have the highest traffic density in terms of GRT per link. Even single-commodity links are more concentrated among most diversified ports (31%). Such evidences conclude to a very strong influence of commodity diversity on traffic distribution6.
Another possibility to verify the importance of commodity diversity is to apply the rich-club coefficient to different subgraphs of ports with the same number of commodities. This coefficient is simply the Gamma Index proposed by Kansky (Ducruet and Lugo, 2013) defined by the proportion of existing links in the maximal possible number of links, which corresponds to the idea of network density, connectivity, and completeness. The rich-club coefficient is the ratio between a Gamma Index obtained for a subgraph and the Gamma Index applied to the whole network as in the following formula:
where E is the number of links (edges), N is the number of nodes (vertices), and k is the number of commodity types
6 Identical results were obtained on the basis of ten commodity types as seen in Appendix 1. The average traffic
size of links and ports increases along with the diversity level, the number and total traffic of links decrease as the diversity increases. More interestingly, increase in diversity level for ports leads to more homogenous traffic distributions and more diverse traffic portfolios. Those two measures of concentration and diversity were applied by Ducruet et al. (2010) to European ports. Due to the absence of information on subtypes for all vessels, the rest of the paper is based on five main commodity groups.
Table 2– Effects of commodity diversity on network properties
No. of commodity types per port 1 2 3 4 5 All
No. ports 544 303 266 259 443 1,815
Share of ports (%) 30.0 16.7 14.7 14.3 24.4 100.0 Share of links (%)* 0.3 0.4 0.9 2.6 40.2 - Traffic share of ports (%GRT) 1.5 2.8 4.6 9.7 81.3 100.0 Traffic share (%GRT)* 0.080 0.235 0.391 1.199 68.041 - Rich-club coefficient 0.272 0.350 0.497 1.325 6.758 - Mean diversity of neighbors 4.232 4.278 4.320 4.325 4.280 - Mean diversity of links 1.00 1.08 1.11 1.18 1.79 1.44 Mean traffic volume (GRT) 56,451 129,951 87,186 92,953 342,135 201,883 Avg. clustering coefficient 0.817 0.704 0.598 0.522 0.397 0.621 Avg. betweenness centrality 28.650 141.888 490.478 1344.616 9261.840 2556.636 Avg. degree centrality 9.866 23.594 44.756 76.444 174.822 67.034 Avg. eccentricity 0.522 0.599 0.664 0.717 0.797 0.650 Avg. length of links (km) 931 1,285 1,353 1,546 2,195 1,474 Share of 1-com links (%)* 0.39 0.46 1.13 3.04 31.05 - Share of 2-com links (%)* - 0.17 0.43 2.00 53.95 - Share of 3-com links (%)* - - 0.22 0.93 72.15 - Share of 4-com links (%)* - - - 0.28 86.89 - Share of 5-com links (%)* - - - - 100.00 -
No. commodity types per link 1 2 3 4 5 All
No. links 88,248 20,244 7,842 3,586 1,746 121,666 Share of links (%) 72.5 16.6 6.4 2.9 1.4 100.0 Traffic share of links (%GRT) 26.8 18.1 14.9 17.0 23.2 100.0 Rich-club coefficient 0.726 0.425 0.363 0.377 0.481 - Avg. clustering coefficient 0.571 0.170 0.058 0.019 0.008 - Avg. betweenness centrality** 0.010 0.018 0.026 0.040 0.078 - Avg. degree centrality** 0.089 0.089 0.096 0.109 0.180 - Avg. eccentricity 0.655 0.710 0.798 0.670 0.682 - Avg. length of links (km) 2,252 1,618 1,261 984 642 2,017
* based on subgraphs of ports with identical numbers of commodity types; ** normalized indices
The usefulness of the coefficient is to demonstrate whether the density of links is higher among diversified ports than among all ports (value higher than 1), or if it is the opposite value lower than 1). What becomes clear is the fact that connections among the most diversified ports are more than six times denser than among all ports, while the score remains over one for the subgraph of ports handling four commodity types. Relations among less diversified ports, which handle between one and three commodity types, are always less dense than among all ports in general. This demonstrates the existence of rich-club phenomena among diversified ports as they tend to exchange more with each other than with the rest of the network.
All other attempts capturing the effect of commodity variety on topological configurations and traffic performance lead to similar conclusions. Betweenness centrality, degree centrality,
and eccentricity7 are on average always higher at most diversified ports, which implies that such ports are better positioned than others in the network in terms of accessibility and dominance. Moreover, the clustering coefficient decreases as the number of commodity types increases, thereby suggesting a direct relationship between cargo diversity and the formation of cliques. While more specialized ports tend to embed within densely connected environments, more diversified ports are better defined by a bridge or hub role between those environments. When calculated from the perspective of links and regardless of the number of commodity types at ports themselves, results remains highly similar, such as the higher betweenness centrality, degree centrality, and lower clustering coefficient when links are more diversified, while eccentricity offers a more contrasted picture. Lastly, the average kilometric length of links (orthodromic) is also very much related with commodity diversity. When calculated among ports, this average distance is higher when ports are more diversified, which recalls the results of Ducruet and Zaidi (2012) about the good fit between degree centrality and length of links in the container network. Larger and more diversified ports possess a longer interaction range than smaller and less diversified ports due to their ability connecting different traffic scales from the global to the local. When calculated among links, results are inversely proportionate to commodity diversity. Proximity links are often more diversified because of their intraregional dimension and cargo redistribution function among adjacent ports, while long-distance links are more specialized as their probability to carry all sorts of goods is lower. The higher commodity diversity of proximity links is also influenced by the fact that ferries and ro-ro traffics remain mostly local in scope, and by the wider "law of geography" by which near places interact more than distant places (Tobler, 1970). Nevertheless, this also corroborates previous results on the global container shipping network where links of 500 kilometers or less concentrate the largest proportion of world traffics (Ducruet and Notteboom, 2012).
4.2. Interdependence among commodities
Table 3 offers first insights into the role played by specific commodity types in the global distribution of traffics. Containers occupy the largest share in the total traffic of the most diversified links (46%) and ports (35%), while container traffic is almost totally concentrated
7Betweenness centrality is the number of occurrences on shortest paths per node, degree centrality is the number
of adjacent neighbors per node, and eccentricity (also named closeness centrality, i.e. the inverse of Shimbel distance) is the farness from other nodes. The clustering coefficient is for each node the fraction of closed triplets (triangles) in the maximum possible number of triplets among adjacent neighbors.
at the most diversified ports (94%) and noticeably more concentrated at the most diversified links (35%). Whether containers follow or foster commodity diversity is difficult to assess, but their distribution is by far the most sensible to this diversity. Although other commodity types are also very much concentrated at the most diversified ports, containers are the most concentrated, followed by general cargo and passengers. Indeed, raw materials such as bulks are more likely to be concentrated at specialized ports performing only bulk traffics. Indeed, liquid and solid bulks have in common that they are more concentrated at more specialized links and ports. In comparison, general cargo and passengers do not exhibit specific distributions. Lastly, as detailed in Appendix 1, containers have the highest share of links (75%) and of traffic (88%) connecting most diversified ports, while they also have the highest proportion of traffic among those ports compared with other commodities (39%). This means that the most diversified ports are the best connected through container flows although they also handle other commodities.
Table 3– Traffic distribution by commodity type and diversity levels
No. commodity types per port 1 2 3 4 5 All
Traffic share (%GRT) by coupling level
Containers 1.0 2.6 3.5 16.1 35.0 30.3 General cargo 7.3 6.6 9.0 6.5 6.5 6.7 Liquid bulk 45.4 39.3 39.7 30.0 22.2 24.6 Pass. & vehicles 32.7 38.6 30.4 25.0 23.5 24.5 Solid bulk 13.6 12.9 17.4 22.4 12.7 13.9 Traffic share (%GRT) by commodity type Containers 0.0 0.2 0.5 5.2 94.0 100.0 General cargo 1.7 2.7 6.2 9.5 79.8 100.0 Liquid bulk 2.8 4.5 7.4 11.9 73.4 100.0 Pass. & vehicles 2.0 4.4 5.7 9.9 78.0 100.0 Solid bulk 1.5 2.6 5.8 15.7 74.5 100.0
No. commodity types per link 1 2 3 4 5 All
Traffic share (%GRT) by coupling level
Containers 16.0 25.9 29.7 36.6 46.1 30.3 General cargo 6.5 7.0 7.4 6.5 6.2 6.7 Liquid bulk 31.5 24.9 22.0 21.0 20.5 24.6 Pass. & vehicles 26.0 27.6 26.3 26.3 18.0 24.5 Solid bulk 20.0 14.6 14.5 9.6 9.1 13.9 Traffic share (%GRT) by commodity type Containers 14.1 15.4 14.7 20.5 35.3 100.0 General cargo 26.2 19.0 16.7 16.5 21.6 100.0 Liquid bulk 34.4 18.4 13.4 14.5 19.4 100.0 Pass. & vehicles 28.4 20.3 16.1 18.2 17.0 100.0 Solid bulk 38.5 19.0 15.5 11.8 15.2 100.0
Another important question is whether certain commodities are more strongly coupled than others and if so how. Evidence is first based on the number and proportion of common links (table 4) and, among those links, which ones are more diversified, since each link in the global maritime network may carry from one to five types of commodities. Containers stand out as the most coupled commodity type, with 67% of its links being also travelled by at least
one other commodity type. One reason is purely statistical, as it is the smallest network in terms of its absolute number of links, but one may wonder about more spatio-temporal arguments, such as the late emergence of this technology making it spatially bound to already existing locations and routes. This argument does not support the commonly accepted view on liner shipping as a very distinct segment of maritime transport based on its own logistical arrangements such as hub-and-spoke systems, interlining, and line-bundling (Ducruet and Notteboom, 2012). Apart from a very few pure transit hubs and outports, most container ports and terminals have developed at places performing bulk and general cargo activities. Those results would not have been so evident had no effort been directed towards aggregating terminals and ports in close proximity from raw data. This also relates to the fact that many large ports, notably those handling containers, benefit from dynamic urbanization externalities provided by their urban environment (Hall and Jacobs, 2012), allowing them to continue to dominate shipping networks and to resist external shocks and fluctuations of all kinds (De Langen, 1998; Todd, 2000; Lemarchand and Joly, 2009). Port traffic diversity is for a large part a function of the economic size and diversity of the city-region, as empirically verified in different contexts (Carter, 1962; Kuby and Reid, 1992; Ducruet et al., 2010). In contrast, general cargo is the least coupled commodity type with only 42% of shared links. This is probably due to its bigger size and wider spatial coverage, which makes many links unique to this category: it also has the highest share of 2-commodity links (53%) and the lowest share of 5-commodity links (7%). For the other types, the picture is more balanced since about half of their links are shared. This is in line with the fact that container links connect more diversified ports on average (2.4) compared with general cargo (1.7).
Table 4– Coupled links by commodity type
Commodity No. links No. shared links % shared links of which: Avg. mix 2-com 3-com 4-com 5-com
General cargo 58,547 24,700 42.2 53.1 26.1 13.7 7.1 1.7 Liquid bulk 39,209 19,798 50.5 48.0 27.5 15.6 8.8 1.9 Solid bulk 34,085 16,584 48.7 46.9 26.9 15.7 10.5 1.9 Pass. & vehicles 23,116 12,424 53.7 39.8 26.9 19.2 14.1 2.1 Containers 20,379 13,582 66.6 37.9 28.0 21.2 12.9 2.4 All 121,666 33,418 27.5 60.6 23.5 10.7 5.2 1.4
The extent to which different commodity types are coupled with each other through the network (table 5) is difficult to assess since each commodity pair is linked both independently from other types (exclusive bi-coupling) or through mixed coupling with other types. In addition, each coupling does not have the same importance for each respective type. The
question is thus to verify which commodity types tend to be coupled more strongly and in which circumstances, i.e. independently or in relation to others. In addition, the Pearson correlation measures how much respective traffic distributions are similar either by looking at links and ports. The latter approach provide similar results for links and ports: containers and general cargo exhibit highest correlations, followed by general cargo/solid bulk and containers/solid bulk. Those three commodity groups thus have higher similarity with each other than with other groups. Although liquid bulks have relatively significant correlations with the three former groups in terms of port traffics, this is not the case when distributions over links are considered. What can be concluded is that liquid bulk networks do not overlap much with other networks, but on the level of gateways, it is likely that movements of liquid bulk will be an essential component of total port traffic. The correlations of passenger traffic with any type of commodity are statistically not significant due to their more local geographic coverage (i.e. short-sea and coastal shipping).
When it comes to the distribution of links per commodity pair, the differentiation lies in the level of coupling. Certain pairs are more strongly coupled exclusively, such as general cargo/passengers and general cargo/liquid bulk. Conversely, all pairs with containers (except the one with general cargo) and with solid bulk tend to be more strongly coupled when other commodities are also present. This can be defined as the "corridor" or "pipeline" effect whereby certain commodities are coupled mostly along mass transit links welcoming all sorts of goods, and less in other areas where there is less overlap. One interesting observation is that when pairs are more strongly coupled exclusively, their relative importance for respective commodity types is also higher, in terms of the share of this pair in the total number of coupled links for each commodity type. Other pairs are not coupled more strongly at any particular level.
Table 5– Coupling levels by commodity pairs
Commodity 1 Commodity 2
Common links by coupling level (%)
Respective shares (%)
Traffic correlations
2 3 4 5 All com1 com2 Links Ports
Containers General cargo 23.4 29.3 28.6 18.7 100.0 32.9 21.7 0.545 0.764 Containers Liquid bulk 14.3 27.6 33.6 24.5 100.0 25.1 19.4 0.176 0.462 Containers Pass. & vehicles 18.2 25.1 27.8 28.9 100.0 21.3 23.4 0.054 0.183 Containers Solid bulk 14.3 23.6 32.3 29.7 100.0 20.7 18.6 0.314 0.579 General cargo Liquid bulk 36.6 30.5 20.5 12.4 100.0 32.6 38.4 0.161 0.518 General cargo Solid bulk 23.7 28.5 26.5 21.3 100.0 26.7 36.6 0.393 0.587
General cargo Pass. & vehicles 33.3 30.7 20.8 15.2 100.0 19.0 31.8 0.166 0.292 Liquid bulk Solid bulk 16.7 26.9 29.4 27.1 100.0 24.6 28.7 0.143 0.521 Liquid bulk Pass. & vehicles 25.1 32.2 23.4 19.4 100.0 17.6 25.0 0.027 0.170 Pass. & vehicles Solid bulk 16.4 21.7 27.5 34.4 100.0 19.7 16.1 0.061 0.116
4.3. Commodity coupling and port hierarchy
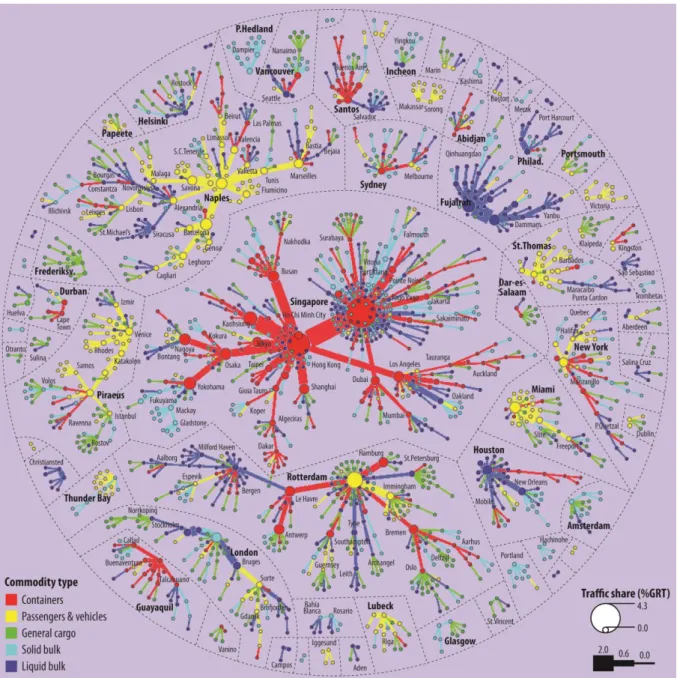
Lastly, this research investigates whether more diversified ports dominate less diversified ports, and how their dominance is geographically spread over the network. We adopt a widely used technique of network simplification based on the so-called single linkage analysis (Nystuen and Dacey, 1961), which consists in removing for each port all its links except the largest one. This implies the search for hidden hierarchical, tree-like substructures as well as of the central nodes polarizing such subsystems. Colors and grayscale as well as a visualization algorithm are used to best delimitate the resulting "nodal regions". Two applications are proposed: one for the coupled network (simple graph) that retains the number of commodity types at ports and at links (figure 4), and one for the multigraph that maps the commodity type of the largest flows at ports and at links (figures 5a and 5b). Only ports connecting three or more largest flow links are named in the figures for the sake of clarity.
In the coupled network and in line with previous results, the most dominant ports in their subsystems are also the most diversified nodes that act as hubs in the larger network. Most subordinate ports are much more specialized. There are very few exceptions to the general rule. Examples include Port Hedland (Australia) and Thunder Bay (Canada) which are dominant in their respective subsystems despite a slightly less diversified profile as bulk ports; the same applies to Milford Haven (United Kingdom) given its very specialized profile (liquid bulk). In addition, those dominant ports are surrounded by most diversified ports as well in the tree structure, as diversity decreases at the sinks (extremities) of subtrees. This confirms the idea that smaller traffic ports are less diversified and rarely act as hubs in their port system. One important outcome of this analysis is the lack of a specific regional logic in
the distribution of commodity diversity: each subsystem possesses at least one very diversified port and link that is dominant towards other ports. No region of the world is more diversified than the others.
Retrieving certain regional logics in the distribution of traffics is nevertheless possible when the same method is applied to the multigraph itself, i.e. where links of different nature between two same ports are kept (figure 5a). Certain commodities constitute the backbone of certain subsystems as suggested by Figure 1, while certain ports have the ability to attract more diverse links than others. The largest nodal region centered upon Singapore and Hong Kong confers a central role to container ports that constitute the main hubs towards other commodities. This is not the case everywhere in the world. The second largest nodal region polarized by Rotterdam has a more diverse profile, with Rotterdam being more strongly represented as a "short-sea" port (passengers and ro-ro) due to its largest flow link with Immingham (UK), and Milford Haven, Bergen, and Aalborg being liquid bulk hub ports. Yet, ports such as Bremen, Hamburg, Le Havre, Antwerp, and Southampton have their largest flows in containers while attracting a wide range of other commodities, such as general cargo in North Europe. Guayaquil (Ecuador), Santos (Brazil), Abidjan (Ivory Coast), Vancouver (Canada), Sydney (Australia), Dar-es-Salaam (Tanzania), and Durban (South Africa) are other example of ports being container-oriented while polarizing other commodities. As seen more broadly in Figure 1, South Europe and the Caribbean are better defined by short-sea shipping subnetworks (Naples, Piraeus, Miami, and Saint Thomas nodal regions). New York resembles Rotterdam by its profile of short-sea port polarizing container flows. Outside of large nodal regions, most other subsystems are in fact very much specialized in one or two types of commodities and remain smaller by their number of ports included. This has a lot to do with the fact that bulk shipping relies on tramping (on-demand) flows within certain regions and routes while container flows are more regular and hierarchically distributed. Houston is one of the few examples of a liquid bulk oriented port that also polarizes container movements. London is the world's only example of a solid bulk port that is dominant in a large nodal region composed of various commodities (except containers). This reflects London's long-term prominence as major crossroads between the United Kingdom and the rest of the world, notwithstanding the shift of modern container facilities towards deep-sea locations such as Felixstowe that appears, surprisingly, as a port specialized in liquid bulks. General cargo remains the only commodity type without large dominant ports; the nodal regions of Frederiksvaerk (Denmark) and Glasgow (UK) remain rather small in size and geographic
coverage. General cargo is indeed more widespread and tends not to concentrate at specific ports and/or regions.
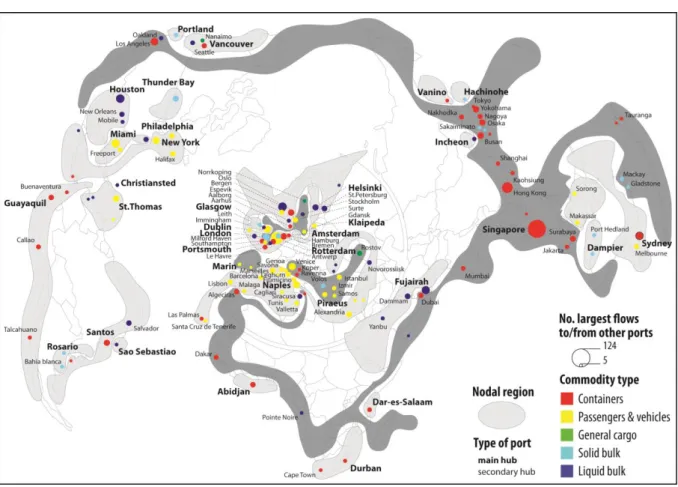
Figure 5b – Commodity specialization and nodal regions in the multigraph
The geographic coverage of nodal regions (figure 5b) depicts a strong regionalization of world maritime flows: despite the inclusion of many indirect and long-distance links in the whole port-to-port matrix, there is a strong regionalization process by which nearby ports are more tightly connected (in terms of their largest flow link) than ports at greater physical distances from each other. Nodal regions, of course, are more or less extended spatially, from the largest one centered upon Singapore and Hong Kong reaching across West Africa and the Mediterranean, to the smallest ones including a handful of nearby ports along a given coast, such as Nakhodka and other Far-East Russian ports. Such configurations are explained by two main factors. First, local contexts play a strong role in the spatial extension of networks, such as the polarization of world flows by Asian ports for both manufactured goods and raw materials. Second and in relation with the former aspect, different commodity types travel different distances on average, with containers (2,354 kilometers) and solid bulks (2,436) having the greatest reach, followed by passengers and vehicles (1,903), liquid bulks (1,434), and general cargo (964). Containers are characterized by the highest ton-kilometer volume per link on average (602,382 GRT per kilometer), followed by liquid bulks (513,911), passengers and vehicles (421,471), solid bulks (285,832), and general cargo (41,956). Combined with the
specific network design of liner shipping, this makes container ports dominant in the global structure of maritime flows.
5. Conclusion
Based on the assumption that commodity diversity plays an important role in maritime traffic distribution among ports, this research has applied a number of measures to the configuration of global maritime flows. Ports and the links between them have been differentiated on the simple basis of five major commodity groups and five levels of commodity coupling, from single to multiple commodities. It has appeared that most measures of traffic volume, centrality, clustering, etc. clearly exhibit strong sensitivity to the number of commodity groups handled at ports and links. The most diversified ports are, on average, bigger, more centrally located, more dominant in the network while they also connect over greater physical distances than more specialized ports. While most diversified links concentrate the majority of global traffics, they are often shorter due to their distribution role at the intra-regional level. Depending on the type of commodities, the coupling among them varies in intensity and frequency with, overall, a higher traffic correlation among general cargo, containers, and solid bulks. Certain commodities are more strongly coupled apart from other groups while certain commodities are more strongly coupled through multiple mixing. In addition, the distribution of commodity diversity among nodal maritime regions of the world confirms that with few exceptions dominant hub ports are all diversified, while priority linkages are more diversified than those lying at the extremity of subsystems. The latter subsystems exhibit, interestingly, certain specialization when looking at the distribution of main commodity links in the multigraph. Although on a global level container ports dominate the distribution of commodity diversity, certain nodal regions are more specialized than others.
It is tempting to address policy implications driven by the search for diversification strategies by port authorities or container-driven planning objectives. However, unlike individuals in social networks, ports cannot be considered as self-centered entities taking their own decisions. They are more likely to be part of a wider community of interests involving the whole logistics chain and the local industry (cf. port clusters) as well as global and national transport players. The maritime network itself is an assemblage of many individual vessels' movements that are by nature constrained by the spatial embedding of ports and routes.
Therefore, current results that remain highly static should incorporate dynamic elements in order to better demonstrate whether the diversification and/or containerization strategy has fostered the relative position of ports in a competitive environment, perhaps based on modeling and simulation experiments. Other network clustering methods could also be applied in order to avoid removing the majority of links and to identify densely connected maritime regions on the basis of commodity diversity levels. Since the influence of commodity diversity has been demonstrated, the analysis could also go deeper into the differentiation of vessels and commodity types in order to enable the identification of key determinants of port specialization, perhaps within a particular region instead of at a global scale. While the current outcomes of a multigraph approach to maritime flows remain rather aggregated and abstract with regard to the daily concerns and stakes of the maritime and ports industries, they undoubtedly demonstrate the usefulness of such methodology and provide a concrete case study for further research on coupled and interdependent networks in general.
Acknowledgements
The author would like to thank Olivier Joly, Marine Le Cam, and Brahim Ould Ismail at UMR IDEES (Le Havre) for their help on data provision and preparation, as well as Liliane Lizzi at UMR Géographie-Cités for her support on cartography. The research leading to these results has received funding from the European Research Council under the European Union's Seventh Framework Programme (FP/2007-2013) / ERC Grant Agreement n. [313847] "World Seastems".
References
Beauguitte, L., 2010. Looking for European Union in the Word-System: A multi-graph approach. Paper presented at the European Regional Science Association Conference, Jönköping, Sweden, August 19-23, http://www-sre.wu.ac.at/ersa/ersaconfs/ersa10/ERSA2010finalpaper698.pdf (Accessed December 2012).
Berroir, S., Cattan, N., Guérois, M., Paulus, F., Vacchiani-Marcuzzo, C., 2012. Les systèmes urbains français. Synthèse DATAR, Travaux en Ligne 10, http://www.territoires.gouv.fr/sites/default/files/travaux_en_l_10_synthese_susm.pdf
Bichou, K., Gray, R., 2005. A critical review of conventional terminology for classifying seaports. Transportation Research Part A 39(1), 75-92.
Bogart, D., 2009. Inter-modal network externalities and transport development: Evidence from roads, canals, and ports during the English Industrial Revolution. Networks and Spatial
Economics 9(3), 309-338.
Boulet, R., 2011. Introduction d’indices structuraux pour l’analyse de réseaux multiplexes. Application à l’analyse d’un thésaurus. Paper presented at the MARAMI conference, Grenoble, France, October 19-21.
Buldyrev, S. V., Parshani, R., Paul, G., Stanley, H. E., Havlin, S., 2010. Catastrophic cascade of failures in interdependent networks. Nature 464, 1025-1028.
Burt R., 1992. Structural Holes: The Social Structure of Competition. Cambridge (Mass.): Harvard University Press.
Carter, R. E., 1962. A comparative analysis of United States ports and their traffic characteristics. Economic Geography 38, 162-175.
Charlier, J., 1994. Sur le concept de tonnages pondérés en économie portuaire. L'exemple du Northern Range. Les Cahiers Scientifiques du Transport 29, 75-84.
Chollet, B., 2002. L'analyse des réseaux sociaux : quelles implications pour le champ de l'entrepreneuriat ? Paper presented at the 6th International French-speaking Congress on PME, HEC Montréal, Canada.
Christiansen, M., Fagerholt, K., Nygreen, B., Ronen, D., 2012. Ship routing and scheduling in the new millennium. European Journal of Operational Research (in press).
De Langen, P. W., 1998. The future of small and medium sized ports in Europe. In: Sciutto, G., Brebbia, C. A. (Eds), Maritime Engineering and Ports, Boston and Southampton: WIT Press, pp. 263-279.
Degenne A., Forsé M., 1999. Introducing Social Networks. London: Sage Publications.
Ducruet, C., Koster, H. R. A., Van der Beek, D. J., 2010. Commodity variety and seaport performance. Regional Studies 44(9) , 1221-1240.
Ducruet, C., Ietri, D., Rozenblat, C., 2011. Cities in worldwide air and sea flows: A multiple networks analysis. Cybergeo: European Journal of Geography 528, http://cybergeo.revues.org/23603 (Accessed December 2012).
Ducruet, C., Lugo, I., 2013. Structure and Dynamics of Transportation Networks: Models, Concepts, and Applications. In: Rodrigue, J. P., Notteboom, T. E., Shaw, J., (Eds), The SAGE Handbook of Transport Studies, SAGE Publications (in press).
Ducruet, C., Notteboom, T. E., 2012. The worldwide maritime network of container shipping: Spatial structure and regional dynamics. Global Networks 12(3), 395-423.
Ducruet, C., Zaidi, F., 2012. Maritime constellations: A complex network approach to shipping and ports. Maritime Policy and Management 39(2), 151-168.
Eagle, N., Macy, M., Claxton, R., 2010. Network diversity and economic development.
Science 328, 1029-1031.
Eve, M., 2002. Deux traditions d'analyse des réseaux sociaux. Réseaux 5(115), 183-212.
Gautier, R., Chevrot, J. P., 2012. Influence des réseaux sociaux sur l’usage et l’acquisition du français langue seconde par des Américains lors de séjour d'étude en France : une étude exploratoire. Proceedings of the 3rd Global Congress in French Linguistics (CMLF), EDP Sciences.
Grossetti, M., Barthe, J. F., 2008. Dynamique des réseaux interpersonnels et des organisations dans les créations d’entreprises. Revue Française de Sociologie 49(3), 585-612.
Hall, P.V., Jacobs, W., 2012. Why are maritime ports (still) urban, and why should policy makers care? Maritime Policy and Management 39(2), 189-206.
Jin, F., Wang, C., Li, X., Wang, J., 2010. China’s regional transport dominance: Density, proximity, and accessibility. Journal of Geographical Sciences 20(2), 295-309.
Kaluza, P., Kölzsch, A., Gastner, M. T., Blasius, B., 2010. The complex network of global cargo ship movements. Journal of the Royal Society Interface 7(48), 1093-1103.
Kuby, M., Reid, N., 1992. Technological change and the concentration of the U.S. general cargo port system: 1970-88. Economic Geography 68, 272-289.
Larson, A., Starr, J. A., 1993. A network model of organization formation. Entrepreneurship
Theory and Practice 17(2), 5-15.
Lee, L. H., Chewa, E. P., Leeb, L. S., 2006. Multicommodity network flow model for Asia's container ports. Maritime Policy and Management 33(4), 387-402.
Lemarchand, A., 2000. Mesures de la valeur et des emplois, Emplois et valeurs des mesures : la dynamique des ports. Report for the French National Planning Agency, Paris: DATAR.
Lemarchand, A., Joly, O., 2009. Regional Integration and Maritime Range. In: Notteboom, T. E., Ducruet, C., De Langen, P. W. (Eds) Ports in Proximity: Competition and Coordination
among Adjacent Seaports, Aldershot: Ashgate, pp. 87-99.
Mayer, H. M., 1973. Some geographic aspects of technological change in maritime transportation. Economic Geography 49(2), 145-155.
McCalla, R.J., 2008. Container transshipment at Kingston, Jamaica. Journal of Transport
Geography 16(3), 182-190.
Mitchell, C., 1969. The Concept and Use of Social Networks. In: Mitchell, C., (Ed), Social Networks in Urban Situations, Manchester: Manchester University Press.
Newman, M. E. J., 2010. Networks: An Introduction. Oxford: Oxford University Press.
Nystuen, J. D., Dacey, M. F., 1961. A graph theory interpretation of nodal regions. Papers in
Regional Science 7(1), 29-42.
O'Connor, K., 2010. Global city-regions and the location of logistics activity. Journal of
Transport Geography 18(3), 354-362.
Padgett, J. F., Ansell, C. K., 1993. Robust action and the rise of the Medici. American Journal
of Sociology 98(6), 1259-1319.
Parshani, R., Rozenblat, C., Ietri, D., Ducruet, C., Havlin, S., 2010. Inter-similarity between coupled networks. Europhysics Letters 92(68002).
Pumain, D., Paulus, F., Vacchiani-Marcuzzo, C., 2009. Innovation Cycles and Urban Dynamics. In: Lane, D., van der Leeuw, S., Pumain, D., West, G., (Eds), Complexity Perspectives in Innovation and Social Change, Berlin: Springer-Verlag, pp. 237-260.
Rosato, V., Issacharoff, L., Tiriticco, F., Meloni, S., De Porcellinis, S., Setola, R., 2008. Modelling interdependent infrastructures using interacting dynamical models. International
Journal of Critical Infrastructures 4(1-2), 63-79.
Tobler, W. R., 1970. A computer movie simulating urban growth in the Detroit region.
Economic Geography 46, 234-240.
Todd, D., 2000. Retreat from specialisation: A coal port's search for sustainability. The
Journal of Transport History 21, 168-190.
Van Geenhuizen, M., 2000. Interconnectivity of transport networks: A conceptual and empirical exploration. Transportation Planning and Technology 23(3), 199-213.
Vespignani, A., 2010. Complex networks: The fragility of interdependency. Nature 464, 984-985.
Von Schirach-Szmigiel, C., 1973. Trading areas of the United Kingdom ports. Geografiska
Annaler 55B, 71-82.
Wang, C., Wang, J., 2011. Spatial pattern of the global shipping network and its hub-and-spoke system. Research in Transportation Economics 32(1), 54-63.
Wasserman, S., Faust, K., 1994. Social Network Analysis: Methods and Applications. Cambridge: Camdridge University Press.
Zhang, P. C., Peeta, S., Friesz, T., 2005. Dynamic game theoretic model of multi-layer infrastructure networks. Networks and Spatial Economics 5(2), 147-178.
Appendix 1– Main results per 10 commodity types No. of types Links Ports Avg. traffic (000s GRT) Total traffic (million GRT) No. links Avg. traffic (000s GRT) Total traffic (million GRT) No. links Avg. no. links No.
ports Gini* CDI**
1 80 6,547 81,341 749 327 3,929 9.0 437 0.900 0.558 2 181 6,427 35,476 2,285 591 5,593 21.6 259 0.853 0.618 3 397 4,834 12,153 3,533 688 5,839 29.9 195 0.817 0.687 4 707 4,025 5,691 5,290 830 7,636 48.6 157 0.780 0.751 5 1,127 3,627 3,216 6,251 781 7,605 60.8 125 0.764 0.795 6 1,657 2,993 1,806 12,624 1,565 9,581 77.3 124 0.727 0.893 7 2,954 3,087 1,045 19,593 2,527 14,173 109.9 129 0.685 0.969 8 4,603 2,476 538 32,569 3,615 16,005 144.2 111 0.654 1.090 9 8,177 2,142 262 49,324 5,820 22,599 191.5 118 0.624 1.170 10 17,017 1,463 86 134,693 20,877 48,654 313.9 155 0.565 1.587 All 265 37,626 141,614 20,787 37,626 141,614 78.2 1810 0.776 0.826
* Gini coefficient: measure of concentration applied to the traffic distribution of the ten commodities at each port; higher indices mean higher concentration around a few commodities
** Commodity Diversity Index: inverse of the sum of absolute differences in commodity shares at world level; higher indices mean higher diversity of traffics
Appendix 2– Supplementary tables on commodity diversity
Share of links (%) between ports by commodity type according to their commodity mix
Containers Port A / B 1 2 3 4 5 All 1 0.01 0.00 0.01 0.01 0.19 0.23 2 0.03 0.03 0.10 0.81 0.97 3 0.10 0.29 1.88 2.31 4 1.04 8.48 9.92 5 75.22 86.57 General Cargo 1 0.30 0.29 0.47 0.65 2.99 4.68 2 0.37 0.61 0.92 3.89 6.07 3 1.00 1.48 6.54 10.09 4 2.33 10.04 15.43 5 40.27 63.73 Liquid Bulk 1 0.18 0.17 0.23 0.45 2.08 3.11 2 0.26 0.43 0.64 2.94 4.43 3 0.68 1.44 6.06 8.84 4 2.53 11.02 16.09 5 45.44 67.53
Passengers & vehicles
1 0.31 0.31 0.25 0.42 1.64 2.94 2 0.37 0.32 0.51 2.11 3.61 3 0.29 0.64 3.18 4.69 4 1.28 8.02 10.87 5 62.94 77.89 Solid Bulk 1 0.08 0.08 0.14 0.35 1.28 1.94 2 0.19 0.38 0.67 2.73 4.06 3 0.83 1.44 6.08 8.88 4 2.61 11.18 16.26 5 47.59 68.87 All commodities 1 0.20 0.19 0.27 0.44 1.95 3.05 2 0.27 0.42 0.66 2.86 4.40 3 0.70 1.22 5.36 7.96 4 2.14 10.04 14.50 5 49.89 70.10
Share of links (%) in world total between ports by commodity type according to their commodity mix Containers (11.6%) Port A / B 1 2 3 4 5 All 1 0.00 0.00 0.00 0.00 0.02 0.03 2 0.00 0.00 0.01 0.09 0.11 3 0.01 0.03 0.22 0.27 4 0.12 0.98 1.15 5 8.73 10.05 General Cargo (33.3%) 1 0.10 0.10 0.16 0.22 1.00 1.56 2 0.12 0.20 0.31 1.30 2.03 3 0.33 0.49 2.18 3.36 4 0.78 3.35 5.14 5 13.43 21.25 Liquid Bulk (22.4%) 1 0.04 0.04 0.05 0.10 0.47 0.70 2 0.06 0.10 0.14 0.66 0.99 3 0.15 0.32 1.36 1.98 4 0.57 2.47 3.60 5 10.18 15.13
Passengers & vehicles (13.2%)
1 0.04 0.04 0.03 0.06 0.22 0.39 2 0.05 0.04 0.07 0.28 0.47 3 0.04 0.08 0.42 0.62 4 0.17 1.06 1.43 5 8.28 10.25 Solid Bulk (19.5%) 1 0.02 0.02 0.03 0.07 0.25 0.38 2 0.04 0.07 0.13 0.53 0.79 3 0.16 0.28 1.19 1.73 4 0.51 2.18 3.17 5 9.27 13.42
Share of traffic (%GRT) between ports by commodity type according to their commodity mix Containers Port A / B 1 2 3 4 5 All 1 0.00 0.00 0.01 0.00 0.04 0.05 2 0.02 0.01 0.03 0.19 0.24 3 0.01 0.04 0.47 0.53 4 0.31 4.81 5.18 5 88.49 94.00 General Cargo 1 0.14 0.10 0.30 0.14 0.98 1.66 2 0.12 0.35 0.31 1.86 2.75 3 0.67 0.68 4.21 6.21 4 0.97 7.43 9.53 5 65.36 79.84 Liquid Bulk 1 0.13 0.21 0.33 0.26 1.89 2.82 2 0.11 0.37 0.55 3.21 4.45 3 0.74 1.06 4.94 7.44 4 1.26 8.75 11.89 5 54.60 73.40
Passengers & vehicles
1 0.12 0.17 0.16 0.26 1.32 2.03 2 0.72 0.61 0.39 2.48 4.38 3 0.29 0.89 3.76 5.71 4 1.40 6.96 9.90 5 63.44 77.96 Solid Bulk 1 0.08 0.04 0.10 0.22 1.06 1.49 2 0.14 0.20 0.53 1.68 2.58 3 0.64 0.91 3.92 5.78 4 2.80 11.20 15.66 5 56.62 74.48 All commodities 1 0.08 0.11 0.16 0.17 1.01 1.52 2 0.23 0.29 0.34 1.81 2.78 3 0.39 0.66 3.11 4.61 4 1.20 7.37 9.74 5 68.04 81.34
Share of traffic (%GRT) in world total between ports by commodity type according to their commodity mix Containers (30.3%) Port A / B 1 2 3 4 5 All 1 0.10 0.03 1.25 0.25 1.24 0.99 2 1.97 0.56 2.96 3.12 2.62 3 0.90 1.64 4.59 3.48 4 7.72 19.77 16.13 5 39.42 35.02 General Cargo (6.7%) 1 11.52 6.44 12.86 5.61 6.46 7.28 2 3.52 7.98 6.15 6.83 6.58 3 11.35 6.87 9.05 8.99 4 5.38 6.72 6.53 5 6.41 6.55 Liquid Bulk (24.6%) 1 39.16 47.85 51.81 38.37 45.79 45.38 2 11.10 31.13 40.27 43.56 39.27 3 46.42 39.36 39.09 39.67 4 25.85 29.18 30.01 5 19.72 22.17
Passengers & vehicles (24.6%)
1 35.83 39.97 25.21 38.08 31.97 32.73 2 75.28 51.07 28.67 33.62 38.62 3 18.37 32.96 29.69 30.41 4 28.59 23.17 24.96 5 22.88 23.52 Solid Bulk (13.9%) 1 13.39 5.71 8.88 17.69 14.53 13.63 2 8.13 9.26 21.95 12.88 12.92 3 22.96 19.18 17.58 17.44 4 32.46 21.15 22.38 5 11.58 12.74