HAL Id: halshs-00458593
https://halshs.archives-ouvertes.fr/halshs-00458593
Submitted on 21 Feb 2010
HAL is a multi-disciplinary open access archive for the deposit and dissemination of sci-entific research documents, whether they are pub-lished or not. The documents may come from teaching and research institutions in France or abroad, or from public or private research centers.
L’archive ouverte pluridisciplinaire HAL, est destinée au dépôt et à la diffusion de documents scientifiques de niveau recherche, publiés ou non, émanant des établissements d’enseignement et de recherche français ou étrangers, des laboratoires publics ou privés.
Centrality and vulnerability in liner shipping networks
César Ducruet, S.W. Lee, Koi Yu Adolf Ng
To cite this version:
César Ducruet, S.W. Lee, Koi Yu Adolf Ng. Centrality and vulnerability in liner shipping networks: Revisiting the Northeast Asian port hierarchy. Maritime Policy and Management, Taylor & Francis (Routledge), 2010, 37 (1), pp.17-36. �halshs-00458593�
Centrality and vulnerability in liner shipping networks: revisiting
the Northeast Asian port hierarchy
Published in: Maritime Policy and Management 37(1), 17-36
César DUCRUET1
French National Centre for Scientific Research (CNRS) University of Paris I Sorbonne
UMR 8504 Géographie-cités / P.A.R.I.S. 13 rue du Four F-75006 Paris, France Tel. +33 (0)140-464-007 Fax +33(0)140-464-009 Email: [email protected] Sung-Woo LEE
Korea Maritime Institute
Shipping, Port & Logistics Research Department KBS media Center, Sangam-dong, Mapo-gu Seoul, Republic of Korea
Tel: (822) 2105 2830 Fax: (822) 2105 2839 Email: [email protected]
Adolf Koi Yu NG
Department of Logistics and Maritime Studies Faculty of Business
The Hong Kong Polytechnic University Hung Hom, Kowloon, Hong Kong, China Tel: +852 3400 3625 Fax: +852 2330 2704 Email: [email protected] 1 Corresponding author
Centrality and vulnerability in liner shipping networks: revisiting
the Northeast Asian port hierarchy
Abstract
This paper is essentially an empirical investigation in the network analysis of inter-port traffic flows. Based on a database of vessel movements, it applies conventional techniques of network analysis to the graph of Northeast Asian liner networks in 1996 and 2006. Such approach proves particularly helpful for analysing the changing position of major hub ports and for revealing their respective tributary areas within the region. Despite rapid traffic growth at Chinese ports during the period under study, the latter seem to remain polarized by established hubs such as Korean ports and Hong Kong. This research reveals the strong relation between local port policies and the evolution of shipping network design.
Key Words: Graph visualisation, Liner shipping, Network analysis, Northeast Asia, Port
competition
1. Introduction
The relative position of seaports within maritime networks has remained a rather secondary research topic in the literature on shipping and ports. One can observe disequilibrium between a large body of conceptual research and a limited number of applications. While the possible reasons explaining such imbalances are explored in more detail elsewhere [1], a brief review is necessary.
Extensive research on the spatial dynamics of containerisation since its emergence in the 1970s has clarified a number of trends stemming from globalisation and changes in the port and maritime industry. One of them is the global spread of ocean carriers’ networks, which was facilitated by technological improvements (e.g. size, speed) in order to respond to growing demand for cargo movements worldwide [2]. While deploying their fleets, shipping lines have designed their services based on a varied set of requirements from shippers such as time and cost [3]. Spatially, there has been an increasing power of carriers
to decide which ports should be kept in the network along the transport chain [4-6], thus transforming port hierarchies through the fostering of port competition. Empirical observations of these trends have led to a number of theoretical outcomes. Centrality and intermediacy were recognized as the two major facets behind the emergence of hub ports [7], while the concept of port regionalization was more dedicated to the emergence of land-based freight corridors linking seaports with inland logistics hubs, but also with offshore hubs, in a context of vertical integration of transport and logistics activities [8].
Empirically however, the network perspective has been neglected by scholars. Total throughput, as the most widely available indicator of port performance internationally, still bases the majority of comparative studies and serves as principal tool for measuring port performance [9] and the concentration dynamics of port systems [10]. It is analyzed in relation with other indicators using various operations research techniques, notably Data Envelopment Analysis (DEA) and Stochastic Frontier Analysis (SFA) [11], but these methodologies are too aggregated and do not fully reflect the position of ports in networks. Other quantitative research on port performance rarely include network-specific attributes in the analysis, such as the literature on port choice [12] and on the modelling of optimal shipping routes and hub port location [13-14] that are focused on economic profitability. When describing the differentiated regional distribution of individual carriers’ port networks [15-18], geographers have privileged a firm-centric approach rather than a port-centric approach. Arguably, and despite the aforementioned advances, the network analysis of seaports remains a relatively virgin research field.
This paper wishes to measure how ports are positioned in the network as a whole that is including all carriers, services, and ports connected. Such approach is better related with classical methods of network analysis in transport geography [19] that were applied only recently to maritime networks due to lack of data on inter-port flows and difficult traceability of the spatiality of such networks [20]. Surprisingly, Northeast Asia has been largely neglected compared with other regions from such perspective: more likely are studies on the Caribbean [21], the Mediterranean [22], the North Atlantic [23], and the world [24-26]. While such studies well indicate which ports are best positioned in their respective regions, they face two limitations. On the one hand, authors do not clearly introduce the variety of indicators that can be obtained from network analysis tools. On the other hand, they do not show whether network attributes overlap traditional port rankings that are based on either container throughputs or statistical analysis of combined local data (e.g. location, infrastructure efficiency, productivity, etc.). Furthermore, those studies rely
on official liner service data of main ocean carriers provided by Containerisation International Yearbooks, thus neglecting local and feeder services. Nowadays port performance should be better reflected in a port’s ability connecting various scales and networks, from the local to the global, than in the sole generation of traffic [27].
By looking at the North Asian context through the looking glass of port competition, this research cries out for an engagement in methodological improvement for a better analytical outcome. A common challenge faced by established Northeast Asian hub ports is the rapid growth of formerly peripheral ports of which mainly Chinese ports. Port competition in this region is said to have resulted in the lowered supremacy of Hong Kong (China), Busan (Korea), and Kaohsiung (Taiwan) upon their respective neighbours (e.g. Shenzhen and Shanghai), in light of the latter’s increase in the overall port throughput ranking. However, to what extent can we consider throughput figures as accurate indicators of actual port performance? Port competition is a complex and relative reality that cannot be captured solely by individual traffic measures.
Such arguments call for a renewed interest about network analysis in the field of maritime transport and liner shipping. The hypothesis of this paper is that the growth of traffic at Chinese ports does not necessarily imply that they have gained equivalent position within the structure of shipping networks. Applying network analysis at two different years that cover a period of dramatic port competition (1996 and 2006) would enable us to gain insights about the impacts of recent strategies from governments and carriers. This period is chosen as it starts at the eve of the era of post-panamax containerships, resulting in drastic network readjustments within regional port systems.
The remainder of the paper is organized as follows. Methodological issues of network analysis are presented in section two, together with a review of former studies on Northeast Asian ports and liner networks. Section three presents the results in terms of port hierarchy and network structure evolution. Finally, concluding remarks are presented in section four with policy outcomes and further research prospects.
2. Background and methodology
2.1 Port competition in Northeast Asia
Most studies on Northeast Asian ports have opted for the comparison of traffic evolution within different port ranges, in the tradition of port system analysis in transport geography
[28]. A majority of such studies has focussed primarily on Chinese ports or China-related containerisation [29], while others extend the analysis to Northeast Asia as a whole [30-33]. Another bunch of research includes studies of port governance, port development and port competition at Chinese [34-35], South Korean ports [36-37], and also Japanese [38], Taiwanese [39], and North Korean ports [40-41].
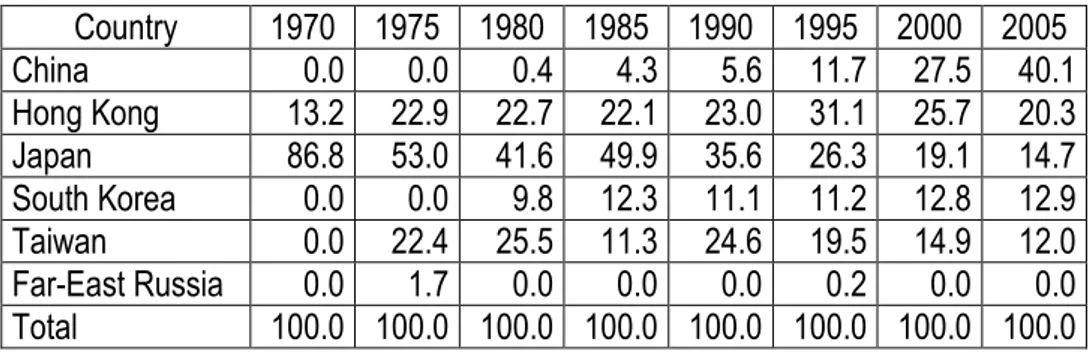
Although it is impossible to cover the field exhaustively, the aforementioned studies provide us with enormous knowledge about the interplay of local, regional and global factors in port development in this particular region of the world. Notably, all indicates that Chinese ports are currently overthrowing their former rivals (i.e. Hong Kong, Kaohsiung, and Busan) through extensive investments in port planning, so as to cope with China’s economic and trade growth following the Open Door Policy (1978) and the establishment of special economic zones along selected coastal cities. Chinese ports welcome an increasing number of direct calls: they are no longer peripheral or feeder ports served by external hub ports. This is justified by infrastructure expansion but also by hinterland penetration of various transport corridors from seaports towards mainland China’s inland cities. As a result, the market share of Chinese ports has increased tremendously, putting a threat on the large hub ports that depended to a large extent on transhipment for their activity. In addition, such hub ports face drastic internal limitations such as rising handling costs and lack of space for further expansion, together with the need for developing activities that better suit a global city, resulting in competing land-use with urban functions [42]. This is reflected in the changing distribution of container traffic (Table 1), where the relative weight of Taiwan, Hong Kong, and Japan has dramatically dropped since the late 1970s at the advantage of Chinese ports (40% is the highest share in 2005), while Korean ports see their position relatively stable along the last two decades, despite severe competition domestically and internationally.
[INSERT TABLE 1 ABOUT HERE]
Unfortunately, it is difficult to verify how such trends are actually reflected in the relative position of ports in the networks themselves. Traffic change may be misleading: rapid growth may occur at poorly positioned ports through few services of large carriers, while established “stars” or hub ports may keep a strong position without further tremendous growth. This echoes broader studies [43] on the inversely proportionate relationship between average traffic size and standard deviation of traffic growth rates in various
regions of the world. To reveal possible discrepancies between the relative position of Northeast Asian ports and their traffic evolution under the period of study, the specification of methodological choices is necessary.
2.2 Data source and preparation
Given that carriers being the direct users of ports, any in-depth analysis of port competition should not only consider large carriers but also small and local services. Another condition is that port competition is a relative process in which ports modify their position - or see their position being modified - in a given network. Therefore, precise data on inter-port flows is necessary, although it is often difficult to access. The solution proposed in this paper is to compute the inter-port vessel movements of Lloyd’s database that covers approximately 98% of the world fleet of fully cellular container vessels in 2006. This data source faces one main limitation however: traffic flows are measured based on vessels’ capacity2 while the share of this capacity handled at each port of call is not known. The vast number and complexity of daily vessel movements for both 1996 and 2006 has been simplified for better clarity, and in order to match the requirements of existing network analysis software as follows:
Aggregation from daily to yearly flows by the sum of vessel capacities that have circulated between ports: this allows to avoid the influence of seasonal effects of traffic variation, and makes the results comparable with yearly port throughput figures;
Graph of direct and indirect linkages: for every vessel, all its ports of calls are considered connected with each other (complete graph) in order not to neglect the basic principle of liner shipping that is the succession of intermediate calls within one single service. The overall graph for Northeast Asia thus corresponds to the combination of all complete graphs from individual vessels;
Aggregation of all services: because data on vessel movements do not detail the type of service operated by the company, we have decided not to arbitrarily distinguish, for instance, intra-regional from extra-regional services or line-bundling from hub-and-spoke services. Another reason is that often, the use of port throughout in maritime studies is also an aggregate figure combining all these aspects into one single measure.
2
Thus, although network attributes are measured among Northeast Asian ports only, they are comparable with throughput figures due to the combination of intra- and extra-regional services in the data. Simple measures of relative position can be extracted from the graph for each port, such as connectivity or maritime degree (i.e. number of connections to other ports), and intermediacy or betweenness centrality (i.e. number of possible shortest paths on which the port is positioned), while the characteristics of the overall structure of the graph can be also measured and visualised. Centrality in this paper is defined from graph theory and network analysis: the relative position of a given node or vertice with regard to other nodes or vertices. It can be related with intermediacy [44] as a level of insertion in carrier networks, but not with the own definition of [44] about centrality, which better relates with land-based accessibility (i.e. proximity to hinterlands or markets).
Total traffic figures calculated from vessel movements are represented in Figure 1 for validating the source used in this paper. It confirms the broad evolution described in Table 1 while providing a more detailed picture about individual ports. Total traffic in deadweight tonnage (DWT) closely matches the usual port rankings of twenty-foot equivalent units (TEU), and the variation between 1996 and 2006 highlights drastic differences between slows or negative growth (Japanese large ports, Taiwan), fast growth (China), and moderate growth (South Korea).
[INSERT FIGURE 1 ABOUT HERE]
3. Results of the network analysis
The application of network analysis follows successive steps. First, the comparison of network attributes with conventional measures of port performance (i.e. container throughput) allows evaluating possible overlaps and discrepancies in respective distribution patterns. Second, the overall structure of the regional network is highlighted by means of statistical description of degree distribution among the ports concerned. Depending on the structure of the network, a third step proposes a visualisation of the network.
Centrality and degree
Comparing the conventional throughput hierarchy of Northeast Asia with basic attributes of connections and centrality provides interesting insights about their respective meaning (Table 2). The main hubs of the region, namely Hong Kong and Busan, stand out by their very strong position in the network at both years, what confirms that centrality best reflects the importance of hub functions. While the concentrations of traffic and degree have lowered (cf. Gini coefficients), centrality has become spikier, because few ports concentrate transhipment activities. Correlation between throughput and degree is higher than with centrality because degree is a broader indicator of port activity mixing trade and transit flows. Decreased correlation between 1996 and 2006 suggests that network position and port performance have become less directly interdependent. A number of factors can explain such results, categorized as follows:
Stronger throughput than network position: some ports are constrained by their geographical situation, such as Guangzhou (upstream river port), Tianjin (western Yellow Sea), or by their proximity to a larger port, such as Shenzhen (Hong Kong), resulting in a lower rank than others in the network despite their important throughput volume. Such ports thus see their degree and centrality lower because their traffic is channelled through few main arteries. The “China effect” can be defined by the generation of huge traffic volume without reaching equivalent network position, partly because such volumes are related with hinterland growth, as seen in recent research on Chinese ports [29]. Ports such as Tianjin, Dalian, and Ningbo, benefit from a strong manufacturing sector and access to expanding inland freight corridors.
Stronger network position than throughput: Incheon is by no means exemplary of how hub functions can give a strong position to a given port without generating equivalent throughout volumes. This is because its hub functions work for smaller volumes with regional foci, notably for Northeast Chinese ports, compared with other bigger hubs, which connect global sea lanes. The investment of Port of Singapore Authority (PSA) in a new container terminal as part of Incheon’s Pentaport project is thus well reflected in its improved position in the network [45]. Gwangyang is also well ranked despite its comparatively lower throughput, as it has been the focus of an ambitious governmental policy to develop a “two-hub port system” since the mid-1990s, for balancing regional development of the Korean peninsula and lowering congestion in Busan, where a new
port has been constructed outside the urban core in the early 2000s [36]. In addition, South Korea’s “hub effect” directly translates its strategy of becoming Northeast Asia’s logistics hub through the development of Free Economic Zones (FEZ), distriparks, and new infrastructure at those locations in order to create a comparative advantage over other ports in the region [46]. Busan Port Authority is currently planning to develop a container terminal in the Russian port of Nakhodka to extend its regional influence [47], while promoting its attractiveness through mileage, tariff discount, and exemption of port dues.
[INSERT TABLE 2 ABOUT HERE]
Vulnerability
Another possible verification of the role of network position in port performance is the comparison of the degree with the level of hub dependence, i.e. the share of the dominant flow connection within total port traffic [48]. As illustrated in Figure 2 and unsurprisingly, there is an inversely proportionate relation between the number of connections and the distribution of traffic among those connections. Although hub dependence accounts only for the dominant connection, it is revelatory of a level of relative weakness or “vulnerability” in the network; further research shall apply more measures on all connections such as concentration (Gini), and entropy [20]. The coefficient R² has remained rather stable over time, despite a slight decrease of 0.7 points, what confirms the robustness of the results.
In 1996, some vulnerability is observed at ports where one preferential relation takes a large part of their traffic, i.e. more than 40%. Such ports are for instance Kaohsiung, ensuring the Taiwan-China link through Hong Kong due to prolonged political tensions across the strait; and Shenzhen, because of its dependence upon Hong Kong before main shipping lines would call there directly [49]; Hong Kong itself due to the previously mentioned cases. Strong ports are those that diversify the distribution of their traffic, such as Busan and some main Japanese ports (e.g. Yokohama, Tokyo).
In 2006 comparatively, Busan has maintained its profile of strong hub but it has been joined in such by Shanghai, which was previously in a weaker position, with more many connections (from 21 to 60) and lower hub dependence (from 32% to 22%). The main difference with other rapidly growing Chinese ports is that they multiply their connections
while being dependent upon another large port. Shenzhen remains dependent upon Hong Kong for more than 66% of its traffic (against 68% in 1996), Ningbo’s traffic is channelled through its neighbour and rival Shanghai (50%), while Gwangyang’s traffic is also polarized to a large extent by its dominant connection with Busan (35%) due to the two-hub port system. This apparent vulnerability shall not hide the fact that many of these ports get embedded within emergent range structures with multiple calls, in a context of regional integration, which is a complement to competition. Such results give empirical confirmation about the importance of path-dependency in port development among adjacent hubs and gateways [50]. The transformation of rapidly emerging ports that were once peripheral into dominant ports is not possible without a stage of hub dependence upon already existing large hubs or gateways. Before reaching a stage of full maturity where their traffic is homogeneously widespread among their connections, they must ensure a series of requirements in order to upgrade not only traffic volume but also network positioning on the long-run.
[INSERT FIGURE 2 ABOUT HERE]
Dynamics
Dynamics within the port hierarchy can be compared according to the Compound Average Growth Rate (CAGR) of each indicator (Table 3). Total throughput growth clearly opposes two groups: Chinese ports and other secondary ports (e.g. Incheon, Vostochniy, and Naha) are growing fast, while Japanese, Taiwanese ports and other large ports (e.g. Busan, Hong Kong) have lower growth. Correlation is higher with degree than with centrality. Yet, the fastest growing throughputs are also ports that increased their centrality in the network (i.e. Shenzhen, Shanghai, Xiamen, and Incheon). Busan stands out among low-paced growing ports, what is also reflected in its higher degree and centrality growth than other large ports. Some of the latter have even seen their network position worsening along the period: Hong Kong, Taichung, and Yokohama observe negative growth, while others stagnate. The drastic contrast offered by the rapid growth of Chinese ports is explained by more direct calls from ocean carriers in Shenzhen since the late 1990s [50], the rather aggressive policy of Shanghai regarding the development of an international shipping centre and the new port extension underway on Yangshan Island [51], the shift of some trade routes towards Chinese Yellow Sea ports such as Qingdao [52], and the spread of global terminal
operators such as Hutchinson Port Holdings (HPH) in Shenzhen and Xiamen [29]. Such trends have contributed to lowering Hong Kong’s predominance over Chinese ports during the last decade [53], while this global hub port city has evolved towards more value-added activities [54] in a context of cross-border integration [55].
[INSERT TABLE 3 ABOUT HERE]
The cases of Japan and Taiwan offer additional evidence about the interplay of network position and throughput dynamics. For Japan, slow port growth and limited centrality directly reflect the government’s reluctance for further developing new port infrastructure: ports keep a trade function rather than a transit function, which is left to South Korea [38]. This approach is motivated by an environment-friendly policy wishing to favour short-sea shipping rather than trucking, and reducing high inland logistics costs, while avoiding the expansion and multiplication of port terminals along a densely urbanised coastline. For Taiwan, the explanation of limited performance comes from the stagnation of traffic as a result of the underestimation of Chinese port growth. The reduced number of weekly calls at Kaohsiung between 1997 and 2002 [56], however, is also explained by industrial relocations from Taiwan to China. From 2009, domestic competition from Taipei port (Keelung) occurs through the opening of two container terminals and the possible shift of Evergreen, Yangming, and Wanhai from Kaohsiung [57], but this would need an update of our data in order to become visible in the results.
3.2 Network structure
One of the most evident characters of liner networks is their scale-free structure, i.e. a degree distribution following a power law [58]. It signifies that the network is polarized by few main nodes with many connections, while numerous ports have only a limited number of connections. This applies to the network structure of Northeast Asia (Figure 3). One interesting feature is the evolution towards a less polarized network: the slope of the line has decreased from -0.886 to -0.823, while the R² also has decreased from 0.75 to 0.71. This underlines an increased integration of the network, possibly through the better position of some formerly weaker ports, as a result of port growth and port competition. From such results it can be hypothesized that Chinese ports have gained position in the
network at the expense of established hubs and load centres in Japan, Korea, Taiwan, and Hong Kong.
[INSERT FIGURE 3 ABOUT HERE]
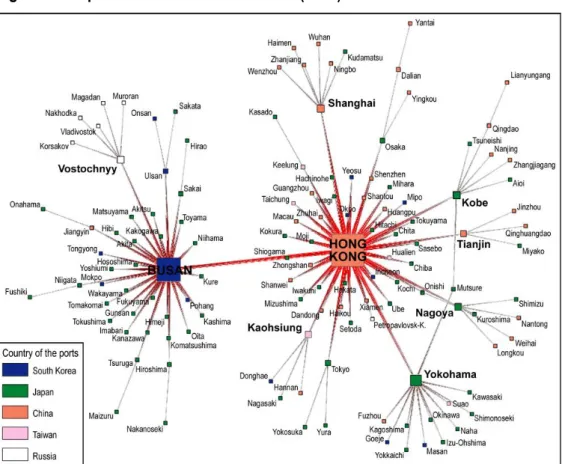
More evidence about where changes occurred is brought by Figures 4 and 5. This methodology to reveal the geographical structure of the network retains in the graph only the dominant flow of each port with another port. For instance, among all of Busan’s connections, only the one with Hong Kong is kept because it is superior to all its other connections in traffic weight. In the end, the number of ports (vertices) and the number of links (edges) is equal, except for some ports that have two dominant connections of equal value. This approach is particularly useful for revealing the deep structure of the network while gaining clarity, notably for large and complex networks as in liner shipping. The size of the nodes is represented by a hierarchy of betweenness centrality and the belonged country of the ports is differentiated by greyscale and colour.
In 1996, we observe a bipolar network structure polarized by Hong Kong and Busan. The distribution of their respective tributary areas (i.e. ports depending on them) is geographically relevant: Busan polarizes mostly second-order Japanese and Russian Far-East ports, while Hong Kong dominates Chinese and first-order Japanese ports. This structure clearly shows on what grounds Busan and Hong Kong can be denominated hub ports. There is also a relatively clear geographical delimitation between their satellites. Despite their strong traffic, first order Japanese ports (e.g. Yokohama, Nagoya, Tokyo, Kobe, and Osaka) have in fact a narrow tributary area limited to a few ports, probably because the scattering of such ports along the Japanese coast has prevented the emergence of hub functions [36], thus leaving this function to Busan in Korea. In fact, Busan does only polarize smaller Japanese ports scattered in the North and West coasts of the country (e.g. Niigata, Akita), making its tributary area rather specialized compared with Hong Kong and even large Japanese ports that show more variety. Other secondary poles are Vostochniy (Russia) dominating only Russian ports and Kaohsiung with fewer satellites despite its size (i.e. Donghae, Nagasaki, and Hannan), probably due to its preferential linkage with Hong Kong for Chinese trade. Finally, Chinese ports are poorly represented in the graph: only Shanghai and Tianjin stand out, and their tributary area is mostly confined to domestic ports.
[INSERT FIGURE 4 ABOUT HERE]
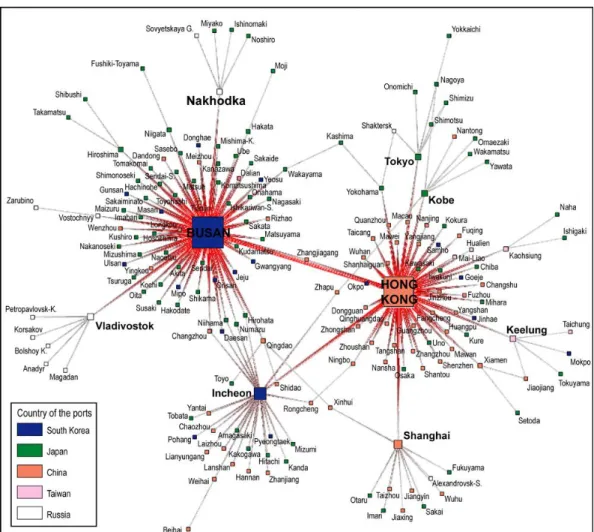
Network integration becomes apparent with the evolution from a bipolar to a tripolar structure, but this has not occurred at the advantage of Chinese ports. In fact, not only Busan has superseded Hong Kong at the head of the graph, but Incheon, the other large South Korean port, has gained position far beyond the so-called Chinese competitors [45]. For Incheon, the distribution of its satellites shows a clear specialisation towards Chinese Yellow Sea ports located in proximity (e.g. Weihai, Yantai), but also towards second-order Japanese ports that shifted from the influence of Busan and Hong Kong (e.g. Kakogawa, Hitachi).
Another aspect of change is the diversification of Busan’s influence in parallel to the ongoing specialisation of Hong Kong’s. Busan has spread its tributary area to more many ports not only in Japan but also in China and within South Korea. In comparison, Hong Kong seems to have specialised in the polarization of Chinese ports, although it keeps a firm dominance upon large Japanese ports, Taiwan, and main Chinese gateways. Shanghai has gained three more ports under its influence, but its tributary area remains limited in comparison with its overall traffic growth. Other fast-growing Chinese ports as well remain relatively peripheral compared with their tremendous increase in traffic volumes along the study period, such as Ningbo, Shenzhen, Qingdao, and Xiamen. Networks have spread in a way that such ports remain, in the end, under the influence of a larger hub or gateway. Such results seem to give credit to former quantitative analysis of Asian ports’ performance, notably on the negative impact of handling costs and mainland competition for Hong Kong [59]. However, our results on Busan show discordant evidence, since congestion, lack of space, insufficient infrastructure, and severe domestic competition (i.e. from Pyeongtaek and Gunsan ports) seem to have been overcome through new port construction and the two-hub port strategy, in contrast of recent result from shift-share analysis [37]. Kaohsiung was better ranked than Busan using hierarchical fuzzy process [59], but its position remains far below Busan in our results, and in other recent studies of port competition [33]. Differences in methodology, data, and research objectives may, of course, explain such gaps.
[INSERT FIGURE 5 ABOUT HERE]
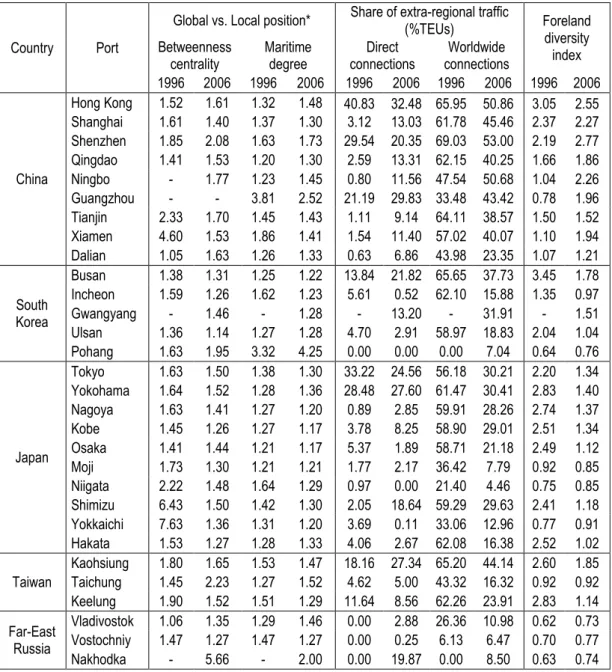
This third step of the analysis is motivated by the influence of the regional context on our results: the network position of some ports may vary according to the geographical scale of analysis. Northeast Asia remains an abstract entity used for analytical coherence whereas shipping networks connect to other regions regardless of such delimitations. We compare regional results with those obtained at the world level for main Northeast Asian ports using ratios (Table 4). This analysis is complemented by a look at the shares of extra-regional traffic, based on direct (i.e. previous and next ports of call) and worldwide (i.e. including all connected ports) connections. Finally, the relative diversity index3 evaluates the geographic variety of each port’s worldwide traffic distribution, while Figure 6 applies this measure to all Northeast Asian ports.
[INSERT TABLE 4 ABOUT HERE]
Because the world network is larger than the Northeast Asian sub-network, centrality and degree are always higher in the first. The amplitude and evolution of the gap help revealing differences of spatial reach between ports. For instance among main ports, some have improved their global position: Hong Kong, Shenzhen, Qingdao, Dalian, Osaka, Taichung, and Vladivostok. The opposite trend (reduced global position compared with regional position) concerns almost all other ports, and should be interpreted as the influence of regional integration rather than a sign of retreat from the world system. It indicates how some ports have become more densely embedded locally, because of the establishment of more local services linking neighbouring ports, as in the cases of Shanghai, Busan, but also Tokyo and Yokohama.
Regional integration is also responsible for the importance and evolution of the share of extra-regional traffic. Direct connections reflect the immediate spatial reach; ports with a higher share of traffic outside Northeast Asia can be considered more powerful as they are more international. All Chinese ports except Hong Kong and Shenzhen have increased their share in a context of growth and internationalization, but also Busan, Nagoya, Kobe, Taichung, and Russian ports. Such ports increasingly connect to other regions outside Northeast Asia, while other ports - which are already established ports - receive an
3 The distribution of each port’s foreland is based on the worldwide circulation of vessels, whose capacity
was summed by connected country. This index is the inverse of the sum of absolute differences in traffic shares at country level worldwide.
increasing number of feeder services from their smaller competitors. Thus, the hub-and-spoke structure observed in Figures 4 and 5 is also the result of regional integration processes by which secondary ports develop through hub dependence. In terms of worldwide connections, the same dynamics are visible. Only Guangzhou, Ningbo, Vostochniy, and Nakhodka see this share increasing, what indicates a special ability to reduce their dependence upon their respective hubs (i.e. Hong Kong, Shanghai, and Busan). A special case is Incheon, whose recent development as local hub has made its traffic more regionalized.
A look at the level of foreland geographic diversity provides a good synthesis of former results. Shenzhen has the highest score in 2006, followed by Hong Kong and some Chinese ports. Busan has thus lost its first position in such perspective, but it is also the case of Hong Kong, Shanghai, and most other Korean and Japanese ports. The integration of Chinese ports into global transport and logistics chains in such a rapid way has shifted the centre of gravity of the global maritime system. This catching-up does not contradict the observed fact that major hubs continue to exert dominant polarization within the region. Geographic diversity of shipping connections is closely related with traffic size (Figure 6), but many Chinese ports are in fact outliers since their foreland diversity is higher than their traffic volume would predict. Thus, regionalization, globalization, and hub polarization processes are not contradictory but interdependent. Research on such topics is only at its eve when it comes to provide relevant, comparable, and internationally valid measures. Further research is highly needed, notably in relation with the evolution of port hinterlands, as suggested in recent research [60].
[INSERT FIGURE 6 ABOUT HERE]
4. Conclusion
The network analysis of inter-port traffic connections among Northeast Asian ports is fruitful in many ways. Indicators of centrality, connectivity, and vulnerability do not always overlap the hierarchy of traffic volume derived from official port statistics. Arguing that the sole traffic hierarchy may be insufficient in addressing issues of port competition and competitiveness, this paper has provided a different perspective that can be summarized by three main outcomes. First, traffic growth and improved centrality of Chinese ports seem not to have profoundly modified the network structure, which remains
polarized by already established hub ports of Hong Kong and Busan. This may be explained by the technological advance of such hubs in terms of container handling efficiency (e.g. productivity), their efforts in maintaining, improving, and expanding existing infrastructure to reduce congestion, and the memory effect of shipping lines in the port selection process. Thus, our results imply that there is a strong influence of local port policies on shipping network design. Another important factor explaining the uneven centrality of ports is the different role of shippers and shipping lines in the port selection process. Some ports are more the focus of shipping lines’ hub-and-spoke strategies, while others tend to be selected by shippers for direct call services. In reality those two dimensions overlap while data on transport chains established by shippers and forwarders is hardly available.
Second, there is an evolutionary process of port development that is only visible through inter-port data: new ports and secondary ports, which strive for survival by catching more traffic, go through a phase of vulnerability defined by preferential attachment to a larger neighbouring hub or gateway. While this may be influenced by natural factors (e.g. remoteness, upstream location) and functional factors (e.g. gateway ports, range effect of multiple calls), successful ports have diversified their connections and lowered their vulnerability.
Third, the comparison of local and global attributes of ports has made evident the ongoing process of regional integration. Spatial discontinuities between countries is thus making maritime transport an essential link in this process, where ports tend to exchange relatively more within the region than with outside the region. Larger ports often have a longer spatial reach and more diversely distributed foreland connections than smaller ports. Further research shall be orientated towards several possible directions. One of them is the necessary statistical analysis of the new indicators (centrality, degree, hub dependence, foreland diversity index) using, for instance, factor analysis and multiple regression, in order to determine which of them best explain traffic volume and traffic growth. Additional variables should be added based on local characteristics, such as infrastructure, handling equipment, nautical accessibility, governance structure, and performance, allowing a good overview of the role of network indicators. Another line of further research is the refinement of network attributes. Inter-port traffic could be measured by frequency or average capacity circulated, instead of total capacity. Daily vessel movements could allow for a more in-depth analysis of the share of transhipment in total port traffic, by distinguishing feeders from mother vessels. Such improvements would have many
practical implications for port policy, and could be extended to other regions of the world experiencing similar trends.
Acknowledgements
The authors would like to thank the anonymous reviewers for their useful comments on an earlier version of this paper. Thanks also go to Ms. Joey Wong, Administrative Editor of the journal, for her efficient support during the evaluation process.
References
[1] DUCRUET, C., ROZENBLAT, C., and ZAIDI, F., 2009, Ports in maritime networks: evidence from the Atlantic (1996-2006). Journal of Transport Geography (forthcoming).
[2] CULLINANE, K. P. B., and KHANA, M., 2000, Economies of scale in large containerships: optimal size and geographical implications. Journal of Transport Geography, 8, 181-195.
[3] NOTTEBOOM, T. E., 2004, Container shipping and ports: an overview. Review of Network Economics, 3(2), 86-106.
[4] SLACK, B., 1993, Pawns in the game: ports in a global transportation system. Growth and Change, 24(4), 579-588.
[5] ROBINSON, R., 2002, Ports as elements in value-driven chain systems: the new paradigm. Maritime Policy and Management, 29(3), 241-255.
[6] FREMONT, A., 2007, Le Monde en Boîtes: Conteneurisation et Mondialisation (Paris: INRETS).
[7] HAYUTH, Y., and FLEMING, D. K., 1994, Concepts of strategic commercial location: the case of container ports. Maritime Policy and Management, 21(3), 187-193.
[8] NOTTEBOOM, T. E., and RODRIGUE, J. P., 2005, Port regionalization: towards a new phase in port development. Maritime Policy and Management, 32(3), 297-313. [9] DE LANGEN, P. W., NIJDAM, M. H., and VAN DER HORST, M. R., 2007, New
indicators to measure port performance. Journal of Maritime Research, 4(1), 23-36. [10] NOTTEBOOM, T. E., 2006b, Traffic inequality in seaport systems revisited. Journal
of Transport Geography, 14, 95-108.
[11] TONGZON, J., and HENG, W., 2005. The technical efficiency of container ports: comparing data envelopment analysis and stochastic frontier analysis. Transportation Research A: Policy and Practice, 40(4), 354-374.
[12] NG, K. Y. A., 2009, Port Competition: The Case of North Europe (Saarbrücken: VDM Verlag).
[13] BAIRD, A. J., 2006, Optimising the container transhipment hub location in northern Europe. Journal of Transport Geography, 14(3), 195-214.
[14] WU, Q. T., and ZHANG, H. O., 2009, Optimal hub port location in China-Northern European container liner route. Paper presented at the 14th Hong Kong Society for Transportation Studies (HKSTS) International Conference, Hong Kong Baptist University, December 12-14.
[15] COMTOIS, C., and WANG, J. J., 2003, Géopolitique et transport : nouvelles perspectives stratégiques dans le détroit de Taiwan. Études Internationales, 34(2), 213-226.
[16] RIMMER, P. J., and COMTOIS, C., 2005, China’s extra and intra-Asian liner shipping connections 1990-2000. Journal of International Logistics and Trade, 3, 75-97.
[17] FREMONT, A., and SOPPE, M., 2005, Transport maritime conteneurisé et mondialisation. Annales de Géographie, 642, 187-200.
[18] FREMONT, A., 2007, Global maritime networks: The case of Maersk. Journal of Transport Geography, 15(6), 431-442.
[19] KANSKY, K. J., 1963, Structure of Transportation Networks: Relationship between Network Geometry and Regional Characteristics (Chicago: University of Chicago). [20] DUCRUET, C., 2009, Performance and vulnerability of seaports: a study based on
worldwide containerships’ movements, 1996-2006. Paper presented at the WCTR SIG-2 Conference, Antwerp, Belgium, May 7-8.
[21] McCALLA, R., SLACK, B., and COMTOIS, C., 2005, The Caribbean basin: adjusting to global trends in containerization. Maritime Policy and Management, 32, 245-261.
[22] CISIC, D., KOMADINA, P., and HLACA, B., 2007, Network analysis applied to Mediterranean liner transport system. Paper presented at the International Association of Maritime Economists Conference, Athens, Greece, July 4-6.
[23] HELMICK, J. S., 1994, Concentration and connectivity in the North Atlantic liner port network, 1970-1990. Unpublished PhD Dissertation, Miami, University of Miami. [24] JOLY, O., 1999, La structuration des réseaux de circulation maritime. Unpublished
PhD Dissertation in Territorial Planning, Le Havre, Le Havre University.
[25] ANGELOUDIS, P., BICHOU, K. and BELL, M. G. H., 2007, Security and reliability of the liner container-shipping network: analysis of robustness using a complex network framework. In: Risk Management in Port Operations, Logistics and Supply Chain Security, edited by K. Bichou, M. G. H. Bell, and A. Evans (London: Informa), pp. 95-106.
[26] WANG, C. J., 2008, Spatial organization of world maritime container transportation networks. Geographical Research, 27(3), 636-648 (in Chinese).
[27] DE ROO, P., 1994, Marseille : de l’aire portuaire à l’aire métropolitaine. In : Ville et Port XVIIIe – XXe siècles, edited by M. Collin (Paris: L’Harmattan), pp. 107-113. [28] DUCRUET, C., ROUSSIN, S., and JO, J. C., 2009, Going West? Spatial polarization
of the North Korean port system. Journal of Transport Geography, 17(5), 357-368. [29] RIMMER, P. J., and COMTOIS, C., 2009, China’s container-related dynamics
1990-2005. Geojournal, 74, 35-50.
[30] ROBINSON, R., 1998, Asian hub/feeder nets: the dynamics of restructuring. Maritime Policy and Management, 25, 21-40.
[31] RIMMER, P. J., 2004, Global flows, local hubs, platforms, corridors and regional economic integration in Northeast Asia. Journal of International Logistics and Trade, 1, 1-18.
[32] NOTTEBOOM, T. E., 2006, Container throughput dynamics in the East Asian container port system. Journal of International Logistics and Trade, 4, 31-52.
[33] YAP, W. Y., LAM, J. S. L., and NOTTEBOOM, T. E., 2006, Developments in container port competition in East Asia. Transport Reviews, 26, 167-188.
[34] WANG, J. J., NG, K. Y. A., and OLIVIER, D., 2004, Port governance in China: a review of policies in an era of internationalizing port management practices. Transport Reviews, 11(3), 237-250.
[35] CULLINANE, K. P. B, TENG, Y., and WANG, T. F., 2005, Port competition between Shanghai and Ningbo. Maritime Policy and Management, 32, 331-346.
[36] FREMONT, A. and DUCRUET, C., 2005, The emergence of a mega-port, the case of Busan, from the local to the global. Tijdschrift voor Econ. En Soc. Geografie, 96, 421-432.
[37] LEE, S. W., and KIM, G. S., 2009, Port challenge in Northeast Asia: Korea’s two-hub port strategy. In: Ports in Proximity: Competition and Coordination among Adjacent Seaports, edited by T.E. Notteboom, C. Ducruet, and P.W. De Langen (Aldershot: Ashgate), pp. 247-260.
[38] SHINOHARA, M., 2009, Port competition paradigms and Japanese port clusters. In: Ports in Proximity: Competition and Coordination among Adjacent Seaports, edited by T.E. Notteboom, C. Ducruet, and P.W. De Langen (Aldershot: Ashgate), pp. 237-246. [39] HAYNES, K. E., HSING, Y. M., and STOUGH, R. R., 1997, Regional port dynamics
in the global economy: the case of Kaohsiung. Taiwan. Maritime Policy and Management, 24, 93-113.
[40] JO, J. C., and DUCRUET, C., 2007, Rajin-Seonbong, new gateway of Northeast Asia. Annals of Regional Science, 41(4), 927-950.
[41] DUCRUET, C., and JO, J. C., 2008, Coastal cities, port activities and logistic constraints in a socialist developing country: the case of North Korea. Transport Reviews, 28(1), 1-25.
[42] LEE, S. W., SONG, D. W., and DUCRUET, C., 2008, A tale of Asia’s world ports: the spatial evolution in global hub port cities. Geoforum, 39(1), 372-385.
[43] LEMARCHAND, A., and JOLY, O., 2009, Regional integration and maritime range. In: Ports in Proximity: Competition and Coordination among Adjacent Seaports, edited by T.E. Notteboom, C. Ducruet, and P.W. De Langen (Aldershot: Ashgate), pp. 87-98.
[44] FLEMING, D. K., and HAYUTH, Y., 1994, Spatial characteristics of transportation hubs: centrality and intermediacy. Journal of Transport Geography, 2(1), 3-18.
[45] DUCRUET, C., 2007, Incheon. In: The Oxford Encyclopedia of Maritime History, edited by J. B. Hattendorf (Oxford: Oxford University Press).
[46] LEE, S. W., and KIM, C. H., 2006, Performance evaluation of Asian port distriparks using factor analysis. Ocean Policy Research, 21, 52-82.
[47] KMI, 2008, Far-East Russian Port Development (Seoul: Korea Maritime Institute). [48] DUCRUET, C., 2008, Hub dependence in constrained economies: the case of North
Korea. Maritime Policy and Management, 35, 374-388.
[49] WANG, J. J., 1998, A container load center with a developing hinterland: A case study of Hong Kong. Journal of Transport Geography, 6, 187-201.
[50] NOTTEBOOM, T. E., 2009, Path dependency and contingency in the development of multi-port gateway regions and multi-port hub regions. In: Ports in Proximity: Competition and Coordination among Adjacent Seaports, edited by T.E. Notteboom, C. Ducruet, and P.W. De Langen (Aldershot: Ashgate), pp. 55-72.
[51] WANG, J. J., and SLACK, B., 2004, Regional governance of port development in China: a case study of Shanghai International Shipping Center. Maritime Policy and Management, 31(4), 357-373.
[52] LEE, J. Y., and RODRIGUE, J. P., 2006, Trade reorientation and its effects on regional port systems: the Korea-China link along the Yellow Sea rim. Growth and Change, 37(4), 597-619.
[53] CULLINANE, K. P. B., FEI, W. T., and CULLINANE, S., 2004, Container terminal development in Mainland China and its impact on the competitiveness of the port of Hong Kong. Transport Reviews, 24, 33-56.
[54] WANG, J. J., 2009, Hong Kong in transition from a hub port city to a global supply chain management center. In: Ports in Proximity: Competition and Coordination among Adjacent Seaports, edited by T.E. Notteboom, C. Ducruet, and P.W. De Langen (Aldershot: Ashgate), pp. 261-272.
[55] LEE, S. W., and DUCRUET, C., 2009, Spatial glocalization in Asia-Pacific hub port cities: a comparison of Hong Kong and Singapore. Urban Geography, 30, 162-184. [56] TAI, H. H., and HWANG, C. C., 2005, Analysis of hub port choice for container
trunk lines in East Asia. Journal of the Eastern Asia Society for Transportation Studies, 6, 907-919.
[57] CARGONEWS KOREA, 2009, March 25, http://www.cargonews.co.kr (Accessed August 2009).
[58] BARABASI, A. L., and ALBERT, R., 1999, Emergence of scaling in random networks. Science, 286(5439), 509-512.
[59] YEO, G. T., and SONG, D. W., 2006, An application of the hierarchical fuzzy process to container port competition: policy and strategic implications. Transportation, 33(4), 409-422.
[60] NOTTEBOOM, T. E., and RODRIGUE, J. P., 2009, Foreland-based regionalization: integrating offshore hubs with port hinterlands. Proceedings of the International Forum on Shipping, Ports and Airports (IFSPA), Hong Kong Polytechnic University, May, pp. 400-417.
Table 1. Distribution of Northeast Asian container port traffic (1970-2005) (Unit: % TEUs) Country 1970 1975 1980 1985 1990 1995 2000 2005 China 0.0 0.0 0.4 4.3 5.6 11.7 27.5 40.1 Hong Kong 13.2 22.9 22.7 22.1 23.0 31.1 25.7 20.3 Japan 86.8 53.0 41.6 49.9 35.6 26.3 19.1 14.7 South Korea 0.0 0.0 9.8 12.3 11.1 11.2 12.8 12.9 Taiwan 0.0 22.4 25.5 11.3 24.6 19.5 14.9 12.0 Far-East Russia 0.0 1.7 0.0 0.0 0.0 0.2 0.0 0.0 Total 100.0 100.0 100.0 100.0 100.0 100.0 100.0 100.0 Source: realized by authors based on Containerisation International data
Table 2. Throughput vs. network position (1996-2006)
Port Throughput 1996 Port 2006
(000s)* Maritime degree** Betweenness centrality** Throughput (000s) Maritime degree Betweenness centrality
Hong Kong 13,460 41 1,552 Hong Kong 23,230 38 1,492
Kaohsiung 5,063 19 334 Shanghai 21,710 60 3,724 Busan 4,725 43 2,316 Shenzhen 18,468 20 105 Yokohama 2,334 33 608 Busan 12,030 77 6,579 Keelung 2,320 16 143 Kaohsiung 9,775 28 542 Tokyo 2,311 18 255 Qingdao 7,702 36 588 Kobe 2,229 30 717 Ningbo 7,068 26 292 Shanghai 1,930 21 403 Guangzhou 6,600 4 0 Nagoya 1,469 25 313 Tianjin 5,900 17 165 Shenzhen 1,032 6 13 Xiamen 4,019 23 386 Osaka 988 27 369 Tokyo 3,665 29 363 Qingdao 810 16 281 Dalian 3,212 25 206 Tianjin 800 13 51 Yokohama 3,200 31 631 Taichung 695 13 76 Nagoya 2,752 36 495 Xiamen 400 5 1 Kobe 2,413 37 944 Incheon 343 9 225 Osaka 1,906 35 456 Hakata 309 16 111 Gwangyang 1,760 35 635 Tomakomai 241 6 153 Incheon 1,380 28 1,321 Shimizu 210 8 0 Lianyungang 1,302 6 1 Vostochniy 78 6 186 Taichung 1,204 13 24 Yokkaichi 48 11 2 Zhongshan 1,173 2 0 Niigata 45 6 26 Yingkou 1,010 2 0 Oita 3 3 1 Fuzhou 1,000 9 49 GINI 0.67 0.36 0.64 GINI 0.52 0.35 0.68 Correlation with
throughput 0.715 0.708 Correlation with throughput 0.626 0.539 Source: realized by authors based on Containerisation International, LMIU data and TULIP software
* Container throughput figures in TEUs are based on data availability ** Results are based on the graph of direct inter-port linkages
Table 3. Throughput growth vs. network dynamics (1996-2006)
Port Throughput CAGR growth Maritime
degree Betweenness centrality
Shenzhen 0.334 0.128 0.235 Shanghai 0.274 0.111 0.249 Xiamen 0.260 0.165 0.944 Qingdao 0.253 0.084 0.077 Tianjin 0.221 0.027 0.125 Naha 0.210 0.052 - Incheon 0.149 0.120 0.194 Vostochniy 0.141 0.062 0.074 Yokkaichi 0.129 0.038 0.384 Busan 0.098 0.060 0.110 Kaohsiung 0.068 0.040 0.050 Osaka 0.068 0.026 0.022 Nagoya 0.065 0.037 0.047 Taichung 0.057 0.000 -0.110 Hong Kong 0.056 -0.008 -0.004 Tokyo 0.047 0.049 0.036 Tomakomai 0.034 0.052 -0.020 Yokohama 0.032 -0.006 0.004 Mean 0.134 0.058 0.142
Correlation with throughput
growth 0.744 0.582
Source: realized by authors based on Containerisation International, LMIU data and TULIP software
Table 4. Geographic variations of network position (1996-2006)
Country Port
Global vs. Local position* Share of extra-regional traffic (%TEUs) Foreland diversity index Betweenness
centrality Maritime degree connections Direct connections Worldwide
1996 2006 1996 2006 1996 2006 1996 2006 1996 2006 China Hong Kong 1.52 1.61 1.32 1.48 40.83 32.48 65.95 50.86 3.05 2.55 Shanghai 1.61 1.40 1.37 1.30 3.12 13.03 61.78 45.46 2.37 2.27 Shenzhen 1.85 2.08 1.63 1.73 29.54 20.35 69.03 53.00 2.19 2.77 Qingdao 1.41 1.53 1.20 1.30 2.59 13.31 62.15 40.25 1.66 1.86 Ningbo - 1.77 1.23 1.45 0.80 11.56 47.54 50.68 1.04 2.26 Guangzhou - - 3.81 2.52 21.19 29.83 33.48 43.42 0.78 1.96 Tianjin 2.33 1.70 1.45 1.43 1.11 9.14 64.11 38.57 1.50 1.52 Xiamen 4.60 1.53 1.86 1.41 1.54 11.40 57.02 40.07 1.10 1.94 Dalian 1.05 1.63 1.26 1.33 0.63 6.86 43.98 23.35 1.07 1.21 South Korea Busan 1.38 1.31 1.25 1.22 13.84 21.82 65.65 37.73 3.45 1.78 Incheon 1.59 1.26 1.62 1.23 5.61 0.52 62.10 15.88 1.35 0.97 Gwangyang - 1.46 - 1.28 - 13.20 - 31.91 - 1.51 Ulsan 1.36 1.14 1.27 1.28 4.70 2.91 58.97 18.83 2.04 1.04 Pohang 1.63 1.95 3.32 4.25 0.00 0.00 0.00 7.04 0.64 0.76 Japan Tokyo 1.63 1.50 1.38 1.30 33.22 24.56 56.18 30.21 2.20 1.34 Yokohama 1.64 1.52 1.28 1.36 28.48 27.60 61.47 30.41 2.83 1.40 Nagoya 1.63 1.41 1.27 1.20 0.89 2.85 59.91 28.26 2.74 1.37 Kobe 1.45 1.26 1.27 1.17 3.78 8.25 58.90 29.01 2.51 1.34 Osaka 1.41 1.44 1.21 1.17 5.37 1.89 58.71 21.18 2.49 1.12 Moji 1.73 1.30 1.21 1.21 1.77 2.17 36.42 7.79 0.92 0.85 Niigata 2.22 1.48 1.64 1.29 0.97 0.00 21.40 4.46 0.75 0.85 Shimizu 6.43 1.50 1.42 1.30 2.05 18.64 59.29 29.63 2.41 1.18 Yokkaichi 7.63 1.36 1.31 1.20 3.69 0.11 33.06 12.96 0.77 0.91 Hakata 1.53 1.27 1.28 1.33 4.06 2.67 62.08 16.38 2.52 1.02 Taiwan Kaohsiung 1.80 1.65 1.53 1.47 18.16 27.34 65.20 44.14 2.60 1.85 Taichung 1.45 2.23 1.27 1.52 4.62 5.00 43.32 16.32 0.92 0.92 Keelung 1.90 1.52 1.51 1.29 11.64 8.56 62.26 23.91 2.83 1.14 Far-East Russia Vladivostok 1.06 1.35 1.29 1.46 0.00 2.88 26.36 10.98 0.62 0.73 Vostochniy 1.47 1.27 1.47 1.27 0.00 0.25 6.13 6.47 0.70 0.77 Nakhodka - 5.66 - 2.00 0.00 19.87 0.00 8.50 0.63 0.74 Source: realized by authors based on LMIU data and TULIP software
Figure 1. Traffic volume and growth at Northeast Asian ports (1996-2006)
Figure 2. Network vulnerability of Northeast Asian ports (1996-2006)
Source: realized by authors based on LMIU data
Figure 3. Scale-free structure of the Northeast Asian liner network (1996-2006)
Figure 4: Graph of dominant flow structure (1996)
Figure 5: Graph of dominant flow structure (2006)
Source: realized by authors based on LMIU data and TULIP software
Figure 6: Traffic volume and geographic variety (1996-2006)