HAL Id: hal-03097399
https://hal.archives-ouvertes.fr/hal-03097399
Submitted on 5 Jan 2021
HAL is a multi-disciplinary open access
archive for the deposit and dissemination of
sci-entific research documents, whether they are
pub-lished or not. The documents may come from
teaching and research institutions in France or
abroad, or from public or private research centers.
L’archive ouverte pluridisciplinaire HAL, est
destinée au dépôt et à la diffusion de documents
scientifiques de niveau recherche, publiés ou non,
émanant des établissements d’enseignement et de
recherche français ou étrangers, des laboratoires
publics ou privés.
impact on seasonal new, regenerated and export
production
Camila I. Fernandez, P Raimbault
To cite this version:
Camila I. Fernandez, P Raimbault. Nitrogen regeneration in the NE Atlantic Ocean and its impact
on seasonal new, regenerated and export production. Marine Ecology Progress Series, Inter Research,
2007, 337, pp.79-92. �10.3354/meps337079�. �hal-03097399�
INTRODUCTION
New and regenerated production (Dugdale & Goer-ing 1967) are 2 important variables characterizGoer-ing the efficiency of carbon and nitrogen cycling. Through the ƒ ratio (Eppley & Peterson 1979), both variables com-bine to give an estimation of the fraction of biological production that can be potentially exported to the deep ocean. New production has long been defined as the fraction of primary production driven by the input of nutrients (mostly nitrate) into the euphotic zone, while regenerated production is fuelled by recycled nitrogen (mainly ammonium and dissolved organics) produced in situ by heterotrophic processes. However, in recent years, an accurate definition as well as a precise
esti-mation of the efficiency of the biological pump has become of crucial importance when defining the role of oceanic areas in the sequestration of atmospheric CO2(Takahashi et al. 2002).
Nitrification (the oxidation of NH4+to NO3–mediated
by bacteria) is an important variable, not only consid-ered responsible for the deep nitrate reservoir but also believed to provide a source of in situ regenerated nitrate at the base of the euphotic zone (where phyto-plankton is light-limited to compete for NH4+; see
review by Ward 2000). Nitrification in surface layers may also cause an overestimation of new production through autotrophic uptake of recycled nitrate in the euphotic zone (Ward 1987, Ward et al. 1989, Eppley & Renger 1992, Gentilhomme & Raimbault 1994, Dore &
© Inter-Research 2007 · www.int-res.com *Email: [email protected]
Nitrogen regeneration in the NE Atlantic Ocean
and its impact on seasonal new, regenerated and
export production
Camila Fernández I.
1, 2,*, Patrick Raimbault
11Laboratoire d’Océanographie et de Biogéochimie, Centre d’Océanologie de Marseille, 163 Av. de Luminy, Case 901, PO Box 13288, Marseille, France
2Present address: Laboratorio de Procesos Oceanográficos y Clima (PROFC), Departamento de Oceanografía, Universidad de Concepción, Casilla 160-C, Concepción, Chile
ABSTRACT: Nitrate and ammonium assimilation, nitrification and ammonium regeneration were measured during field experiments in the NE Atlantic (39 to 44.5° N, 16 to 21° W; Programme Océan Multidisciplinaire Méso Echelle) in 2001. NH4+and NO2–concentrations were high during winter and
spring, reaching maximum values of 0.3 and 0.6 μM, respectively, in the top 100 m. 15N tracer
exper-iments allowed the measurement of nitrification throughout the water column, and rates in surface waters varied between 0.02 μM d–1in winter and 0.077 μM d–1in spring. At 30 m depth, rates could
exceed 0.1 μM d–1during the spring bloom. For the winter season, nitrification could account for 40%
of the assimilated nitrate. During spring, nitrification could support more than 20% of nitrate assimi-lation. Ammonium regeneration was significant during both seasons, with average rates exceeding 0.5 μM d–1. Correction for NH
4+isotopic dilution could increase estimations of regenerated
produc-tion by 40%. Also, a new evaluaproduc-tion of the ƒ ratio (including nitrificaproduc-tion and ammonium isotopic dilution) showed a 10% overestimation of classic estimations of export production. Additionally, active NH4+uptake by < 0.7 μm particles (mainly bacteria) was observed during late spring,
suggest-ing that a significant fraction of small particles was not retained by GF/F filters dursuggest-ing the sprsuggest-ing bloom, which could lead to underestimations of NH4+uptake.
KEY WORDS: Nitrification · Ammonium regeneration · NE Atlantic
Resale or republication not permitted without written consent of the publisher
O
PEN
PEN
A
CCESS
CCESS
Karl 1996, Raimbault et al. 1999, Diaz & Raimbault 2000), but this has not been precisely quantified. Stud-ies on N regeneration and release of dissolved organic nitrogen (DON) inspired several revisions of the con-cepts of new and regenerated production (e.g. Bronk et al. 1994). However, failure in estimating dissolved inorganic nitrogen (DIN) taken up by phytoplankton and released as DON represents another and yet unre-solved source of error in DIN gross uptake rates (Bronk et al. 1994, Slawyk & Raimbault 1995). Also, ammo-nium isotope dilution (recycling of unlabeled sub-strate during 15N incubation experiments) can result in
underestimations of uptake rates (Glibert et al. 1982, Harrison et al. 1983). Nevertheless, the impact of these processes in new production models suffers from a general lack of data, probably related to schedule constraints and the labour intensive nature of the methods involved.
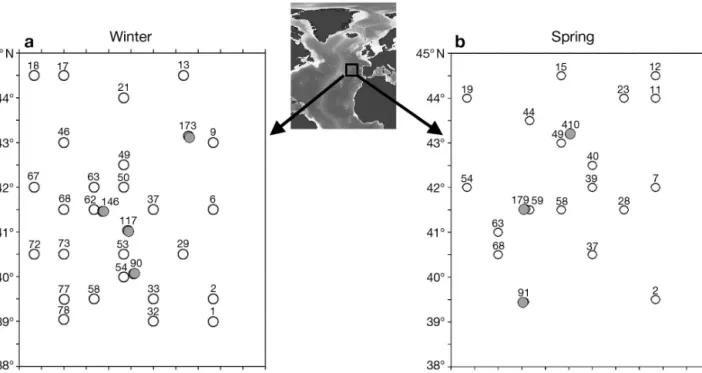
The French Programme Océan Multidisciplinaire Méso Echelle (POMME; Mémery et al. 2005) was con-ceived as a contribution to the understanding of the effect of mode water subduction on the production and fate of organic matter. The sampling strategy was designed to obtain high frequency coverage in core parameters in a vast domain set at 38 to 45° N, 16 to 22° W (Fig. 1). Two consecutive cruises (winter and spring) in 2001 provided a unique chance to measure nitrogen cycling with high spatial resolution and to provide an accurate estimation of the proportion of nitrate resulting from nitrification that is assimilated within the euphotic zone in the eastern North Atlantic.
MATERIALS AND METHODS
Sampling and study area. Two consecutive cruises were carried out during winter and spring 2001 (RV ‘L’Atalante’): POMME 1 (3 February to 20 March; Fig. 1) and POMME 2 (24 March to 16 May; Fig. 1). Core and biological parameters were acquired along 7 north–south transects (30 nautical mile path; see Mémery et al. 2005). The first leg of POMME 1 (P1L1) aimed to describe pre-bloom conditions and maximum mixed layer depth. From a total of 79 stations, 26 ‘pro-duction’ stations were visited during the night (Fig. 1). At each production station, samples from 8 depths (5, 20, 30, 40, 50, 60, 80 and 100 m) were collected using a rosette equipped with 21 Niskin bottles (11 l). Incuba-tions lasted for 12 h (dawn to dusk) using deck incuba-tors (light levels ranging from 50 to 1% of light). The first leg of POMME 2 (P2L1) followed an identical sam-pling strategy. From a total of 81 hydrological stations, 18 ‘production’ stations were completed (Fig. 1).
During the second leg of both cruises (P1L2 and P2L2), several fixed stations were occupied for 72 h during which time 15N uptake and regeneration
exper-iments were performed (Fig. 1). The choice of stations was determined by the hydrological features encoun-tered (see Mémery et al. 2005). Incubations (using an in situ mooring line) lasted for 24 h. Comparisons between ‘on deck’ and in situ incubation methods showed good linearity (Fernández I. et al. 2005a).
Mixed and euphotic layer depths. The euphotic layer depth (Zeu) was calculated using the model
devel-Fig. 1. Study area and sampling stations where 15N enrichment experiments were performed. (a) Winter. Open circles: P1L1;
oped by Morel & Maritorena (2001), according to which total chl a (Tchl a) content in the water column is obtained by integrating chl a over depth. The mixed layer depth (Zm) is defined here as the depth level at
which a change in potential density (σ higher than 0.001 kg m– 3is observed in 2 consecutive
determina-tions spaced by 5 m within a CTD cast (Fernández I. et al. 2005a,b).
Nutrients.Nutrient samples (NO3–, NO2–, PO4–) were
collected at every station and at each depth level in 20 ml polyethylene flasks. Samples for NH4+
determina-tion were collected between the surface and 200 m (250 ml Nalgene flasks) at approximately 50% of the stations. All samples were immediately analyzed (Tréguer & Lecorre 1975) using a Technicon Auto-analyser. Detection limits (and analytical precision) were 0.05 (± 0.04), 0.01 (± 0.025), 0.015 (± 0.01) and 0.01 (± 0.01) μM for NO3–, NO2–, PO4–and NH4+respectively.
Nitrogen-15 assimilation experiments. Rates of ni-trate (ρNO3) and ammonium uptake (ρNH4) were
mea-sured using 15N stable isotopes. Samples (600 ml) were
collected before sunrise in acid-cleaned polycarbonate flasks. Ambient nitrate, nitrite and ammonium con-centrations were immediately measured. Nitrogen-15 tracer additions as K15NO3(99% at 0.5 μmol ml–1) were
always close to 10% of ambient concentrations. Nitro-gen 15 tracer additions as 15NH
4Cl (99% at 0.5 μmol
ml–1) were more variable due to low initial NH 4+
con-centrations (< 50 nM). In such cases, minimal additions of 15N (87 nmol l–1 of 15NH
4) resulted in substrate
enrichments that exceeded 50%, leading to potential productivity measures rather than real uptake (Allen et al. 1996, Raimbault et al. 1999, Fernández I. et al. 2005a). NO3– and NH4+ concentrations were usually
verified after tracer addition (t0 values). Incubations
were terminated by filtration onto 25 mm pre-com-busted GF/F filters (<100 mm Hg). Final concentra-tions of nitrate and ammonium were measured directly from the PC flask. Subsequent to filtration, filters were dried at 60°C and stored at 40°C. Mass spectrometry analysis (Europa scientific tracer mass) determined the final 15N enrichment in the particulate organic
nitro-gen (PON) pool. The transport rate of 15N-labelled DIN
from the DIN pool to the PON pool, i.e. the net DIN uptake (ρDIN, μM d–1) was computed according to Dugdale & Wilkerson (1986)
(1) where RPONand RDINrepresent the 15N atom percent
excess enrichment in the PON and DIN pools, and [PON] represents the final PON concentration; t (in all equations) represents the duration (h) of the incubation. After filtration, 300 ml filtrates were recovered in Duran Schott flasks. For samples obtained during the
second leg of POMME 2, subsamples (100 ml) were re-filtered through teflon 0.2 μm membranes (GELMAN and Anodisc Whatman). Filtrates were poisoned with 1 ml (300 μl for 100 ml subsamples) of HgCl2(6 g l–1) in
order to prevent bacterial activity during conservation. This procedure does not affect the extraction efficiency and prevents losses of NH4+ by freezing the sample
(Slawyk & Raimbault 1995). Filtrates of 15NH
4+
incuba-tions were used to measure the final 15N enrichment in
the DIN pool, as outlined by Slawyk & Raimbault (1995). In this procedure, all forms of DIN are removed from the sample as (NH4)2SO4, by successive diffusion
and reduction processes. The first diffusion step allows quantification of the final 15N enrichment of the DIN
pool (DIN15N), and estimation of the isotope dilution of
the tracer due to NH4+regeneration (see Eq. 2). During
the second diffusion, oxidation of ammonium to nitrate (nitrification) is estimated through the 15N enrichment
of the nitrate pool in the ammonium filtrates (Raim-bault et al. 1999, Fernandez I. et al. 2005a). During the third diffusion, the fraction of 15DIN absorbed by
microorganisms and released as DON during the incu-bation was estimated (ρloss
DIN, Slawyk et al. 1998).
Ammo-nium regeneration rates (rNH4, μM d–1) were
esti-mated according to Laws (1984):
(2) where [NH4]0 and [NH4]Frepresent the initial and final
concentrations of ammonium during the incubation ex-periment, and R0(NH4)and RF(NH4)are the initial and final
excess enrichments in 15NH
4+for the incubation period.
Nitrification rates (rNO3, μM d–1) were computed
according to Raimbault et al. (1999)
(3) where RNO3is the 15N atom percent excess enrichment
in the (NO3–+ NO2–) pool,RNH4is the mean 15N atom
percent excess enrichment of the NH4+pool, and [NO3]
is the final NO3–concentration in the filtrate.
The DIN loss rate (ρloss
DIN) as DON was calculated as
outlined by Slawyk et al. (1998)
(4) where RDONand RDINare the 15N atom percent excess
enrichment of the extracellular DON and DIN pool, respectively, and [DON] is the final extracellular DON concentration.
Urea concentrations in sea water were not measured, and therefore no urea uptake experiment was performed. Corrections to N fluxes.Underestimations of ammo-nium uptake rates (due to isotopic dilution) were corrected by replacing RDINin Eq. (1) with the mean of
DIN loss DON DIN DON
ρ
= × × [ ] R R t rNO3 NO NO3 NH4 3 = × × [ ] R R t rNH4 NH NH 4 4 F NH F NH ln ( ) ( ) = [ ] +[0 ] × ⎛ 0 4 4 2t R R ⎝⎝⎜ ⎞⎠⎟ρDIN PON PON DIN
=
× × [ ] R
initial and final RNH4. However, for nitrate uptake
rates, high ambient concentrations prevented the detection of a significant signal of isotopic dilution and no correction could be made.
Nitrification can induce overestimations of new pro-duction by adding some NO3–to the nitrate pool that
derives from what is actually regenerated production (Dugdale & Goering 1967, Priscu & Downes 1985, Ward et al. 1989, Dore & Karl 1996). Consequently, a correction for nitrate-based new production using direct nitrate regeneration measurements was applied (Eq. 5), as previously described by Fernández I. et al. (2005a). The fraction of nitrate that was produced by nitrification was subtracted from total nitrate uptake in order to assess the uptake of ‘new’ nitrate, as classi-cally defined by Dugdale & Goering (1967)
(5) It is worth summarising the concepts used in this study. We define nitrification (rNO3) as the oxidation of
NH4+ to NO3–. Total nitrate assimilation (ρNO3) is
as-sumed to include all sources of nitrate, regenerated as well as new. Corrected nitrate uptake (ρnewNO3) is the
uptake of ‘truly new’ nitrate, which is obtained by sepa-rating the terms ρNO3and rNO3(Eq. 5). It represents
new production as defined by Dugdale & Goering (1967). Ammonium regeneration (rNH4) is used to
cor-rect underestimations of ammonium uptake (ρNH4) and
to obtain ‘true’ ammonium uptake (ρregNH4), which
cor-responds to regenerated production as defined by Dug-dale & Goering (1967). The definition of the ƒ ratio given by Eppley & Peterson (1979) does not take into account the effect of N regeneration in the term (ρNO3
+ ρNH4), which represents total nitrogen uptake (Eq. 6).
In this study, ƒ ratio estimations include corrections to nitrate and ammonium uptake rates (Eq. 7).
(6)
(7)
RESULTS
Hydrological background of the study area A full description of the hydrological conditions en-countered during POMME can be found in Mémery et al. (2005) and Fernández I. et al. (2005b). The general sea surface temperature (SST) distribution showed val-ues ranging between 13.8°C in winter (P1L1) and 14.6°C in spring (P2L1). Zmduring winter ranged
be-tween 143.6 ± 57 m in the north and 124.1 ± 45 m in the south. During spring, a general decrease in Zmwas
ob-served; however, average values reached 96.3 ± 40 m in the southern area. During winter (P1L1), Zeuvaried
be-tween 70.1 ± 9.4 m in the north and 66.9 ± 3.7 m in the south. During spring (P2L1), values of Zeudecreased to
55.8 ± 2.5 m in the north and 49.4 ± 3.6 m in the south.
Biogeochemical background
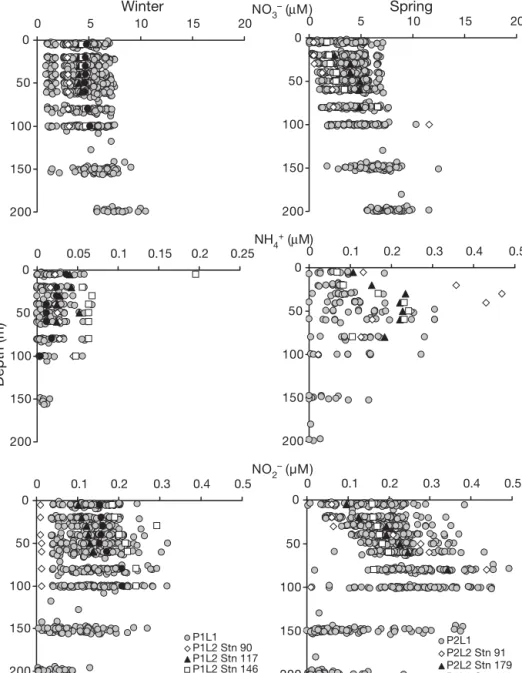
Average nitrate concentrations during winter (P1L1 and P1L2, Fig. 2) ranged between 4.3 ± 1.65 μM (5 m depth) and 7.6 ± 1.52 μM (200 m). During spring (P2L1, Fig. 2) surface values were 1 μM below winter concentrations (3.3 ± 1.83 μM). In deeper layers, no significant evolution was observed compared with winter (7.6 ± 1.65 μM at 200 m). During P2L2, nitrate concentrations decreased, reaching surface values of 0.4 μM (Stn 91) and maximum values of 12 μM at 100 m. Ambient NH4+ was always detectable. Values
obtained during winter (P1L1, Fig. 2) revealed aver-age NH4+ concentrations of 0.017 μM in the top 60 m,
with a subsurface maximum of 0.023 ± 0.013 μM at 30 m. In deeper layers, NH4+ concentrations rapidly
decreased to values below 0.015 μM. During P1L2 (Fig. 2), concentrations reached 0.2 μM in surface waters (Stn 146). During early spring (P2L1, Fig. 2), average surface values reached 0.065 ± 0.044 μM and a subsurface accumulation of NH4+ was observed at
50 m (0.15 ± 0.076 μM). In deeper layers, ammo-nium concentrations decreased to 0.023 ± 0.027 μM (200 m). Maximum concentrations were observed at Stn 91 (P2L2, Fig. 2), where surface values reached 0.13 μM and a subsurface peak of 0.47 μM was mea-sured at 30 m. Average nitrite concentrations during winter (P1L1) ranged between 0.13 ± 0.04 μM and 0.14 ± 0.03 μM in the top 100 m (Fig. 2). During P1L2, nitrite concentrations increased, reaching 0.29 μM at Stn 146 (30 m). During early spring (P2L1, Fig. 2), values reached 0.15 ± 0.07 μM in surface waters and 0.27 ± 0.08 μM within 80 to 100 m. Between 100 and 200 m depth, concentrations decreased to 0.04 ± 0.05 μM. The NO2– subsurface maximum was 50 m
deeper than the ammonium accumulation observed in Fig. 2. During late spring (P2L2), maximum nitrite values reached 0.43 μM (100 m), while surface values (0.06 μM at Stn 91) were in the range of average spring concentrations (P2L1).
Nitrate uptake and nitrification rates Nitrate uptake rates (ρNO3)
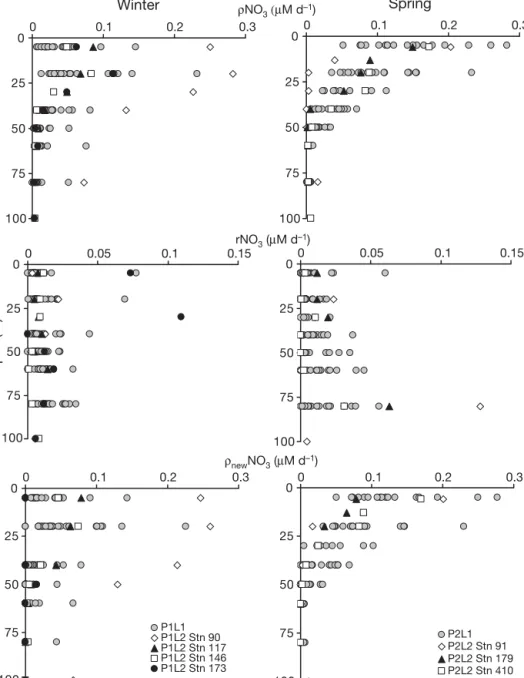
Average nitrate uptake rates obtained during winter (P1L1) were close to 0.04 ± 0.03 μM d–1 in surface
ƒ = − + ρ ρ ρ NO rNO NO NH 3 3 3 reg 4 ƒ = + ρ ρ ρ NO NO NH 3 3 4
waters (max. 0.14 μM d–1), and increased at 20 m depth
(max. 0.23 μM d–1, Fig. 3). In deeper layers, ρNO 3
reached 0.007 ± 0.01 μM d–1. During P1L2, rates of
ρNO3 ranged between 0.05 and 0.09 μM d–1 and
exceeded 0.1 μM d–1at 20 m depth (Fig. 3). Maximum values were observed at Stn 90 (0.28 μM d–1at 20 m).
During spring (P2L1), ρNO3was higher than in winter
(Fig. 3), and occurred mainly in surface waters. Aver-age values reached 0.15 ± 0.064 μM d–1 at 5 m (max.
0.28 μM d–1) and decreased to 0.018 ± 0.009 μM d–1at
50 m (max. 0.03 μM d–1). Stations of P2L2 followed the
same trend, with maximum values at Stn 91 (0.2 μM d–1
in surface waters).
Nitrification rates and corrected nitrate assimilation Nitrification (rNO3) during our study was as high in
surface layers as in deeper waters, and occurred in well-lit waters as well as at the base of the euphotic zone (Fig. 3). Winter rates (P1L1) reached 0.009 ± 0.015 μM d–1 in surface waters (max. 0.017 μM d–1) and
increased slightly with depth to 0.015 ± 0.008 μM d–1
(Fig. 3). Two exceptionally high rates were obtained in the top 20 m: one at Stn 2 in the southern area (0.077 μM d–1) and the other at Stn 18 in the north
(0.069 μM d–1). Integrated rates for P1L1 reached
0.89 mmol m–2d–1 (Table 1). During P1L2, nitrification
0 50 100 150 200 0 0.1 0.2 0.3 0.4 0.5 P2L1 P2L2 Stn 91 P2L2 Stn 179 P2L2 Stn 410 0 50 100 150 200 0 0.1 0.2 0.3 0.4 0.5 NO2– (µM) P1L1 P1L2 Stn 90 P1L2 Stn 117 P1L2 Stn 146 P1L2 Stn 173 0 50 100 150 200 0 0.05 0.1 0.15 0.2 0.25 NH4+ (μM) Depth (m) 0 50 100 150 200 0 0.1 0.2 0.3 0.4 0.5 0 50 100 150 200 0 5 10 15 20 NO3– (μM) 0 50 100 150 200 0 5 10 15 20 Winter Spring
Fig. 2. Vertical distributions of NO3–(μM, top), NH4+(μM, centre) and NO2–(μM, bottom). ds: first leg data. Half scale was used
rates in the top 30 m ranged from between 0.02 and 0.025 μM d–1at Stns 91, 117 and 146 to maximum val-ues of between 0.073 and 0.109 μM d–1 at Stn 173
(Fig. 3). In deeper layers, rNO3decreased to 0.018 μM
d–1(60 m) and 0.005 μM d–1(100 m). Integrated rNO 3
ranged from 0.3 mmol m–2d–1at Stn 146 to 2.67 mmol
m–2d–1at Stn 173 (Table 1). The spring season (P2L1,
Fig. 3) exhibited surface nitrification rates close to win-ter values (0.009 ± 0.014 μM d–1) with an increase
towards southern stations (max 0.02 to 0.06 μM d–1). In
deeper layers, nitrification rates increased to 0.016 ± 0.016 μM d–1(max. 0.06 μM d–1 at 80 m). Integrated
nitrification was also close to winter values (0.88 mmol m–2d–1, Table 1). During P2L2 (Fig. 3), nitrification in the top 50 m was close to 0.03 μM d–1and increased at
80 m (0.127 μM d–1, Stn 91). Nevertheless, integrated
nitrification rates exhibited high values in surface waters at Stn 179 (ΣrNO3≈ 2.34 mmol m–2d–1, Table 1).
The lowest integrated rate was found at Stn 410 (0.14 mmol m–2d–1, Table 1).
After correcting ρNO3for nitrification, the influence
of nitrification on nitrate uptake seems to be clear. Winter (P1L1) values of ρnewNO3 (Fig. 3) were 30%
lower than ρNO3, reaching 0.031 ± 0.03 μM d–1in
sur-0 25 50 75 100 100 100 0 0.1 0.2 0.3 ρNO3 (μM d–1) 0 25 50 75 100 0 0.1 0.2 0.3 0 25 50 75 0 0.1 0.2 0.3 ρnewNO3 (μM d–1) P1L1 P1L2 Stn 90 P1L2 Stn 117 P1L2 Stn 146 P1L2 Stn 173 0 25 50 75 100 0 0.1 0.2 0.3 P2L1 P2L2 Stn 91 P2L2 Stn 179 P2L2 Stn 410 0 25 50 75 0 0.05 0.1 0.15 rNO3 (μM d–1) Depth (m) 0 25 50 75 100 0 0.05 0.1 0.15 Winter Spring
Fig. 3. Vertical distributions of total nitrate uptake (ρNO3, top), nitrification (rNO3, centre) and corrected new nitrate uptake
face waters (max. 0.014 μM d–1) and 0.054 ± 0.05 μM
d–1 at 20 m. In deeper layers, values decreased to
0.002 ± 0.009 μM d–1. During P1L2, ρ
newNO3 was as
much as 20% lower than ρNO3, except at Stn 173
where ρnewNO3was close to 0, suggesting that nearly
100% of the assimilated nitrate came from nitrification. Gathering all data, the integration of winter profiles (P1L1) revealed a 38% contribution of regenerated ni-trate to total nini-trate uptake. For P1L2 stations, correct-ing nitrate uptake rates for nitrification induced signifi-cant variations in ρnewNO3compared with ρNO3 (5.5 to
93%, Table 1). During spring (Fig. 3), surface values of ρnewNO3reached 0.13 ± 0.062 μM d–1 and nitrate
re-generation accounted for 10% of ρNO3. Below 50 m
depth, ρnewNO3was close to 0, indicating that 100% of
the assimilated nitrate came from nitrification. During P2L2, ρnewNO3showed the same trend, with the
excep-tion of Stn 179 where 50% of surface ρNO3was
sup-ported by regenerated nitrate. Integrated rNO3values
during spring (P2L1) showed a 21% contribution of ni-trification to total nitrate uptake (ρnewNO3≈ 3.5 mmol
m–2d–1); contributions during late spring (P2L2) ranged
from 4% at Stn 410 to 70% at Stn 179 (Table 1).
Ammonium uptake and ammonium regeneration Ammonium uptake (ρNH4)
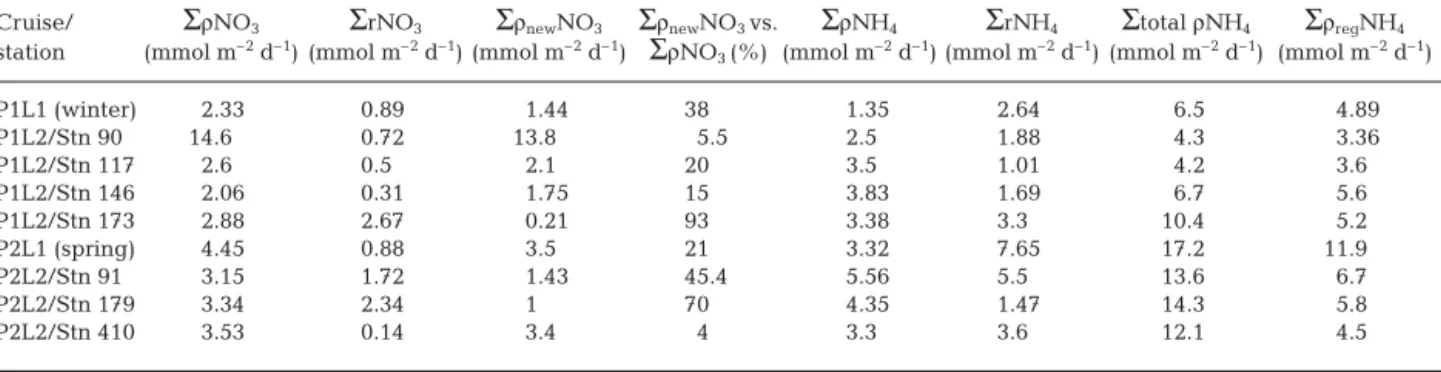
During winter (P1L1), average ρNH4reached 0.02 ±
0.013 μM d–1in surface waters (max. 0.06 μM d–1), and
decreased with depth to 0.007 ± 0.005 μM d–1 (Fig. 4).
During P1L2, ρNH4 increased in surface waters and
ranged between 0.052 μM d–1 (Stn 90) and 0.135 μM
d–1 (Stn 146). During spring, ρNH
4 (P2L1, Fig. 4) was
high compared with winter. Average surface rates reached 0.069 ± 0.024 μM d–1(max. 0.12 μM d–1), while
minimum values (0.012 ± 0.006 μM d–1) were observed
at 80 m. During P2L2, surface ρNH4 values ranged
between 0.084 (Stn 410) and 0.124 μM d–1 (Stn 179).
In deeper layers (30 m), maximum rates reached 0.197 μM d–1(Stn 91).
NH4+regeneration
During measurements of ρ15NH
4, tracer dilution may
occur due to the appearance of 14NH
4+ coming from
regeneration processes mediated by microzooplankton and bacteria. Results revealed the presence of active rNH4during our study, with winter (P1L1) average
val-ues close to 0.17 μM d–1 and maximum values of
0.41 μM d–1at 20 m depth (Stn 2). Integrated rates of
winter rNH4reached 2.64 mmol m–2d–1 (Table 1).
Dur-ing P1L2 (Fig. 4), rNH4 in surface waters varied
between 0.061 (Stn 179) and 0.081 μM d–1 (Stn 146),
and decreased with depth to 0.01 μM d–1(60 to 80 m).
Higher rates were observed at Stn 173 (0.08 and 0.1 μM d–1), for which integrated rNH
4 reached
3.3 mmol m–2 d–1 (Table 1). During spring (P2L1,
Fig. 4), rNH4 was high compared with winter, reaching
0.15 μM d–1 in surface waters (average value 0.072 ±
0.1 μM d–1). Maximum rates were obtained at Stn 2
(0.423 μM d–1) and decreased to 0.3 μM d–1below 20 m
depth. The integrated rate for spring (P2L1) reached 7.65 mmol m–2 d–1. During P2L2, rNH4 was lower
(Fig. 4); however, it showed a subsurface maximum of 0.2 μM d–1(20 to 30 m) at Stns 91 and 410. Integrated
rates ranged between 1.47 and 5.5 mmol m–2 d–1
(Table 1).
Corrected ammonium uptake (ρregNH4)
The most significant difference between corrected ammonium uptake rates (ρregNH4) and ρNH4occurred
Cruise/
Σ
ρNO3Σ
rNO3Σ
ρnewNO3Σ
ρnewNO3 vs.Σ
ρNH4Σ
rNH4Σ
total ρNH4Σ
ρregNH4station (mmol m–2d–1) (mmol m–2d–1) (mmol m–2d–1)
Σ
ρNO3 (%) (mmol m–2d–1) (mmol m–2d–1) (mmol m–2d–1) (mmol m–2d–1)
P1L1 (winter) 2.33 0.89 1.44 38 1.35 2.64 6.5 4.89 P1L2/Stn 90 14.6 0.72 13.8 5.5 2.5 1.88 4.3 3.36 P1L2/Stn 117 2.6 0.5 2.1 20 3.5 1.01 4.2 3.6 P1L2/Stn 146 2.06 0.31 1.75 15 3.83 1.69 6.7 5.6 P1L2/Stn 173 2.88 2.67 0.21 93 3.38 3.3 10.4 5.2 P2L1 (spring) 4.45 0.88 3.5 21 3.32 7.65 17.2 11.9 P2L2/Stn 91 3.15 1.72 1.43 45.4 5.56 5.5 13.6 6.7 P2L2/Stn 179 3.34 2.34 1 70 4.35 1.47 14.3 5.8 P2L2/Stn 410 3.53 0.14 3.4 4 3.3 3.6 12.1 4.5
Table 1. Integrated rates (at 80 m) of nitrate uptake (
Σ
ρNO3), nitrification (Σ
rNO3), ‘new’ nitrate uptake (Σ
ρnewNO3), ammoniumuptake (
Σ
ρNH4), ammonium regeneration (Σ
rNH4), and corrected ammonium uptake (Σ
ρregNH4). Integrated values wereobtained from average profiles for the first leg of POMME 1 and POMME 2, and from discrete profiles for stations of the second leg (P1L2 and P2L2). Total ρNH4represents an estimation of ammonium assimilation by autotrophic and heterotrophic processes,
in the top 50 m of the water column (Fig. 4). During win-ter (P1L1), corrected ammonium uptake (ρregNH4) was
27% higher than originally estimated (ρNH4, Fig. 4).
Average values of ρregNH4reached 0.03 ± 0.019 μM d–1
in surface layers (max. 0.069 μM d–1 at Stn 37) and
0.038 ± 0.02 μM d–1at 20 m depth (max. 0.08 μM d–1at
Stn 2). Integrated ρregNH4reached 4.89 mmol m–2 d–1
(Table 1). Importantly, ΣρregNH4values from stations of
the second leg ranged from 3 to 6 mmol m–2d–1, largely
exceeding uncorrected ρNH4 values from the same
period (Table 1). During spring (P2L1, Fig. 4), ρregNH4
was 30% higher than ρNH4 in surface waters
(maxi-mum ρregNH4≈ 0.175 μM d–1). At 20 m, values reached
0.19 μM d–1and remained high between 30 and 50 m
depth. Integrated rates of ρregNH4were higher than in
winter and also exceeded ρNH4values (11.9 mmol m–2
d–1for P2L1 and 4 to 7 mmol m–2d–1for P2L2, Table 1).
Observations of high ammonium uptake in the <GF/F fraction
The term ‘total ρNH4’ represents an estimation of
ammonium assimilation by autotrophic and heterotro-phic processes, and includes DON excretion (Table 1). In most cases, this value was very close to ρregNH4
0 25 50 75 100 0 0.1 0.2 0.3 ρNH4 (μM d–1) 0 25 50 75 100 0 0.1 0.2 0.3 0 25 50 75 100 0 0.1 0.2 0.3 ρregNH4 (μM d–1) 0 25 50 75 100 0 0.1 0.2 0.3 0 25 50 75 100 0 0.2 0.4 0.6 0.8 1 1 rNH4 (μM d–1) Depth (m) 0 25 50 75 100 0 0.2 0.4 0.6 0.8 Winter Spring P2L1 P2L2 Stn 91 P2L2 Stn 179 P2L2 Stn 410 P1L1 P1L2 Stn 90 P1L2 Stn 117 P1L2 Stn 146 P1L2 Stn 173
Fig. 4. Vertical distributions of ammonium uptake (ρNH4, top), ammonium regeneration (rNH4, centre) and corrected ammonium
(Table 1). However, during late spring (P2L2), differ-ences exceeded 50% (Table 2). In such cases an excess of tracer loss was observed during 15NH
4+incubations,
which was linked to small size particles (< 0.7 μm) enriched in 15N. Such particles can be included in the DON + PON<GF/Ffraction, defined as DON’ by Slawyk
& Raimbault (1995). For those authors, the fluxes asso-ciated with this pool represented a loss of tracer from the DIN compartment to the bacterial compartment, in the form of organic nitrogen. Fig. 5 synthesizes com-parisons made between ρloss
DIN(referred to as DON loss)
and ρregNH4 during P1L2 and P2L2 for stations with
similar hydrological characteristics (see also Mémery
et al. 2005). Rates of ρloss
DINduring P1L2 did not exceed
10% of NH4 assimilation. However, rates for P2L2
(0.096 μM d–1) were 8 times higher (Fig. 5). Moreover,
ρloss
DIN obtained during P2L2 exceeded former
estima-tions found in the literature by at least 50% (Table 2). In such cases, comparisons were made between ρloss DIN
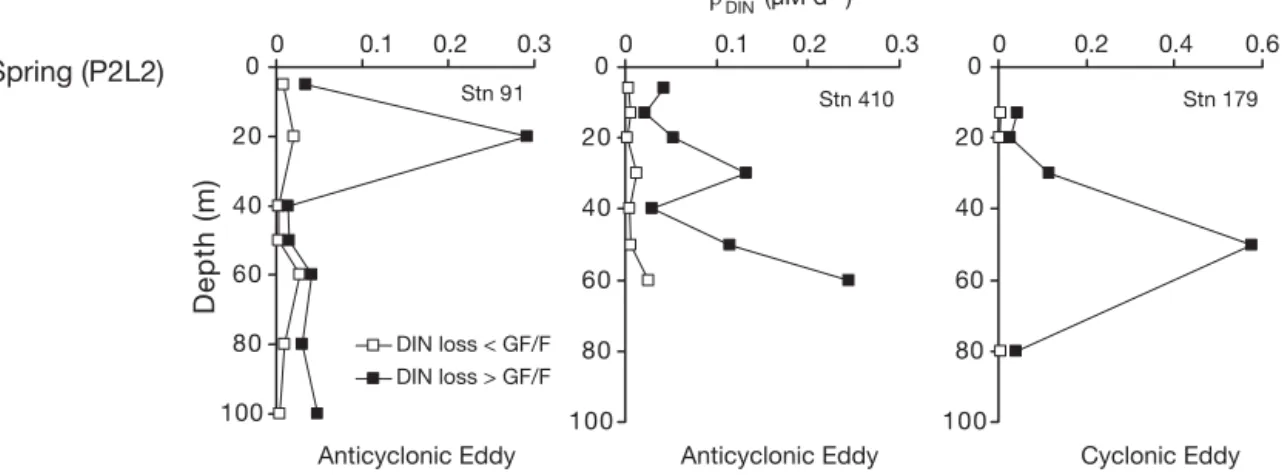
values obtained from the < 0.7 and < 0.2 μm size frac-tions after single (GF/F) and double filtration (GF/F and 0.2 μm filters; see ‘Materials and methods’). Organic nitrogen that passed through GF/F filters and was retained by the 0.2 μm membrane could reach 80% (Fig. 6). This organic nitrogen can be linked to particles that actively assimilated 15NH
4+or to the
re-Location ρloss
DIN Total ρNH4:ρregNH4(μM d–1) Study
NE Atlantic 0.012 ± 0.015 0.6 ± 0.2 POMME 1 Leg 2 (P1L2) NE Atlantic 0.096 ± 0.136 0.4 ± 0.3 POMME 2 Leg 2 (P2L2) Equatorial Pacific 0–0.004 0.85 Slawyk et al. (1998) Mediterranean Sea (Gulf of Lions) 0–0.035 0.76 Diaz & Raimbault (2000) Table 2. Data of ρloss
DIN(μM d–1) obtained from literature and field experiments (this study). ‘Total ρNH4:ρregNH4’ represents the ratio
between ammonium assimilation (corrected for ammonium regeneration) and total NH4uptake (taking DON excretion into
account) Stn 410 0 20 40 60 80 100 120 Stn 179 0 20 40 60 80 100 120 0 0.2 0.4 0.6 Stn 90 0 20 40 60 80 100 120 0 0.1 0.2 0.3 0 0.1 0.2 0.3 0 0.1 0.2 0.3 0 0.1 0.2 0.3 0 0.1 0.2 0.3 NH4 uptake DON loss Stn 173 0 20 40 60 80 100 120 Stn 146 0 20 40 60 80 100 120 Stn 91 0 20 40 60 80 100 120 Depth (m) Winter (P1L2) Spring (P2L2)
Anticyclonic Eddy Anticyclonic Eddy Cyclonic Eddy
Uptake/Loss (µM d–1)
Fig. 5. Corrected ammonium uptake (ρregNH4; noted as NH4uptake, h) and ρlossDIN(noted as DON loss,j) for stations sampled
lease of DO15N during the incubation process. Stn 91
gave the highest values of ρloss
DINin the 0.2 μm fraction
(0.078 μM d–1at 30 m), which accounted for 25% of the
maximum value obtained after GF/F filtration (Fig. 6) and represented 25% of total ammonium uptake. Sub-surface peaks were also observed in deeper layers (Stns 91 and 410). Therefore, the use of GF/F filters failed to retain a significant fraction of small particles (labelled with 15NH
4+) during the spring bloom. The
vertical distribution of tracer losses as ‘DON + particles <GF/F’ indicates a significant contribution of bacteria from the < 0.7 μm size fraction, as previously suggested by Altabet (1990). Results from < 0.2 μm filtrates showed that less than 10% of 15N was lost as during
P2L2 (as previously stated by Slawyk et al. 2000) and that tracer accumulated in the <GF/F fraction due to
15N assimilation by small particles. Ammonium uptake
rates during late spring 2001 could therefore be under-estimated.
Regeneration of N and ƒ ratio calculations Fluxes of nitrification and ammonium regeneration caused a decrease in estimations of ‘new nitrate’ assimilation (new production) and an increase in ammonium uptake (regenerated production). An im-mediate step is to evaluate the effect of rNO3and rNH4
on the ƒ ratio (Fig. 7). Comparison between classical (ƒ) and corrected values (ƒ’) showed a linear relationship (ƒ’ = 0.9193ƒ – 0.0865, R2 = 0.5738), with values of ƒ
roughly 10% higher than ƒ’ (however, discrepancies can exceed 40%). There are several points for which ƒ’ values dropped to 0 (33% of all observations), which corresponded to stations with high nitrification rates. In those cases, rNO3 could support 100% of nitrate
uptake, and new production (in the sense of Dugdale & Goering 1967) dropped to 0, as did ƒ’.
DISCUSSION General observations
This study represents a rigorous approach that sys-tematically takes into account nitrification and ammo-nium regeneration in calculations of DIN uptake rates (NO3–and NH4+). Additionally, it provides an objective
methodological approach to the difficulty of estimating DON excretion by conventional 15N techniques. The
re-evaluation of new and regenerated nitrogen uptake as well as the ƒ ratio indicate that regenerative nitro-gen fluxes are more important in the NE Atlantic Ocean than previously thought, and can support 10 to 100% of nitrate demand and up to 30% of ammonium uptake.
One of the most striking characteristics of the POMME study area was the persistence of favourable regeneration conditions during the year. Hydrological
Stn 91 0 20 40 60 80 100 0 0.1 0.2 0.3 Depth (m) DIN loss < GF/F DIN loss > GF/F Stn 179 0 20 40 60 80 100 0 0.2 0.4 0.6 Stn 410 0 20 40 60 80 100 0 0.1 0.2 0.3
Anticyclonic Eddy Anticyclonic Eddy Cyclonic Eddy
Spring (P2L2)
ρloss (µM d–1) DIN
Fig. 6. Vertical distributions of ρloss
DINduring spring (P2L2, Stns 91, 179 and 410) after successive filtrations onto GF/F filters (j) and
0.2 μm membranes (h). Hydrological characteristics of stations are given; Stn 179 at double scale
R2 = 0.5738 0 0.2 0.4 0.6 0.8 1 0 0.2 0.4 0.6 0.8 1 winter spring ƒ ƒ’ = 0.9193ƒ –0.0865 ƒ’
Fig. 7. Relationship between classical ƒ (see Eppley & Peter-son 1979; our Eq. 6) and corrected ƒ’ (see Eq. 7) ratio values for winter (d) and spring (ds). Values below 0.1 were excluded
conditions included deep mixing (up to 200 m) even in spring, combined with deep light penetration (down to 70 m during winter, Fernández I. et al. 2005b). In such conditions, light limitation of phyto-plankton does not seem to affect new production; fur-thermore, it does not appear to have a clear effect on nitrification. During winter, the persistence of a nitrite maximum at the base of the euphotic zone seems highly modulated by physics, as opposed to spring (up to 0.6 μM) when it became a clear feature in our profiles (Fig. 2). However, the lack of a NO2–
maxi-mum during winter should not be associated with the absence of processes such as ammonium oxidation (NO2–is an intermediate product of nitrification). This
biogeochemical feature, widely distributed in the ocean (Vaccaro & Ryther 1960, Olson 1981, Dore & Karl 1996), has often been considered an indicator of new production through phytoplankton excretion, or bacterial oxidation of organic matter, as well as a sig-nature of the depth at which light-limitation occurs (Dore & Karl 1996, Ward et al. 1989). Although our values are lower than previously described for strati-fied and oceanic areas (Hisard & Piton 1969, Hattori & Wada 1971), they are higher than previous reports for the Atlantic (Zafiriou et al. 1992, Lipschultz et al. 1996). The maintenance of a nitrite maximum during our study confirms the existence of intense regenera-tion activity, even during the most productive season of the year (spring primary production: 1.24 g m–2d–1,
Fernández I. et al. 2005a).
While ammonium concentrations in the upper water column are controlled by numerous fluxes of production and consumption, they can also be consid-ered as an indicator of organic matter mineralization (Bianchi et al. 1997). Ammonium levels during this study were high (up to 0.2 μM during winter and 0.46 μM during spring), but stayed in the range of previous studies in the NE Atlantic (e.g. Woodward & Rees 2001), suggesting intense NH4+ recycling in
the euphotic zone.
Previous studies (Woodward & Rees 2001, Martin & Pondaven 2003) have focussed on the role of mesoscale activity (mainly through ‘eddy pumping’) in the transport of nutrients — both regenerated and new — to the euphotic zone. However, their effect as ‘new production enhancers’ is still under debate. Mesoscale features are well documented for the POMME study area (see Mémery et al. 2005), espe-cially for second legs of all cruises. Nevertheless, in spite of being clearly associated with high nutrient concentrations compared with surrounding waters (Fernández I. et al. 2005b), and although they showed high N-regeneration rates, their role in enhancing C or N cycling is not clear. Further studies are required to clarify this aspect.
Nitrification and new primary production Although the potential significance of ‘regenerated’ nitrate in the euphotic zone has been acknowledged for some time (Dugdale & Goering 1967, Ward et al. 1989, Dore & Karl 1996, Bianchi et al. 1997, Diaz & Raimbault 2000, Ward 2000), there is still little informa-tion regarding the inhibitory effect of light on nitrifica-tion in marine environments (Ward 1985, Horrigan & Springer 1990), and even less concerning its quantifi-cation on an annual or seasonal basis. While nitrifica-tion studies have been performed in a variety of marine environments (Ward et al. 1984, Codispoti & Christensen 1985, Ward & Zafiriou 1988), observations in the open ocean are rare. Whether because of the difficulty of measuring in situ rates or its presumed small contribution to total NO3–assimilation,
nitrifica-tion measurements in the field are far from being routinely measured in oceanographic cruises.
Nitrification rates presented here are in the range of previous observations (e.g. Ward & Zafiriou 1988, Bianchi et al. 1994, Ward 2005), but proved to be signif-icant even during the spring bloom, which was followed by local phytoplankton blooms until May 2001 (Leblanc et al. 2005). Nitrification was intense in the entire water column and was largely able to sustain plankton DIN de-mand. Furthermore, total ambient ammonium recycling within 24 h was possible during both seasons. Nitrifica-tion in surface waters was as high as in deeper layers, suggesting limitation of photoautotrophic predominance in surface waters by competition between phytoplankton and bacteria (often induced by pelagic nitrification). The presence of a subsurface nitrification maximum at the base of the euphotic zone during spring can be related (among other factors) to increased stratification, active remineralization of sinking organic matter and grazing. Seasonally, about 40% of nitrate uptake in the top 80 m was supported by nitrification during winter, and 20% during spring. Locally, nitrification could support 4 to 100% of local surface nitrate assimilation (e.g. Stn 173). Previous studies (Priscu & Downes 1985, Ward 1987, Ward et al. 1989, Dore & Karl 1996, Raim-bault et al. 1999) came to similar conclusions. In the equatorial Pacific, 20 to 100% of total nitrate demand could be fulfilled by nitrification in the euphotic zone, and even 142% at the Hawaii Ocean Time-Series station ALOHA (Dore & Karl 1996). Our results confirm these observations and suggest a widely significant role of ni-trification in the upper layers of oceanic areas. A logical conclusion is the possibility of considerable overestima-tions in current new production estimates that do not take N regeneration into account. For the NE Atlantic, such overestimations of new production (in the sense of Dugdale & Goering 1967) could reach 10% on an annual basis and up to 100% at daily rates.
Interestingly, recent experiments observed active NO3–uptake by heterotrophic bacteria, reaching 16 to
40% of NO3–assimilation (Allen et al. 2002).
Implica-tions for areas of intense NO3– cycling could include
further overestimations of autotrophic uptake and new primary production, because bacteria can become not only producers but consumers of regenerated (and new) nitrate.
NH4+cycling: contribution of small cells
There are seldom measurements of ammonium regeneration in oceanic waters in the literature, but our results are in the range of the scarce available data (e.g. Bode et al. 2002). Rates of rNH4were high in
sur-face waters during winter (0.172 μM d–1) and spring
(0.423 μM d–1).
Being a preferred source of nitrogen for marine phytoplankton and bacteria, ammonium is also a sub-strate of competition for autotrophic and heterotrophic organisms of small size. The effect of rNH4on
ammo-nium uptake rates (and subsequently for regenerated production) was high during winter and spring (~40%) and was particularly important in the top 50 m of the water column. Similar results were described for the open Atlantic Ocean, where 12 to 40% of total NH4+
uptake was related to bacteria (Allen et al. 2002). Other N forms such as urea are actively assimilated and can have a significant effect on regenerated pro-duction (Allen et al. 2002). Although urea was reported as a source of N for phytoplankton and only few reports of heterotrophic uptake of urea exist (Kirch-man 2000), a more accurate quantification of N cycling should include these fluxes, despite the difficulties of the methods involved.
It is worth making a brief comment concerning NH4+
cycling during P2L2. Early in spring (P2L1), rNH4and
ρloss
DINseemed to be directly related (rNH4= 0.8295 DON
loss + 31.85, R2= 0.65; data not shown), which suggests
active grazing pressure for both processes because DON is a suitable substrate for bacteria and can also be excreted by zooplankton and unicellular plankton. However, the high rates of ρloss
DINobtained later in the
season (P2L2) were probably due to high NH4+uptake
in the < 0.7 μm size fraction and possibly to heterotro-phic assimilation of recently released DON labelled as
15N. Filtration through 0.2 μm ensured real ρloss DIN
esti-mations, revealing a much lower proportion of DIN go-ing to the dissolved organic compartment (<14%). NH4+ uptake in the < 0.7 μm fraction (which includes
bacteria, Bronk & Glibert 1994, Synechoccocus sp. and prochlorophytes, Altabet 1990) contributed to 30% of ammonium uptake. The origin of this problem lies in a methodological constraint. The efficiency of glass fiber
filters (mainly Whatman GF/F) has been repeatedly verified in marine environments (e.g. Altabet 1990, Raimbault et al. 1999, Diaz & Raimbault 2000, Sal-danha-Corrêa et al. 2004). Comparisons of different types of filters, including 0.2 μm Anopore aluminium oxide membranes (Altabet 1990, Slawyk & Raimbault 1995), indicated that a significant fraction of the partic-ulate nitrogen collected by 0.2 μm Anopore mem-branes could pass through GF/F filters, and the rela-tive importance of the fraction that was neglected increased with depth. However, since nitrate and am-monium assimilation occurs mainly in surface waters, it was suggested that integrated uptake rates would not be significantly underestimated in the > 0.7 μm fraction. During late spring, the use of GF/F filters led to underestimations of ammonium uptake and a failure to estimate the released DON. We suggest that, for some particular cases in open ocean environments, the role of particles smaller than 0.7 μm in ammonium as-similation can exceed the performance of larger phytoplanktonic cells. In such conditions, the use of Anopore aluminium oxide 0.2 μm membranes should not be avoided, but the problem persists due to their low filtration speed, high cost and potential incompati-bility with mass spectrometry analysis. In spite of the existence of 2 alternative glass fiber filters (AP-40 Mil-lipore and GF-5 Macherey Nagel) with approximate nominal porosities (0.45 and 0.4 μm respectively), their retention performance is compromised in oligotrophic conditions (Saldanha-Corrêa et al. 2004). New technol-ogy is needed to ensure routine filtration and analysis of the smallest fraction of marine ultraplankton.
In terms of export production, the underestimation of total ammonium uptake rates by filtration through GF/F filters should not have consequences for ƒ (Eppley & Peterson 1979). This is because ammonium uptake in the <GF/F size fraction is performed almost entirely by bacteria and it cannot be included in the estimation of regenerated production, which is asso-ciated with autotrophic fixation of carbon. The ƒ ratio only provides an indirect estimation of particulate organic matter export to the deep ocean if suitable time scales are considered. This concept assumes a balance between the input of nitrate by advection and the losses from the surface to the deep. However, our observations showed rates of regeneration of nitroge-nous nutrients (NH4+regeneration and nitrification) in
the euphotic zone that could supply up to 100% of local nutrient assimilation. This raises the question of the validity of estimating ƒ through 15N tracer methods,
because in situ nitrogen recycling seems to be widely important. In order to improve calculations of the ƒ ratio in nitrogen and carbon budgets at a global and regional scale, nitrogen regeneration fluxes need to be properly and systematically quantified.
Acknowledgements. This study was part of the POMME
pro-ject, which was funded by PATOM/PROOF (France) and headed by L. Mémery and G. Reverdin. We thank N. Garcia, P. Rimmelin and B. Boudjellal for valuable help during sampling and laboratory analysis. The captain and crew of RV ‘L’Atalante’ provided excellent assistance during both cruises. H. Claustre provided euphotic layer depth data. Four anonymous referees are acknowledged for constructive comments that greatly improved the manuscript.
LITERATURE CITED
Allen CB, Kanda J, Laws EA (1996) New production and photosynthetic rates within and outside a cyclonic meso-scale eddy in North Pacific subtropical gyre. Deep-Sea Res II 43:917–936
Allen AE, Howard-Jones MH, Booth MG, Frisher ME, Verity PG, Bronk DA, Sanderson MP (2002) Importance of het-erotrophic bacterial assimilation of ammonium and nitrate in the Barents Sea during summer. J Mar Syst 38:93–108 Altabet M (1990) Organic C, N and stable isotopic composi-tion of particulate matter collected on glass-fiber and aluminium oxide filters. Limnol Oceanogr 35:902–909 Bianchi M, Bonin P, Feliatra F (1994) Bacterial nitrification
and denitrification rates in the Rhône River plume (northwestern Mediterranean Sea). Mar Ecol Prog Ser 103:197–202
Bianchi M, Feliatra F, Tréguer P, Vincendeau M, Morvan J (1997) Nitrification rates, ammonium and nitrate distribu-tion in upper layers of the water column and in sediments of the Indian sector of the Southern Ocean. Deep-Sea Res II 44:1017–1032
Bode A, Castro C, Doval MD, Varela M (2002) New and regenerated production and ammonium regeneration in the western Bransfield region (Antarctica) during phyto-plankton bloom conditions in summer. Deep-Sea Res II 49: 787–804
Bronk DA, Glibert P, Ward BB (1994) Nitrogen uptake, dissolved organic nitrogen release and new production. Science 256:1843–1846
Codispoti LA, Christensen JP (1985) Nitrification, denitrifica-tion and nitrous oxide cycling in the eastern tropical South Pacific Ocean. Mar Chem 16:277–300
Diaz F, Raimbault P (2000) Nitrogen regeneration and dis-solved organic nitrogen release during spring in a NW Mediterranean coastal zone (Gulf of Lions): implications for the estimation of new production. Mar Ecol Prog Ser 197:51–65
Dore JE, Karl DM (1996) Nitrification in the euphotic zone as a source for nitrite, nitrate, and nitrous oxide at station ALOHA. Limnol Oceanogr 41:1619–1628
Dugdale RC, Goering JJ (1967) Uptake of new and regener-ated forms of nitrogen in primary productivity. Limnol Oceanogr 12:196–206
Dugdale RC, Wilkerson FP (1986) The use of 15N to measure
nitrogen uptake in eutrophic oceans, experimental con-siderations. Limnol Oceanogr 31:673–689
Eppley RW, Peterson BJ (1979) Particulate organic matter flux and planktonic new production in the deep ocean. Nature 282:677–680
Eppley RW, Renger EH (1992) Nitrate utilization by plankton in the equatorial pacific march 1988 along 150° W. J Geo-phys Res 97:663–668
Fernández I. C, Raimbault P, Garcia N, Rimmelin P, Claustre H, Ras J, Caniaux G (2005a) An estimation of annual new production and carbon budgets in the northeast
Atlantic Ocean during 2001. J Geophys Res 110:C07S13, doi:10.1029/2004JC002616
Fernández I. C, Raimbault P, Caniaux G, Garcia N, Rimmelin P (2005b) Impact of mesoscale features on seasonal distri-bution of nitrate in the Northeast Atlantic Ocean. J Mar Syst 55:155–175
Gentilhomme V, Raimbault P (1994) Absorption et régénéra-tion de l’azote dans la zone frontale du courant Algérien (Méditerranée Occidentale): réévaluation de la produc-tion nouvelle. Oceanol Acta 17:555–562
Glibert PM, Lipschultz F, McCarthy JJ, Altabet MA (1982) Isotope dilution models of uptake and remineralization of ammonium by marine plankton. Limnol Oceanogr 27: 639–650
Harrison WG, Douglas D, Falkowski P, Rowe G, Vidal J (1983) Summer nutrient dynamics of the middle Atlantic Bight: nitrogen uptake and regeneration. J Plankton Res 5: 539–556
Hattori A, Wada E (1971) Nitrite distribution and its regulat-ing processes in the equatorial Pacific Ocean. Deep-Sea Res 18:557–568
Hisard PH, Piton B (1969) La distribution du nitrite dans le système des courants équatoriaux de l’Océan Pacifique, à 170° E. J Cons Int Explor Mer 32:303–317
Horrigan S, Springer AL (1990) Oceanic and estuarine ammo-nium oxidation — effects of light. Limnol Oceanogr 35: 479–482
Kirchman DL (2000) Uptake and regeneration of inorganic nutrients by marine heterotrophic bacteria. In: Kirchman DL (ed) Microbial ecology of the oceans. Wiley-Liss, New York, p 261–288
Laws E (1984) Isotope dilution models and the mystery of the vanishing 15N. Limnol Oceanogr 29:379–386
Leblanc K, Leynaert A, Fernández I. C, Rimmelin P, Moutin T, Raimbault P, Ras J, Queguiner B (2005) A seasonal study of diatom dynamics in the North Atlantic during the POMME experiment (2001): evidence of Si limitation of the spring bloom. J Geophys Res 110:C07S14, doi: 10.1029/2004JC002621
Lipschultz F, Zafiriou OC, Ball LA (1996) Seasonal fluctua-tions of nitrite concentrafluctua-tions in the deep oligotrophic ocean. Deep-Sea Res II 43:403–419
Martin A, Pondaven P (2003) On the estimates for vertical nitrate flux due to eddy pumping. J Geophys Res 108: 3359, doi:10.1029/2003JC001841
Mémery L, Reverdin G, Paillet J, Oschlies A (2005) Intro-duction to the POMME special section: thermocline ventilation and biogeochemical tracer distribution in the northeast Atlantic Ocean and impact of mesoscale dy-namics. J Geophys Res 110:C07S01, doi:10.1029/2005JC 002976
Morel A, Maritorena S (2001) Bio-optical properties of oceanic waters: a reappraisal. J Geophys Res 106:7163–7180 Olson RJ (1981) Differential photoinhibition of marine
nitrify-ing bacteria: a possible mechanism for the formation of the primary nitrite maximum. J Mar Res 39:227–238
Priscu JC, Downes MT (1985) Nitrogen uptake, ammonium oxidation and nitrous oxide (N2O) levels in the coastal
waters of western Cook Strait, New Zealand. Estuar Coast Shelf Sci 20:529–542
Raimbault P, Slawyk G, Boudjellal B, Coatanoan C and 5 others (1999) Carbon and nitrogen uptake and export in the equatorial pacific at 150° W: evidence of an effi-cient regenerated production cycle. J Geophys Res 104: 3341–3356
Saldanha-Corrêa F, Gianesella SM, Barrera-Alba JJ (2004) A comparison of the retention capability of three different
glass-fiber filters used for chlorophyll-a determinations.
Bras J Oceanogr 52:243–247
Slawyk G, Raimbault P (1995) Simple procedure for the simul-taneous recovery of dissolved inorganic and organic nitro-gen in 15N-tracer experiments and improving the isotopic
mass balance. Mar Ecol Prog Ser 124:289–299
Slawyk G, Raimbault P, Garcia, N (1998) Measuring gross uptake of 15N labelled nitrogen by marine phytoplankton
without particulate matter collection: evidence of low
15N losses to the dissolved organic nitrogen pool. Limnol
Oceanogr 43:1734–1739
Slawyk G, Raimbault P, Garcia N (2000) Use of 15N to measure
dissolved organic nitrogen release by marine phyto-plankton (reply to comment by Bronk and Ward). Limnol Oceanogr 45:1884–1886
Takahashi T, Sutherland SC, Sweeney C, Poisson A and 8 others (2002) Global sea-air CO2 flux based on
climato-logical surface ocean pCO2, and seasonal biological and
temperature effects. Deep-Sea Res II 49:1601–1622 Tréguer P, LeCorre P (1975) Manuel d’analyses des sels
nutri-tifs dans l’eau de mer: utilisation de l’Autoanalyser II Technicon, 2nd edn. Université de Bretagne Occidentale, Brest
Vaccaro RF, Ryther J (1960) Marine phytoplankton and the distribution of nitrite in the sea. J Const Int Explor Mer 25: 260–271
Ward BB (1985) Light and substrate concentrations relation-ships with marine ammonium assimilation and oxidation rates. Mar Chem 16:301–316
Ward BB (1987) Nitrogen transformations in the Southern California Bight. Deep-Sea Res 34:785–805
Ward BB (2000) Nitrification and the marine nitrogen cycle. In: Kirchman DL (ed) Microbial ecology of the oceans. Wiley-Liss, New York, p 427–454
Ward BB (2005) Temporal variability in nitrification rates and related biogeochemical factors in Monterey Bay, Califor-nia, USA. Mar Ecol Prog Ser 292:97–109
Ward BB, Zafiriou OC (1988) Nitrification and nitric oxide in the oxygen minimum of the eastern tropical North Pacific. Deep-Sea Res 35:1127–1142
Ward BB, Talbot MC, Perry MJ (1984) Contributions of phyto-plankton and nitrifying bacteria to ammonium and nitrite dynamics in coastal waters. Cont Shelf Res 3:383–398 Ward BB, Kilpatrick KA, Renger EH, Eppley RW (1989)
Bio-logical nitrogen cycling in the nitracline. Limnol Oceanogr 34:493–513
Woodward EMS, Rees AP (2001) Nutrient distributions in an anticyclonic eddy in the northeast Atlantic Ocean, with reference to nanomolar ammonium concentrations. Deep-Sea Res II 48:775–794
Zafiriou OC, Ball LA, Hanley Q (1992) Trace nitrite in oxic waters. Deep-Sea Res 39:1329–1348
Editorial responsibility: Otto Kinne (Editor-in-Chief), Oldendorf/Luhe, Germany
Submitted: June 16, 2006; Accepted: September 29, 2006 Proofs received from author(s): April 23, 2007