HAL Id: hal-01819469
https://hal.uca.fr/hal-01819469
Submitted on 18 Mar 2021
HAL is a multi-disciplinary open access
archive for the deposit and dissemination of
sci-entific research documents, whether they are
pub-lished or not. The documents may come from
teaching and research institutions in France or
abroad, or from public or private research centers.
L’archive ouverte pluridisciplinaire HAL, est
destinée au dépôt et à la diffusion de documents
scientifiques de niveau recherche, publiés ou non,
émanant des établissements d’enseignement et de
recherche français ou étrangers, des laboratoires
publics ou privés.
Sulfur scavenging in a mesoscale model with
quasi-spectral microphysics: Two-dimensional results for
continental and maritime clouds
N. Chaumerliac, Eric Richard, J.-P. Pinty, E. Nickerson
To cite this version:
N. Chaumerliac, Eric Richard, J.-P. Pinty, E. Nickerson. Sulfur scavenging in a mesoscale model with
quasi-spectral microphysics: Two-dimensional results for continental and maritime clouds. Journal
of Geophysical Research, American Geophysical Union, 1987, 92 (D3), �10.1029/JD092iD03p03114�.
�hal-01819469�
JOURNAL OF GEOPHYSICAL RESEARCH, VOL. 92, NO. D3, PAGES 3114-3126, MARCH 20, 1987
Sulfur Scavenging in a Mesoscale Model With Quasi-Spectral Microphysics'
Two-Dimensional
Results for Continental
and Maritime
Clouds
N. CHAUMERLIAC, E. RICHARD, AND J.-P. PINTY Laboratoire Associe de Meteorologic Physique, Clermont-Ferrand, France
E. C. NICKERSON
National Oceanic and Atmospheric Administration, Environmental Research Laboratories, Boulder, Colorado A three-dimensional mesoscale numerical model (Nickerson et al., 1986) with quasi-spectral microphy- sics has been extended to include gas and aerosol removal by cloud droplets and raindrops. Combining meteorological predictions and pollutant scavenging parameterizations, two-dimensional sensitivity tests have been carried out for continental and maritime clouds over an idealized topography. Nucleation scavenging is the most efficient in-cloud removal mechanism; however, differences in cloud droplet spectra between continental and maritime clouds lead to differences in their scavenging efficiencies for gases and aerosols, thereby emphasizing the need for the simultaneous treatment of meteorological and physicochemical processes.
1. INTRODUCTION
Wet deposition is the result of complex nonlinear interac- tions between meteorological and physicochemical factors. Identification and knowledge of those interactive processes have been significantly improved in recent years as a result of field investigations, laboratory studies, and theory aided by numerical simulations. Some numerical studies [Hegg et al., 1984b; Trernblay and Leighton, 1984; Kitada et al., 1984] con- centrate on the redistribution of trace gases and aerosols by various precipitating cloud systems. In such models, meteoro- logical fields are usually prespecified under the assumption of steady airflows [Trernblay and Leighton, 1984] or by objective analysis of the wind field [Kitada et al., 1984]. Moreover, cloud microphysics is only grossly parameterized, thus exclud- ing any explicit calculation of the scavenging rates [Hegg et al., 1984b], since nucleation and capture rates are strongly dependent on hydrometeor and aerosol spectra.
The aim of this paper is to exemplify the usefulness of a quasi-spectral parameterization of liquid water and aerosols so as to describe nucleation scavenging and SO 2 dissolution into cloud droplets. A microphysical scheme, with raindrop spectra only, has already been incorporated into a three- dimensional mesoscale model [Nickerson et al., 1986] for simulating precipitation. Here we present an extended mi- crophysical version of this scheme allowing for an improved explicit representation of the condensation/evaporation pro- cesses. Two-dimensional simulations are next performed to evaluate the relative contributions of each scavenging process in typical continental and maritime clouds.
2. MODEL PRESENTATION
2.1. Description of Meteorological Model
The three-dimensional hydrostatic mesoscale model is based upon primitive equation resolution. The horizontal grid length is typically 10 km and the time step is 10 s. There are 15 computational levels in the vertical, equally spaced in a
Copyright 1987 by the American Geophysical Union. Paper number 6D0701.
0148-0227/87/006D-0701 $05.00
terrain-following (nu) coordinate system. A centered leap-frog scheme is used with an Asselin [1972] filter. Lateral boundary conditions are of the Orlanski [1976] type for the normal velocity component. The tangential velocity and all other prognostic variables are computed using advective conditions on outflow boundaries and prescribed values at inflow points. A viscous damping layer at the top of the domain [Klemp and Lilly, 1978] is used to absorb vertically propagating waves. A comprehensive description of the dynamical computations of the model can be found in the work by Nickerson et al. [1986].
The prognostic variables in the warm-rain version of the model are ground pressure l-I, horizontal wind (u, v), vapor mixing ratio qv, and potential temperature O. Here O is pre-
dicted in flux form as
a(no) a a n a
Ot - --c•
(OI-Iu)
-- •yy
(OI-Iv)
-- --
LvFI
• • cond .... ,ion + Fo (1)
+ CI•mP
c•t evaporation
Predictions are made of both rainwater mixing ratio q,w and total number concentration N,w, assuming a lognormal drop distribution. Extensive use of Berry and Reinhardt's !-1973] formulation has been made for parameterization of the auto- conversion, accretion, and self-collection processes. For fur- ther details, the reader is referred to Nickerson et al. i-1986].
Cloud droplets are also assumed to be lognormally distrib- uted. In the diameter range D to D q-dD, the cloud droplet concentration is given by
dNcw
= (2rO•/2acD
exp
-- • In
2a c 2
2 dD (2)
where
N• is the total number
concentration
of droplets;
D•o,
the modal diameter; and a•, the dispersion parameter. Integra- tion of (2) over the entire droplet spectrum yields the following
expression for q•, the cloud water mixing ratio:
Ncw 3pw)
eXp(9•ac
(3)
CHAUMERLIAC ET AL..' SULFUR SCAVENGING IN A MESOSCALE MODEL 3115
I'licrophysical
processes
CLOUD CONDENSATION NUCLEI
nucleation WATER VAPOR
qv CLOUD DROPLETS
New qcw
ondensation evaporation accretion autoconversion RAINDROPS selfcollectionI
Nr"
pe qr'w
sedilentation
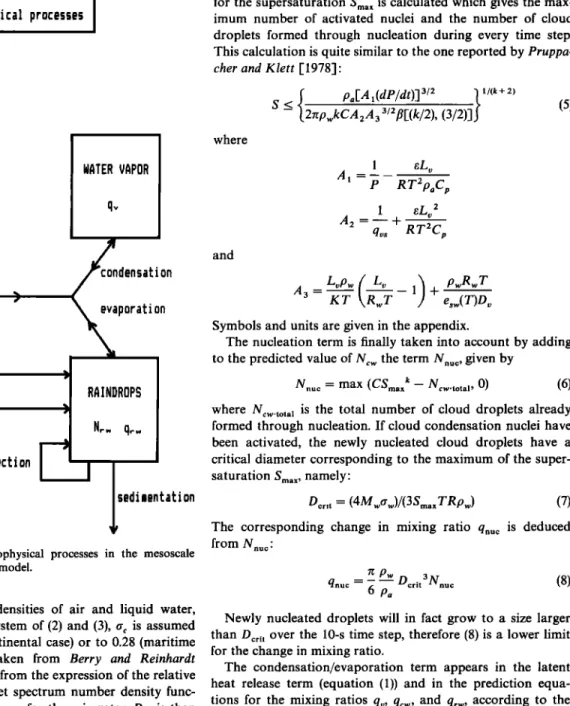
Fig. 1. Synopsis of the microphysical processes in the mesoscale
model.
where Pa and Pw are the densities of air and liquid water,
respectively. To close the system of (2) and (3), a c is assumed
constant, equal to 0.15 (continental case) or to 0.28 (maritime case). Those values are taken from Berry and Reinhardt
1-1973-1, where o- c is deduced from the expression of the relative
variance of the cloud droplet spectrum number density func- tion. Predicting Ncw and qcw, as for the rainwater, Dco is then computed from (3).
The microphysical processes to be considered are sche- matically depicted in Figure 1. The number of condensation nuclei active at supersaturation S, is given by
N = CS k (4)
where C and k are empirical constants. For continental clouds, C is set to 3500 cm-3 and k to 0.9, while for maritime
clouds C- 100 and k- 0.7. These experimental values have
been adopted as being typical of maritime and continental clouds in different parts of the world [Pruppacher and Klett, 1978].
From (4) the number of cloud condensation nuclei activated
per second is derived. It is equal to the time change of the number of cloud droplets formed through heterogeneous nu- cleation. It is not possible to calculate this number directly, since the time constant of the equation for dS/dt can be less than 0.1 s and so is much smaller than the time step of the model, At = 10 s. Following Twomey [1959], an upper bound
for the supersaturation Sma x is calculated which gives the max-
imum number of activated nuclei and the number of cloud
droplets formed through nucleation during every time step. This calculation is quite similar to the one reported by Pruppa- cher and Klett [1978]:
where and
• p,[A
•(dP/dt)]
3/2
S < [2ZtpwkC72j•3,2•/-•,
(3/2)]'
1 eL.A•
- P RT2•OaCv
1
ely 2
A2q,•s RT2Cv
) pwRwT
Lvp
w Lv _ 1 + •
A3
= -•- R
w
T
esw
( r)o,•
(5)Symbols and units are given in the appendix.
The nucleation term is finally taken into account by adding to the predicted value of Ncw the term N .... given by
Nnu
½
= max (CSmax
k-- Ncw.total,
0)
(6)
where Ncw.tota 1 is the total number of cloud droplets already formed through nucleation. If cloud condensation nuclei have been activated, the newly nucleated cloud droplets have a critical diameter corresponding to the maximum of the super- saturation S .... namely:
(7) Derit = (4Mwaw)/(3SmaxTRPw)
The corresponding change in mixing ratio qnuc is deduced
from Nnu c:
r• Pw
qnuc
--
Derit
3Nnuc
(8)
6 p•
Newly nucleated droplets will in fact grow to a size larger than Dcrit over the 10-s time step, therefore (8) is a lower limit for the change in mixing ratio.
The condensation/evaporation term appears in the latent heat release term (equation (1)) and in the prediction equa- tions for the mixing ratios q•, qcw, and qrw, according to the following relationship:
c3
qv
condensation
• qcw
'•-
evaporation--
•3t
• qrw condensation •t evaporation condensation evaporation (9)In order to obtain the rate of change of qcw and qrw, integra- tion is made over the cloud droplet and raindrop spectra.
Calculations are performed first for qcw. The rate of change of
qcw is expressed by
•?
qcw
-Pw
fo•
-Z[
D2
dD
--Ncw (
exp --c•t
Pa
2
dt (2rt)•/2acD
2ac----
1 ;co)
• In
2 dD
(•0) Then, the time rate of change for diameter D of cloud drop- lets due to condensation or evaporation is
dD A3S
3116 CHAUMERLIAC ET AL.' SULFUR SCAVENGING IN A MESOSCALE MODEL
where A 3 is the thermodynamical function in (5). This leads to 2
8 qcw Pw rc cr c
cond .... tion- A3SNcwDco exp
8t evaporation
Pa 2
2
A similar expression is calculated for
8 qrw condensation
8t evaporation
(12)
apart from the fact that a ventilation factor arises for the time rate of change of raindrop diameter'
dD
r A3sf
- (13)
dt D r
After Pruppacher
and Rasmussen
[1979], f is parameterized
by
f= 0.78 + 0.308X (14)
where X = Re•/2Sc •/3.
Then, we have adjusted the variable X as a function of diameter D r by
X = -1.406 x 10⁶D 2 + 1.725 x 10'•D- 0.675 (15) Replacing dDr/dt by its expression as a function of D r and after integration over the raindrop spectrum, the rate of change of qrw is written as
c3 qrw Pw rr
--
A3SNrwI-0.572
Dro
exp (at2/2)
8t condensation
evaporation
Pa 2
+ 5.31
x 10
3 Dro
exp
(2%2)-4.33
x l0 s Dro
3 exp
(•%2)]
(16)
Because of the discrepancy between the model time step and the supersaturation time constant, it is not possible to calcu- late S exactly in (12) and (16). The scheme of Sakakibara [1979] is used here, because it is adapted for stable compu- tation of the condensation process with a large time step of the order of 10 s. The method consists in solving analytically the following equation:
dS
_(C x + C 2+C3)S+C 3 (17)
dt where'
where
S o (= q•,/q•,s-
1) is the supersaturation
at the beginning
of the time step At and C = Cx + C 2 + C 3. This value S is used in (12) and (16). The rate of change of qvis
8 q,, Pwrt
-- - A3SZ (23)
8t condensation
evaporation Pa 2
-- --
With evaporation the smallest drops of the spectrum can disappear entirely. This explains the sink terms in the equa-
tion used
for Ncw and Nrw prediction
in case
of total evapora-
tion. The term
•t
evaporation
is calculated as in the work by Nickerson et al. and the same
expression is used for
• N•w
•t
I
evaporation
Based upon a simplified evaluation of supersaturation, these
parameterizations for the nucleation and the con- densation/evaporation processes allow for explicit calculations of aerosol nucleation rates and dissolution rates of gases in the aqueous phase. This is very important, since these two pro- cesses are admittedly the most efficient among the various pollutant scavenging processes in the troposphere [Garland, 1978]. Another advantage of this quasi-spectral formulation of cloud water is that it allows for a detailed description of three regimes of aerosol capture by raindrops.
2.2. Aerosol and Gas Scavenging
Parameterizations
As for the hydrometeors, aerosol particles are assumed to be lognormally distributed, the dispersion parameter being set to In 2 [Dana and Hales, 1976]. One discriminates between three categories of particles' those free in the air and others attached to cloud droplets or raindrops, respectively. Only
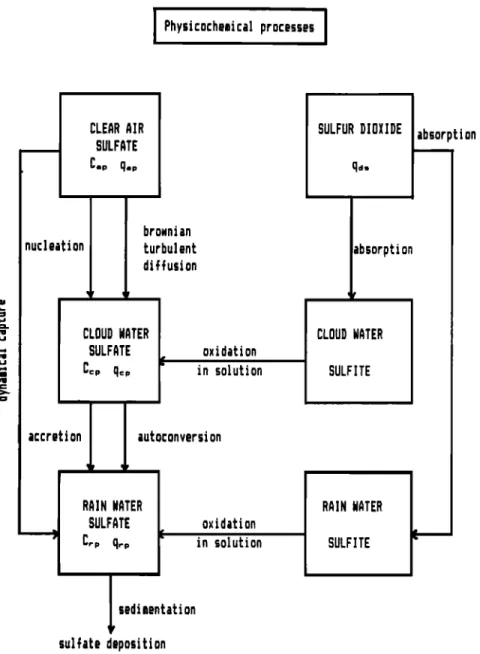
sulfate particles are considered here. An overview of the physi-
cochemical processes is given in Figure 2. Sulfate volume mixing ratio in cloud and rainwater can be increased through conversion of dissolved SO2. Separate prognostic equations are written for each sulfate category for both number con- centration and volume mixing ratio. These are listed below-
and C 1 ... A3Z (18) qos P• 2
sly 2 Pw •
•' •13• (19)C2 RT2Cv
Pa
2
C
3 = __
RT2paCvJ
'•'
(20)8I-ICap
8t__
--
A(Cap
)--
8(
8
8tCap
8 Cap
Brownian -I-
diffusion 8t
8Hqa•,
8t
-- -- A(qap
)-- H
I
Brownian diffusion8HCcp
( 8
Cap
Brownian
A(Ccp
) + II 8t diffusion
dynamical/-•-
capture /F
ca,,
(24)
dynamical/-[-
capture /F
q,,•,
(25)
Z = NcwDco
exp (Crc2/2)
+ Nrw[0.572
Dro
exp (err2/2)
+ 5.31
x 103
Dro
3 exp
(2%2)--4.33
x l0 s Dro
3 exp
(29-ar2)] (21)
An approximate average value S over the time interval At is
then evaluated as
8 Ccp
accretion8 Ccp
8tautoconversiont
-[-
Fccv
8Hqc•,
_
/'8 qap
- -n{qc,,)
+
Brownian diffusion8 qcp
accretion (26)o•=_C3
-•--- S
( ?)( exp_
O
+
1-- CAt J
(CAt),h
(22)
8 qcp
autoconversion3 8 qas
CHAUMERLIAC ET AL.' SULFUR SCAVENGING IN A MESOSCALE MODEL 3117
Ph¾sic0chemical
processes
I
I i
nucleation CLEAR AIR SULFATEC..
CLOUD WATER SULFATE brownJan turbulent diffusion oxidation in solution SULFUR DIOXIDE qdm bsorp CLOUD #ATER SULFITE tion tion accretion autoconversionRAIN WATER RAIN WATER
.
SULFATE
oxidation
1 Cr.
mqt. insolution
SULFITE
I
sedimentation
sulfate deposition
Fig. 2. Synopsis of the physicochemical processes in the mesoscale model.
•3H
Crp
•t
-- -- A(Cr•
) + H
• C,
n,
dynamical
capture •t accretion
-[-
• %1
C3
Ccp
autoconversion• Crp
•tsedimentationt
+ FC'p
(28)•3Hqr•,
•tA(qrp)+
autoconversionc• qc•
dynamical
capture+ -•
accretionsedimentation
3 c• qds
oxidation)
-•-
Fqr"(29)
where the operator A applied to a variable q is defined as
• • H•
A(q)
= •xx
(qHu)
+ • (qHv)
+ •7
• (a'qO)
The last terms F in (24)-(29) are the friction terms. Each
friction term consists, in a vertical eddy diffusion term repre-
senting the turbulent transport of a variable within the plane- tary boundary layer [Nickerson, 1979] and in a horizontal diffusion term, of the form'
operating on a v-surface.
Aerosol scavenging by hydrometeors occurs through two different mechanisms. First, aerosols are scavenged through direct capture by raindrops: the associated capture rate is calculated after Dana and Hales [1976]. Second, indirect scav- enging can take place through a two-stage process [Pruppa- cher and Klett, 1978]. In the first stage, most aerosols are incorporated into cloud water by nucleation and by Brownian
and turbulent diffusion. In the second stage this polluted cloud
water is accreted by falling raindrops or cloud droplets to form larger raindrops. The parameterizations developed for Brownian and turbulent diffusion rates are from Dingle and
Lee [1973]. A comprehensive survey for removal rate parame-
terizations can be found in the work by Chaumerliac et al. [1986].
3118 CHAUMERLIAC ET AL.' SULFUR SCAVENGING IN A MESOSCALE MODEL •290'--••• 279.0- 3e,2.?
potential
temperature
(K)
_ 279,0-3•Z9 279,0 - ::F.,3,0 0-29.9horizontal wind (m/s)
• . O -77.9 ß i ! 0 -25.9...
?,"
.'-'."i.
-. "t:',;, "0 .... ":.• '~ -656-5,.3.1vertical
vetocity
(cm/s)
i. '
/
I
-C•.1-62 5 ', -lO"o
!
-651-309a)dry
b)cont,ner•l
c)marit,me
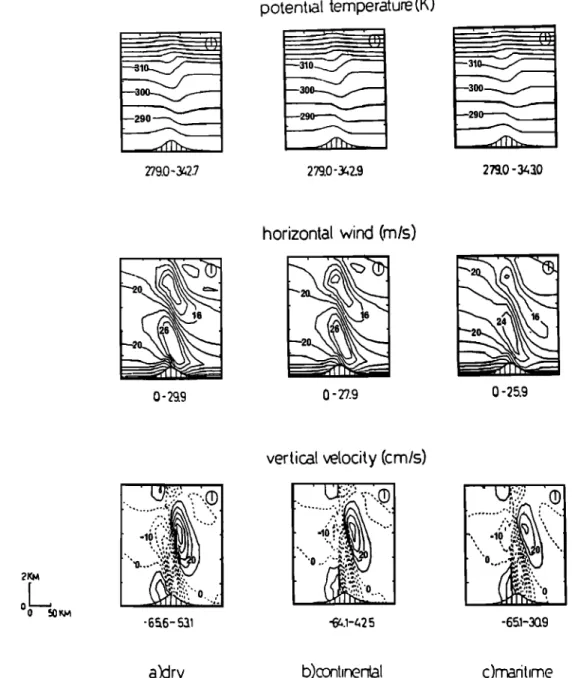
Fig. 3. Potential temperature, horizontal and vertical velocities for (a) dry, (b) continental, and (c) maritime cases in the presence of orography. Extreme values of the isocontours are indicated at the bottom of each figure.
The rates of accretion and autoconversion, for the transfer of cloud water sulfates to rainwater sulfates, are calculated using the microphysical rates with proportionality relation- ships.
The sedimentation term is formulated as follows:
C•
Cry
c•t sedimentation
- az
•,N,.
w
S.(30)
where
S n is the sedimentation
flux of raindrops.
The term
• qrp
•t sedimentation
is formally similar.
The nucleation rates, not appearing in the set of equations
(24)-(29) are substracted
from C,v and q,•, and added to Ccv
and qcv
after every
advance
in time. The term C•v.n
½
is pro-
portional
to Nn ½
but the term q,v.n½
has to be calculated
by
4 3
q.v'n.½
= •'=rn.½
C.v.n.½
(31)
The dry condensation nucleus radius rn. ½ is required and is calculated by equating [Prodi and Tampieri, 1982]:
8(2•)
1'
'2'
(O'/'H'w/3
/ 2
(i/'H'/9/w'•
- l / 2
(32)
Smax--
9p. k,
RT
/ X,
mN
/
The nucleus mass m, then the dry radius rnu ½ are deduced from this relationship.
Considering now gaseous pollutants, prediction is made of
the SO 2 mixing ratio. Sulfur dioxide is absorbed
by cloud
droplets
and raindrops
before
being oxidized
in solution.
Only
major SO,• oxidants
in aqueous
phase,
ozone, and hydrogen
peroxide
are considered
here. The formulations
of SO 2 disso-
lution and its subsequent oxidation are derived from Hegg et
al. [1984b]. 0 3 and H202 are 50 ppb and 1 ppb, respectively,
initially in the gas phase and the rates of oxidation of S(IV) are based on Maahs [1983] for 0 3 and on Martin [1984] for H202.
CHAUMERLIAC ET AL..' SULFUR SCAVENGING IN A MESOSCALE MODEL 3119 Z(K•4• 1_ 0 0 m can finen ___ mar/time Fig. 4. Vertical profiles of vertical velocity and supersaturation for continental clouds (solid lines) and maritime clouds (dashed lines)
atx= 110km.
3. MODEL RESULTS 3.1. Initial Conditions
In order to test simultaneously the microphysical and physi-
cochemical parameterizations, a series of two-dimensional sen-
sitivity tests were carried out. This choice has been made be- cause two-dimensional simulations are less time consuming
than three-dimensional ones and because such idealized tests
are well documented as regards to the dynamics [Klemp and Lilly, 1978; Mahrer and Pielke, 1978]. Comparative tests be- tween dry, continental, and maritime conditions have been performed. Because of complex interactions between meteoro-
logical and physicochemical processes, such tests are especially
useful for identifying the relative contributions of each mecha-
nism.
The model is run over an idealized bell-shaped mountain, 1 km high and 25 km in halfwidth. A two-layer atmosphere is considered, with a lower layer of constant lapse rate up to 8 km and an isothermal layer aloft. The initial horizontal wind speed is uniformly 20 ms-1 and the relative humidity is 80%
below 3 km.
In addition, the SO 2 and sulfate variables are initialized with the following exponential profiles [Hegg et al., 1984b]:
qds(Z)
= 4.3 x 10 -9 exp (-z/2000)
(33)
q•v(z)
= 4 x 10-•2 exp (--z/3500)
(34)
C.v(z
) = 109
exp (--z/3500)
(35)
where z is the altitude, all units being in MKS.
Our selected case is typical of background pollution in Western Europe [Georgii, 1978; Georgii and Meixner, 1980]. Tests to evaluate interactions between microphysical and
physicochemical processes together with comparisons between
continental and maritime cases are performed over 6-hour simulation periods. In the comparison between continental and maritime clouds, one discriminates between their dynam- ical features, their spectra, and the relative efficiency with
which they can scavenge aerosols and gases.
3.2. Meteorological Fields
First, the dynamics of mountain waves are investigated under three cases: dry case (no moisture) as opposed to conti-
nental and maritime clouds. Figure 3a displays the results of a dry simulation, while Figures 3b and 3c refer to simulations for continental and maritime cases, respectively. When com- paring Figure 3a and Figures 3b and 3c, one can observe that moist waves are weaker in amplitude than dry waves [Durran and Klemp, 1983]. Between Figures 3b and 3c, noticeable dif- ferences appear in the dynamical fields, with larger vertical
velocities in the continental case. This is even more obvious
for the vertical profiles in Figure 4 where vertical velocities are
drawn as a function of height at a selected grid point (one grid
point upwind from the mountain top). Vertical super- saturation profiles are reported in Figure 4. We find that
supersaturations in the region of active updrafts are about
twice as great in the maritime case as in the continental one. Profiles in Figure 4 are quite comparable to the results of Lee and Pruppacher [1977], in their comparative study of conti- nental and maritime cumuli within the dynamical framework of an entraining air parcel.
In addition to changes in dynamical features, other typical
differences between continental and maritime clouds can be
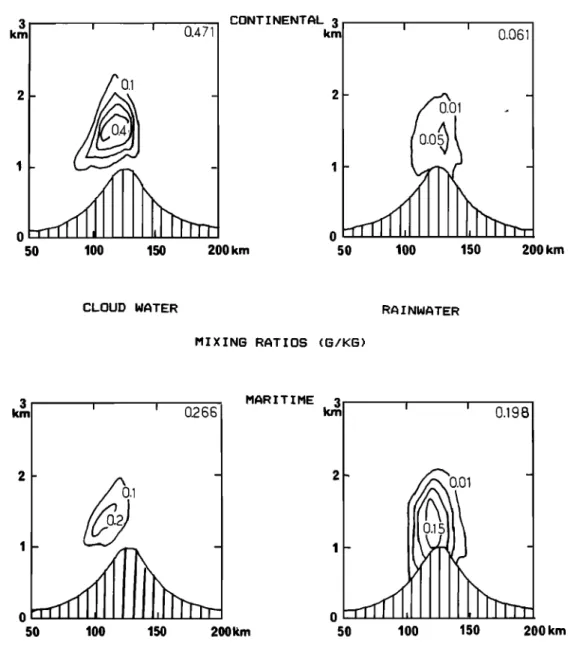
found in their spectra, determined from the cloud con- densation nuclei spectra. Thus high droplet concentrations (500-600 cm-3) with narrow spectra centered at about 10 ttm, typical of continental clouds have been obtained. The mari- time cloud simulated in the model contains about 50 droplets cm-3 with diameter of about 25 ttm. In Figure 5, vertical cross sections of cloud water and rainwater mixing ratios are dis- played which reflect the major differences between continental
and maritime clouds. Cloud water contents are about twice as
large in the continental case, while rainwater contents are con- siderably larger in the maritime case. Consequently, after 6 hours of model time, one observes in Figure 6 that the mari-
time cloud rains about 10 times more than the continental
cloud and that the maximum of precipitation is not located at the same position in the continental and maritime cases. In Figure 6 there is a slight shift of both the maxima of precipi- tation, the continental cloud raining farther from the moun- tain top than the maritime cloud. This is probably due to continental small cloud droplets being more sensitive to ad- vection leading to longer growth times before effective pro-
duction of rain by coalescence [Squires, 1958].
3.3. Aerosol Scavenging Results
Nucleation is widely recognized as the most efficient process among all scavenging mechanisms [Flossmann et al., 1985; Jensen and Charlson, 1984; Radke, 1983; Hegg et al., 1984a]. In order to evaluate the effects of nucleation scavenging, we proceed to two sensitivity tests. In the first run all the scav-
enging processes are considered, while in the second run the
nucleation scavenging term is set equal to zero. These two cases (with and without nucleation) are considered for both maritime and continental clouds. To study the relative ef-
ficiency of aerosol scavenging in the two types of clouds, the
same initial aerosol distribution is assumed. This vertical pro- file, typical of continental cases has been specified earlier (see section 3.1, (equations (34)-(35)).
Results are presented in Figures 7 and 8 in the form of
vertical cross sections for concentrations of aerosols attached
to cloud droplets (Figure 7) and aerosols removed by rain (Figure 8) after a 6-hour run. A large difference in the number of aerosols collected by cloud water is observed between the run accounting only for the dynamical capture of aerosols
3120 CHAUMERLIAC ET AL.' SULFUR SCAVENGING IN A MESOSCALE MODEL 3 i I CONT I NENTAL 3 0.471 km 100 150 200 km
•
•
0.061'
O.Ol
. -
50 100 150 200 km CLOUD WATER MIXING RATIOS (G/KG) RA I NWATER3
•
•
MARITIME
km 0.266 0 0 50 50 0.1 100 150 2001•m I I 0.198 100 150 200kmFig. 5. Vertical cross sections of (a) cloud water mixing ratio and (b) rain water mixing ratio after 6-hour model time in continental and maritime cases. The maxima values of q½,• and q,,• are reported in the right corner of each figure. (Figure 7a) and the run including all the scavenging processes
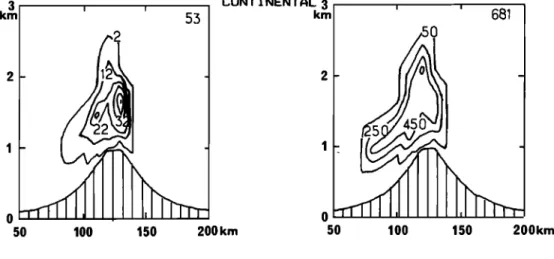
(Figure 7b). There is 1-2 orders of magnitude difference be- tween the results of the simulations with and without nuclea- tion in continental and maritime cases, respectively. The conti- nental cloud is more efficient for in-cloud scavenging (Figure
7) and the contribution of scavenging by Brownian and turbu-
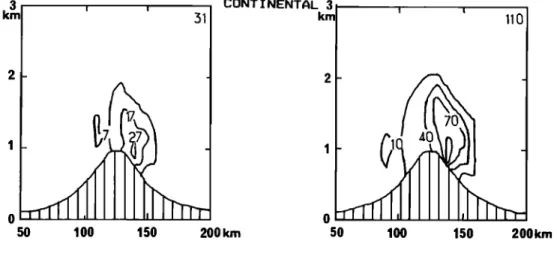
lent diffusion (Figure 7a) is not completely negligible for small cloud droplets which are apt to collect aerosols of radii less than 0.1 #m. This has already been suggested by Garland [1978]. On the contrary, maritime clouds are much more ef- ficient for removing aerosols (Figure 8), even when the nuclea- tion term has been omitted (Figure 8a). This is essentially due
to the predominance of autoconversion in the initiation of the
rain process in maritime conditions. As already underlined, it can be inferred that sulfate wet deposition will be more ef-
fective in the case of maritime cloud. This will be discussed later, in section 3.5.
3.4. Gas Scavenging Results
Before studying sulfate deposition, SO 2 dissolution and oxi- dation by H20: and O 3 and its subsequent transformation to
sulfates must be considered.
o 50 PRECIPITATION (CM) I I I I - i i i i i i i ! i _ i i 100 150 km MAR I T I ME CONTINENTAL
Fig. 6. Precipitation amount (in centimeters) cumulated over a 6-hour period for continental (solid line) and maritime clouds (dashed line).
CHAUMERLIAC ET AL.: SULFUR SCAVENGING IN A MESOSCALE MODEL 3121 3 km ! i 53 ß 50 100 150 200km CONTINENTAL 3 km o 50 50 lOO 681 150 200km
IN-CLOUD AEROSOL CONCENTRATION (N/CM -•-)
i i km 7 2- 1. - 1 0 50 MAR I T I ME 3 krn o lOO 15o 200km 50
'
'
551
50 100 150 200kmW I THOUT NUCLEAT I ON N I TH NUCLEAT I ON
Fig. 7. Vertical cross sections of in-cloud aerosol concentration Cop (in number per cubic centimeter) in continental
and maritime clouds (a) without nucleation and (b) with nucleation. The maximum value of Ccp is reported in the right
corner of each figure.
Results of sensitivity tests are first presented in order to study the relative impact of 0 3 and H•_O 2 oxidation on the conversion of SO2 into sulfate particles. Vertical cross sections of SO: mixing ratio after oxidation by ozone (Figure 9a) and after oxidation by both 03 and H20 2 (Figure 9b) have been superimposed on vertical cross sections, for which only advec- tion effects have been considered (dashed isocontours in
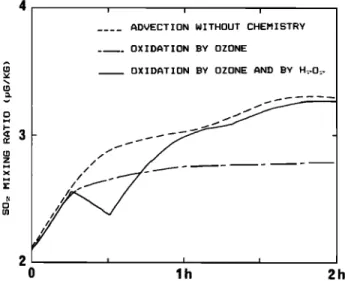
Oxidation by H:O: is initially fast and leads to a rapid de- crease in cloud water pH; however, it cannot be sustained past the first few minutes of cloud because of H:O2 depletion. The pH was initially set to 5; it falls down to a value less than 4. When only oxidation by 0 3 occurs, the pH is not very much affected and differences between curves 2 and 3 in Figure 10 can be explained by the fact that 0 3 contribution to sulfate Figure 9). Clear SO: depletion coinciding with the presence of formation is more efficient when the pH is greater than 4 cloud (shaded zones) is observed in Figure 9 when oxidation
occurs. The reduction in SO: mixing ratio is even greater when considering simultaneous oxidation by 0 3 and H:O: (Figure 9b) than when considering oxidation by O 3 only (Figure 9a). If we now focus (Figure 10) on the time evolution of SO2 mixing ratio, the oxidation by H:O: appears to occur quite rapidly (after about half an hour model time), after which slower oxidation by 0 3 takes place for several hours.
[Hoffmann and Jacob, 1984; Seigneur and Saxena, 1984]. Surprisingly, we did not find any striking difference between maritime and continental clouds as regards the SO2 mixing ratios after oxidation in the aqueous phase. Presumably, some compensating effect arises between the dynamical and physi-
cochemical processes leading to such a similarity. In order to
identify which ones of those processes are balancing each
3122 CHAUMERLIAC ET AL.' SULFUR SCAVENGING IN A MESOSCALE MODEL 3 km ! ! 50 100 150 200 km CONTINENTAL 3 kr• I 110 - _ 50 100 150 200krn
REMOVED AEROSOL CONCENTRATION (N/CM =)
3 km 2 ! i •7 30 50 100 150 200km
MAR
I T I ME
k•
- 25 50 100 150 200kmW I THOUT NUCLEAT I ON WITH NUCLEATION
Fig. 8. Same as Figure 7, but for removed aerosol concentration C,p.
actions in the model by setting to zero the term of latent heat release in (1). Thus the dynamical conditions of Figure 3a are artificially imposed on the continental and maritime clouds. Figure 11 displays the vertical cross sections of the SO2 mixing ratio for both clouds. The continental cloud is more
efficient than the maritime one for SO2 scavenging. Clearly, a
rapid SO2 disappearance occurs as the cloud begins to form in
the zone where condensation processes act upwind of the
mountain top. The differences observed in the SO 2 fields can
be attributed to smaller continental droplets with longer resi- dence times than maritime cloud ones [Hong and Carmichael, 1983; Charneides, 1984].
3.5. Sulfate Deposition
Deposition is the ultimate stage in a chain of very complex interactions between pollutants, winds, clouds, and rain. It
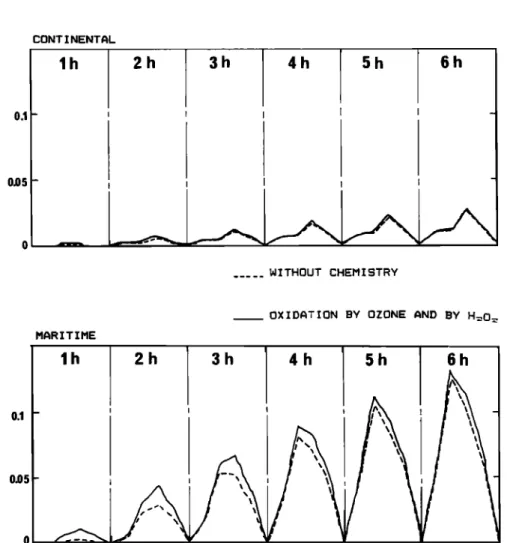
represents a concrete and measurable parameter useful in comparative studies. In Figure 12, comparative tests are syn- thesized in the form of wet sulfate deposition (in micrometers) accumulated over a 6-hour period. The amount of deposited sulfate is larger in the maritime case (Figure 12b) than in the continental one (Figure 12a). The shift in the maxima of sul- fate deposition between the two cases is probably associated with the precipitation drift already discussed in section 2.2). Another test which has been performed bears upon the sensi- tivity of sulfate deposition to SO 2 oxidation in aqueous phase. The foremost observation in Figure 12, by comparing dashed lines with solid lines, is that the SO2 scavenging only accounts for a small fraction of the overall pollutant deposition in the continental case. It looks more important in the maritime case, for which it is about one third of the overall sulfate deposition in the first 2 hours of the simulation (Figure 12b).
CHAUMERLIAC ET AL.' SULFUR SCAVENGING IN A MESOSCALE MODEL 3123
SOT MIXING RATIO <pG/KG)
3 km I 0 0 50 50
,x
,,, 2
-..-•
100 150 km 100 150 kmADVECTION WITHOUT CHEMISTRY ADVECTION WITHOUT CHEMISTRY OXIDATION BY OZONE •OXIDATION BY OZONE AND BY
Fig. 9. Vertical cross sections of the SO 2 mixing ratio in maritime clouds after 0.5 hour' (a) without chemistry (dashed
line) and with oxidation by ozone (solid line), (b) without chemistry (dashed line) and with oxidation by H202 and ozone (solid line). Shaded zones show the presence of cloud water. The vertical and horizontal scales are indicated.
The differences in Figure 12b are more obvious at the be- part of total wet deposition is due to SO 2 scavenging, which ginning of the simulation because of the oxidation effect of itself is dependent upon the liquid water content and the drop- H202, which acts during the cloud formation. let sizes. It should be emphasized that the spectral information
4. CONCLUSIONS
A quasi-spectral parameterization for liquid water (both cloud water and rainwater) has been included in the frame- work of a mesoscale model to quantify the interactive pro-
cesses at work in pollutant wet removal.
First, sensitivity tests have been performed to establish the following hierarchy among physicochemical processes. Nu- cleation scavenging has been found to be the most efficient in-cloud scavenging process. Its computation requires knowl- edge of an explicit nucleation rate and is a function of super- saturation and cloud spectrum. During the cloud formation a
o
I I
ADVECTION WITHOUT CHEMISTRY OXIDATION BY OZONE
OXIDATION BY OZONE AND BY H:.O•.
z
0 lh 2h
Fig. 10. Temporal evolution of SO 2 mixing ratio over 2-hour
period at x- 110 km and z = 150 m for three sensitivity tests: (a)
without chemistry, (b) with oxidation by ozone, and (c) with oxidation by ozone and H202.
given by our microphysical scheme is well suited to the treat- ment of SO 2 dissolution and oxidation in liquid phase, due to detailed representation of the condensation/evaporation pro- cesses. In addition, Brownian and turbulent diffusions may significantly contribute to in-cloud scavenging, in the case of small continental droplets capturing particles with radii less than 0.1 ttm. Through its quasi-spectral treatment of both hydrometeors and aerosols, the model has the ability to dupli-
cate such effects.
The second point to be emphasized is the methodology adopted for studying typical continental and maritime clouds through idealized tests. In the mesoscale, simultaneous col-
SOT MIXING RATIO (pG/KG>
km
2 -
50 100 150 km
MARITIME
CONTINENTAL
Fig. 11. Vertical cross sections of SO 2 mixing ratio for maritime (dashed lines) and continental (solid lines) clouds after 0.5 hour, with oxidation by H202 and ozone. Latent heat release effects have been
3124 CHAUMERLIAC ET AL. '- SULFUR SCAVENGING IN A MESOSCALE MODEL
SULFATE NET DEPOSITION (pM)
0.1 0.05 - 0 • CONTINENTAL lh 2h 3h 4h 5h 6h WITHOUT CHEMISTRY
OXIDATION BY OZONE AND BY H=O=
0.1 -- 0.05 - 0 MARITIME lh
2h 3h 4h 5h 6h
Fig. 12. Temporal evolution of sulfate wet deposition on the mountain top over 6-hour period for continental versus maritime cases for two sensitivity runs: (a) without chemistry (dashed lines) and (b) with oxidation by ozone and H20 2 (solid lines).
lection of meteorological and physicochemical data is difficult
to carry out experimentally. The results of this study suggest that a comprehensive numerical model could be effective in isolating the underlying interactions of winds, microphysics, and physicochemistry and should be able to discriminate be- tween their relative effects. This can be of use in defining experimental strategies or in interpreting data. Sulfate deposi-
tion is very sensitive to the cloud type: in-cloud scavenging is
favored in continental clouds, while precipitating maritime clouds remove particles more efficiently. Here only very simple chemistry has been incorporated in the mesoscale model. In particular, a ionic balance equation should be included in the model in order to have more consistency between the pH and the sulfate particle population. Also, because of its explicit representation of the cloud droplet size distribution, the effect of mass transport limitations on S02 aqueous-phase oxidation will be studied in the future.
APPENDIX: LIST OF SYMBOLS
C empirical
constant
(3500 cm-3 in continental
case,
100 in maritime case).
Ca•, dry aerosol
concentration.
Ca•,.nuc
number
of aerosols
activated
through
nucleation
during one time step.
Cc•
, cloud water aerosol
concentration.
C•, specific
heat at constant
pressure
for dry air.
C•,m specific
heat at constant
pressure
for moist
air.
Cry, removed
aerosol
concentration.
Dc cloud droplet diameter.
D•o distribution
parameter
for the lognormal
cloud
droplet distribution.
Dcrit minimum critical diameter of (soluble)particles
activated at supersaturation Sma x.
D r raindrop diameter.
Dro distribution
parameter
for the lognormal
raindrop
distribution.
D•, water vapor diffusivity.
F x friction terms relative to any prognostic variable X.
K thermal conductivity.
K n horizontal diffusion coefficient. L v vapor latent heat.
N cloud condensation nucleus concentration. N•w cloud droplet concentration.
Nnu c number of cloud droplets nucleated during one time step.
Nrw raindrop concentration.
P Pressure.
CHAUMERLIAC ET AL.' SULFUR SCAVENGING IN A MESOSCALE MODEL 3125
Pt pressure at the lower boundary.
Pr pressure at the top boundary.
R specific gas constant for dry air. Re Reynolds number.
R•, specific gas constant for moist air. S supersaturation.
Sc Schmidt number.
S n sedimentation flux of raindrops.
Stoa x maximal supersaturation.
T temperature. X -- Rel/2Scl/3
esw saturation vapor pressure over plane water surface. f ventilation factor.
g acceleration of gravity.
i Van't Hoff coefficient for nonideal aqueous salt solution (= 3).
k empirical constant (0.9 in continental case, 0.7 in maritime case).
rn nucleus mass.
m•v molecular weight of salt (= 132.1 x 10⁻³ for (NH•,)2SO4).
m,, molecular weight of water.
qa•, dry aerosol
volume
mixing ratio.
qat,.nuc volume mixing ratio of aerosols activated through nucleation during one time step.
qc•, cloud water aerosol volume mixing ratio. qc•, cloud water mixing ratio.
q,•s SO 2 mixing ratio.
qnuc mixing ratio for cloud droplets nucleated during one time step.
q,•, removed
aerosol
volume
mixing ratio.
q,,•, rainwater mixing ratio. q•, vapor mixing ratio.
qv• saturation vapor mixing ratio.
rnu c nucleus radius.
t time.
x horizontal west-east coordinate.
y horizontal south-north coordinate.
z altitude. /• beta function; fi(a, b)= x a- •(1 - x) b- • dx. e constant (=0.623). pa density of air. P,v density of water.
v vertical coordinate defined by a = (4v- v4)/3. • vertical velocity.
rr constant (=3.141592653). FI ground pressure (=P• - Pt)
tc constant (= 2/7).
a pressure coordinate defined by a = (P- PT)/II. a' da/dv.
a½ dispersion parameter for lognormal cloud droplet distribution (0.15 for continental cloud and 0.28 for maritime cloud).
a, dispersion parameter for lognormal raindrop
distribution (= 0.5). {9 potential temperature.
Acknowledgments. The authors would like to express their grati- tude to P. Mascart for his support and encouragement and R. Rosset
for his helpful comments and suggestions. This work was supported
by funds from Electricit6 de France and the authors gratefully ac- knowledge their support. The computer simulations were performed with the support and assistance of Centre de Calcuf Vectoriel pour la Recherche, Palaiseau, France, project 3736, the European Center for Medium Range Weather Forecasts, Reading, England, and also M6t6orologie Nationale, Paris.
REFERENCES
Asselin, R., Frequency filter for time integrations, Mon. Weather Rev.,
lO0, 487-490, 1972.
Berry, E. X., and R. L. Reinhardt, Modeling of condensation and collection within clouds, Desert Res. Inst. Phys. Sci. Publ., 16, Univ. of Nev., 1973.
Chameides, W. L., The photochemistry of a remote marine stratiform cloud, J. Geophys., Res., 89, 4739-4755, 1984.
Chaumerliac, N., E. C. Nickerson, and R. Rosset, A 3D mesoscale model as a potential tool for the evaluation of sulfate particles scavenging, Ann. Geophys., Ser. B, 4(3), 345-352, 1986.
Dana, J., and J. M. Hales, Statistical aspects of the washout of poly- disperse aerosols, Atmos. Environ., 10, 45-50, 1976.
Dingle, A. N., and Y. Lee, An analysis of in-cloud scavenging, J. Appl.
Meteorol., 12, 1295-1302, 1973.
Durran, D. R., and J. B. Klemp, A comprehensive model for the simulation of moist mountain waves, Mon. Weather Rev., 111,
2341-2361, 1983.
Flossman, A. I., W. D. Hall, and H. R. Pruppacher, A theoretical study of the wet removal of atmospheric pollutants, I, The redistri- bution of aerosol particles captured through nucleation and impac- tion scavenging by growing cloud drops, J. Atmos. Sci., 42, 583-
606, 1985.
Garland, J. A., Dry and wet removal of sulphur from the atmosphere, Atmos. Environ., 12, 349-362, 1978.
Georgii, H. W., Large-scale spatial and temporal distribution of sulp- hur compounds, Atmos. Environ., 12, 681-690, 1978.
Georgii, H. W., and F. X. Meixner, Measurement of the tropospheric and stratospheric SO 2 distribution, J. Geophys. Res., 85, 7433-7438,
1980.
Hegg, D. A., P. V. Hobbs, and L. F. Radke, Measurements of the scavenging of sulfate and nitrate in clouds, Atmos. Environ., 18, 1939-1946, 1984a.
Hegg, D. A., S. A. Rutledge, and P. V. Hobbs, A numerical model for sulfur chemistry in warm-frontal rainbands, J. Geophys. Res., 89,
7133-7147, 1984b.
Hoffmann, M. R., and D. J. Jacob, Kinetics and mechanisms of the catalytic oxidation of dissolved sulfur dioxide in aqueous solution: An application to nighttime fog water chemistry, in S02, NO, and NO 2 Oxidation Mechanisms: Atmospheric Consideration, edited by J. G. Calvert, 101-172, Butterworth, Stoneham, Mass., 1984. Hong, H. S., and G. R. Carmichael, An investigation of sulfate pro-
duction in clouds using a flow-through chemical reactor model approach, J. Geophys. Res., 88, 10,733-10,743, 1983.
Jensen, J. B., and R. J. Charlson, On the efficiency of nucleation scavenging, Tellus, 36B, 367-375, 1984.
Kitada, T., G. R. Carmichael, and L. K. Peters, Numerical simulation of the transport of chemically reactive species under land and sea breeze circulations, J. Clim. Appl. Meteorol., 23, 1153-1172, 1984. Klemp, J. B., and D. K. Lilly, Numerical simulation of hydrostatic
waves, J. Atmos. Sci., 35, 78-107, 1978.
Lee, I. Y., and H. R. Pruppacher, A comparative study on the growth of cloud drops by condensation using an air parcel model with and without entrainment, Pure Appl. Geophys., 115, 523-545, 1977. Maahs, H. G., Kinetics and mechanisms of the oxidation of S(IV) by
ozone in aqueous solution with particular reference to SO 2 conver-
sion in nonurban tropospheric clouds, J. Geophys. Res., $$, 10,721- 10,732, 1983.
Mahrer, Y., and R. A. Pielke, A test of an upstream spline interpola- tion technique for the advective terms in a numerical mesoscale model, Mon. Weather Rev., 106, 818-830, 1978.
Martin, L. R., Acid Precipitation, in SO 2, NO, and NO 2 Oxidation Mechanisms: Atmospheric Considerations, edited by J. G. Calvert, p. 63-100, Butterworth, Stoneham, Mass., 1984.
Nickerson, E. C., On the numerical simulation of airflow and clouds over mountainous terrain, Contrib. Atmos. Phys., 52, 161-177, 1979. Nickerson, E. C., E. Richard, R. Rosset, an D. R. Smith, The numeri- cal simulation of clouds, rain, and airflow over the Vosges and Black Forest Mountains: A meso-model with parameterized mi- crophysics, Mon. Weather Rev., 114, 398-414, 1986.
3126 CHAUMERLIAC ET AL..' SULFUR SCAVENGING IN A MESOSCALE MODEL
Orlanski, I., A simple boundary condition for unbounded hyberbolic flows, J. Comput. Phys., 21, 251-269, 1976.
Prodi, F., and F. Tampieri, The removal of particulate matter from the atmosphere: the physical mechanisms, Pure Appl. Geophys., 120, 286-325, 1982.
Pruppacher, H. R., and J. D. Klett, Microphysics of Clouds and Pre- cipitation, 714 pp., D. Reidel, Hingham, Mass., 1978.
Pruppacher, H. R., and R. A. Rasmussen, A wind tunnel investigation of the rate of evaporation of large water drops falling at terminal velocity in air, J. Atmos. $ci., 36, 1255-1260, 1979.
Radke, L. F., Preliminary measurements of the size distribution of cloud interstitial aerosol, Precipitation Scavenging, Dry Deposition and Resuspension, edited by H. R. Pruppacher, R. G. Semonin, and W. G. N. Slinn, pp. 71-89, Elsevier, New York, 1983.
Sakakibara, H., A scheme for stable numerical computation of the condensation process with large time step, J. Meteorol. Soc. Jpn., 57, 349-353, 1979.
Seigneur, C., and P. Saxena, A study of atmospheric acid formation in different environments, Atmos. Environ., 18, 2109-2124, 1984. Squires, P., The microstructure and colloidal stability of warm clouds,
I, The relation between structure and stability, Tellus, 10, 256-271,
1958.
Tremblay, A., and H. Leighton, The influence of cloud dynamics upon the redistribution and transformation of atmospheric SO2: A nu- merical simulation, Atmos. Environ., 18, 1885-1894, 1984.
Twomey, S., The nuclei of natural cloud formation, II, The super- saturation in natural clouds and the variations of cloud droplet concentration, Geofis. Pura Appl., 43, 243-249, 1959.
N. Chaumerliac, E. Richard, and J.-P. Pinty, Laboratoire Associe de Meteorologie Physique, Observatoire de Physique du Globe de Clermont-Ferrand, Universit6 de Clermont II, Laboratoire Associe Centre National de la Recherche Scientifique No. 267, B. P. 45, 63170, Aubi•re, France.
E. C. Nickerson, National Oceanic and Atmospheric Adminis- tration Environmental Research Laboratories, GMCC/R/E/AR 4, 325 Broadway, Boulder, CO 80303.
(Received January 3, 1986; revised November 24, 1986; accepted December 1, 1986.)