HAL Id: hal-00327936
https://hal.archives-ouvertes.fr/hal-00327936
Submitted on 16 Jun 2005HAL is a multi-disciplinary open access
archive for the deposit and dissemination of sci-entific research documents, whether they are pub-lished or not. The documents may come from teaching and research institutions in France or abroad, or from public or private research centers.
L’archive ouverte pluridisciplinaire HAL, est destinée au dépôt et à la diffusion de documents scientifiques de niveau recherche, publiés ou non, émanant des établissements d’enseignement et de recherche français ou étrangers, des laboratoires publics ou privés.
Seasonal variations of the Water Soluble Organic Carbon
mass fraction of aerosol in two valleys of the French Alps
J.-L. Jaffrezo, G. Aymoz, C. Delaval, J. Cozic
To cite this version:
J.-L. Jaffrezo, G. Aymoz, C. Delaval, J. Cozic. Seasonal variations of the Water Soluble Organic Carbon mass fraction of aerosol in two valleys of the French Alps. Atmospheric Chemistry and Physics Discussions, European Geosciences Union, 2005, 5 (3), pp.3999-4036. �hal-00327936�
ACPD
5, 3999–4036, 2005Seasonal WSOC fraction of aerosol in
the French Alps J.-L. Jaffrezo et al. Title Page Abstract Introduction Conclusions References Tables Figures J I J I Back Close
Full Screen / Esc
Print Version Interactive Discussion
EGU
Atmos. Chem. Phys. Discuss., 5, 3999–4036, 2005 www.atmos-chem-phys.org/acpd/5/3999/
SRef-ID: 1680-7375/acpd/2005-5-3999 European Geosciences Union
Atmospheric Chemistry and Physics Discussions
Seasonal variations of the Water Soluble
Organic Carbon mass fraction of aerosol
in two valleys of the French Alps
J.-L. Jaffrezo1, G. Aymoz1, C. Delaval1, and J. Cozic1,2
1
Laboratoire de Glaciologie et G ´eophysique de l’Environnement (LGGE), 54 rue Moli `ere, 38402 Saint Martin d’H `eres Cedex, France
2
now at: Laboratory for Atmospheric Chemistry, Paul Scherrer Institute, CH-5232 Villigen, PSI, Switzerland
Received: 24 February 2005 – Accepted: 30 March 2005 – Published: 16 June 2005 Correspondence to: J.-L. Jaffrezo (jaffrezo@lgge.obs.ujf-grenoble.fr)
ACPD
5, 3999–4036, 2005Seasonal WSOC fraction of aerosol in
the French Alps J.-L. Jaffrezo et al. Title Page Abstract Introduction Conclusions References Tables Figures J I J I Back Close
Full Screen / Esc
Print Version Interactive Discussion
EGU
Abstract
Concentrations of Water Soluble Organic Carbon and WSOC fraction to OC were mea-sured at two urban sites in valleys of the French Alps during a period of two and a half years. Concentrations were as high as 10–15 µg/m3 in winter, but there is a clear seasonal cycle of the WSOC fraction, with minima occurring during winter. This
re-5
flects a marked dependency on temperature, with the average WSOC fraction being stable at 54.8±7.7% and 75.9±6.3% for temperatures in the ranges −10 to+3◦C and 12 to 24◦C, respectively. Several points are noteworthy in this evolution. First, there are limiting factors that prevent lower mass fractions in the low temperature range and higher mass fractions in the high temperature range. Second, the mass fraction at
10
the lower temperature is rather high, in apparent contradiction with OC being mainly insoluble close to the emission sources. Third, the range of 20% for the change of the WSOC fraction between these extreme conditions is indeed rather narrow when compared to evaluations of the secondary (and supposedly water soluble) OC fraction proposed in the literature, with most of the published values being in the range 40 to
15
70%. A comparison of the evolution of WSOC concentrations with that of dicarboxylic acids (DCA) clearly indicates the influence of two regimes in the formation of WSOC: one at higher temperatures classically linked with the increase of DCA concentrations and associated with oxidation processes, and another at lower temperatures involving a much lower increase of DCA concentrations. We proposed several hypotheses
in-20
volving processes that could be responsible for the large concentrations of WSOC in the particulate phase at our sites during winter.
1. Introduction
Few studies have focused on the Water Soluble Organic Carbon (WSOC) fraction of at-mospheric particles, even though this fraction is probably of the utmost importance for
25
ACPD
5, 3999–4036, 2005Seasonal WSOC fraction of aerosol in
the French Alps J.-L. Jaffrezo et al. Title Page Abstract Introduction Conclusions References Tables Figures J I J I Back Close
Full Screen / Esc
Print Version Interactive Discussion
EGU
the impact of aerosols on human health (Turpin, 1999; Dreher, 2000). Several investi-gations are currently available in the literature that outline studies conducted in urban or rural environments. However, the number of samples in most of these studies is rather low (see Sect. 3), and little ancillary data exists to delineate the respective impacts of sources and aging on the evolution of WSOC concentrations and the mass fraction
rel-5
ative to organic carbon (OC). Furthermore, these data were obtained through a large array of methods, both in relation to the collection of samples and the analyses of OC and WSOC concentrations, making comparisons and the construction of an overall picture rather difficult. The current belief maintains that the WSOC fraction is “low” for primary OC and that it increases with aging of the aerosol, together with the general
10
oxidation state of organic matter (OM) (Saxena and Hildemann, 1996; Decesari et al., 2001). However, this idea has not been substantiated by many comprehensive field studies, and in particular, no full seasonal cycle of WSOC is currently published that presents data derived from homogeneous collection and analytical methods for various environmental conditions.
15
The program POVA (Pollution des Vall ´ees Alpines) was launched in 2000 to focus on atmospheric chemistry in the two transit corridors between France and Italy: the Chamonix and Maurienne Valleys. This study was timed to take advantage of a unique opportunity: the “Tunnel du Mont Blanc” (TMB) in the Chamonix Valley was closed for nearly 3 years after a large accident in March 1999. During this time period, most
20
of the heavy-duty traffic in the area was re-routed through the “Tunnel du Fr´ejus”, in the Maurienne Valley. The general goal of the POVA program was to compare the air quality and modelled atmospheric emissions and transport in these two valleys before and after the re-opening of the TMB to heavy-duty traffic. The program included several intensive field campaigns, a long-term campaign, and 3-D modelling of atmospheric
25
dynamics and chemistry (Brulfert et al., 2005).
In this paper, we are presenting results of WSOC measurements conducted on sam-ples obtained during the long-term sampling at one site in each valley. Other publica-tions present discussions of the concentrapublica-tions of EC and OC (Aymoz, 2005; Jaffrezo
ACPD
5, 3999–4036, 2005Seasonal WSOC fraction of aerosol in
the French Alps J.-L. Jaffrezo et al. Title Page Abstract Introduction Conclusions References Tables Figures J I J I Back Close
Full Screen / Esc
Print Version Interactive Discussion
EGU
et al., 2005b1), and ionic species (Jaffrezo et al., 2005c2) obtained at the same time. We are aiming at an evaluation of the variability of the WSOC concentration and mass fraction in this study, and will make an attempt to understand the main factors and pro-cesses driving this variability. In a first part, we are presenting some tests performed to evaluate the experimental aspects of WSOC measurements.
5
2. Experimental
2.1. Sites and traffic
One site was located in the Chamonix valley (Fig. 1). This valley is 23 km in length, closed at its lower end by a narrow gorge (the Cluse pass) and at the upper end by the Col des Montets (1464 m a.s.l. (meters above sea level)) leading to Switzerland. The
10
valley is rather narrow (1 to 2 km on average at the bottom). The elevation of the valley floor is approximately 1000 m a.s.l. on average, and is surrounded by tall mountains cul-minating in the summit of Mont Blanc (4807 m a.s.l.). There are no industrial emissions or waste incinerators in the valley, and the main anthropogenic sources of emissions are vehicular traffic, residential heating (typically fuel or wood-burning stoves), and
15
some agricultural activity. The permanent population of about 12 000 is augmented by tourism, which brings in many times that number (on average 100 000 person/day in summer, and about 5 million overnight stays per year), mainly for short-term visits. There is only one road supporting all of the traffic into and out of the valley, but many secondary roads spread over the valley floor and the lower slopes. During the closing
20
1Jaffrezo, J. L., Aymoz, G., Cozic, J., Chapuis, D., and Maenhaut, W.: Seasonal variation of
PM10 main constituents in two valleys of the French Alps. I: EC/OC fractions, Atmos. Chem. Phys. Discuss., in preparation, 2005b.
2Jaffrezo, J. L., Aymoz, G., and Cozic, J.: Seasonal variation of PM10 main constituents
in two valleys of the French Alps. II – Ionic constituents, Atmos. Chem. Phys. Discuss., in preparation, 2005c.
ACPD
5, 3999–4036, 2005Seasonal WSOC fraction of aerosol in
the French Alps J.-L. Jaffrezo et al. Title Page Abstract Introduction Conclusions References Tables Figures J I J I Back Close
Full Screen / Esc
Print Version Interactive Discussion
EGU
of the TMB leading to Italy, the traffic at the entrance of the valley (14 400 vehicles/day on average) consisted mainly of cars (91% of the total, 50% of which were powered by diesel), along with a small number of local trucks (5%) and tourist buses (1%). Natu-ral sources of emissions are limited to forested areas, which are mainly composed of coniferous species (95% of which consists of spruce, larch and fir). Re-suspension of
5
soil dust is limited in winter, as most of the ground surface is covered by snow. The sampling site was located in the downtown area of the Chamonix town (6◦5201600E; 45◦5502600N; altitude 1038 m a.s.l.), about 10 m from a street. It can be considered a kerbside site.
The second site was located in the Maurienne valley in a residential urban area of
10
Saint Jean de Maurienne (6◦2100400E; 45◦1603400N; altitude 555 m a.s.l.), about 2 km from both the highway and some large aluminium plants. It can be considered an ur-ban background site. Saint Jean de Maurienne, the main town in the Maurienne Valley, is about 80 km from Chamonix in a SSW direction. This valley is much longer (about 80 km in length) and wider (about 3–5 km on average at the valley floor) than the
Cha-15
monix Valley. The surrounding mountains are lower, peaking at 3852 m a.s.l. with La Grande Casse. The elevation at the mouth of the valley is 330 m a.s.l. and increases to 2081 m a.s.l. at the end of the valley (the Col du Mont Cenis, leading to Italy). The topography of the Maurienne Valley is more complex than that of Chamonix, and in-cludes many tributary valleys and several narrow gorges and sharp bends. The 30 km
20
of the lower valley up to the town of Saint Jean de Maurienne supports several heavy industries, including steel transformation and aluminium and phosphorus production. Other anthropogenic emissions are linked to traffic. Most traffic (95% of the trucks and 55% of the cars) is found on the 50 km of highway leading from the valley entrance up to the town of Modane, the location of the entrance of the “Tunnel du Fr ´ejus” leading
25
to Italy. The traffic through the valley during the closure of the TMB averaged about 11 500 vehicles/day at Saint Jean de Maurienne, with 38% consisting of heavy-duty diesel trucks. The valley also supports agricultural activities, and some large forested areas, of which 60% consists of deciduous species (beech and chestnut) and the
re-ACPD
5, 3999–4036, 2005Seasonal WSOC fraction of aerosol in
the French Alps J.-L. Jaffrezo et al. Title Page Abstract Introduction Conclusions References Tables Figures J I J I Back Close
Full Screen / Esc
Print Version Interactive Discussion
EGU
maining 40% being occupied by coniferous trees (spruce). The total population of the valley is represented by about 45 000 inhabitants, most of whom are concentrated in the lower 40 km. Tourism is not as important as in Chamonix, but it results in about 4.2 million overnight stays per year on average, mostly during the winter season and in the upper part of the valley, where several ski resorts are located.
5
2.2. Sampling and processing
Both sites are permanent stations maintained by the local Air Quality Agency, l’Air de L’Ain et des Pays de Savoie. Continuous measurements at the stations conducted on a 15-min basis included NOx (Environnement SA, AC31M), ozone (Environnement SA, O341M), SO2(Environnement SA, AS21M), and PM10(TEOM1400, R and P). The
10
TEOMs were heated at 50◦C. Air intakes for all of these instruments were located about 4 m above ground on the roofs of the stations.
For this program, we added automatic aerosol sampling with ACCU samplers (R and P) on the by-pass flow of the TEOMs. These samplers where kept in a non-heated shelter close to outside temperature. All of the tubing of the ACCU systems was
15
replaced with Teflon-coated lines. We used stainless-steel filter holders with a conical shape to insure homogeneous deposit on the filters. Sampling was conducted on a daily basis, from midnight to midnight (local time), at a flow rate of 0.85 m3 hr−1 (face velocity of 21 cm.s−1). The samplers were serviced once a week, with the collection of 7 samples and one field blank. We used QMA Whatman filters. These were
pre-20
washed for 3 days in 3 successive bathes of Milli-Q water for lowering blanks for ionic species. After drying at 60◦C, they were then fired for 1 h at 800◦C to lower the blank levels for EC and OC. These filters were kept and transported to the field in packs of 20 in leak-proof glass jars before sampling. After sampling, exposed filters were downloaded directly in the field and stored at −5◦C in individual petri slides wrapped in
25
aluminium foil in sealed bags, until the analysis. All handling procedures were designed to reduce potential contaminations.
ACPD
5, 3999–4036, 2005Seasonal WSOC fraction of aerosol in
the French Alps J.-L. Jaffrezo et al. Title Page Abstract Introduction Conclusions References Tables Figures J I J I Back Close
Full Screen / Esc
Print Version Interactive Discussion
EGU
and between 10 February 2001 and 25 June 2003 in Saint Jean de Maurienne. The number of samples and field blanks are presented in Table 1. While the data series are not totally continuous, the numbers of samples are sufficiently high to give a very good representation of the variability of the concentrations over the sampling periods. 2.3. Analysis for EC and OC
5
Samples were analyzed for EC and OC using the Thermo-Optical Transmission (TOT) method on a Sunset Lab analyzer (Birch and Cary, 1996). We used temperatures up to 870◦C for the analysis of OC in 100% He, and up to 900◦C for the analysis of EC in 98% He + 2% O2 (Jaffrezo et al., 2005b2). Automatic split time was always used for the distinction between EC and pyrolysed OC, except for blank samples, where it
10
was manually corrected when needed. The transit time between the front oven and the FID detector was optimized and adjusted at 13 s. We analyzed a fraction of 1.5 cm2 from each sample, without any preparation. A subset of samples (approximately 5% of the overall set, for various sample loadings) was analyzed 3 times to check for the even repartition of particles on the filters and the accuracy of this sub-sampling method
15
for the determination of atmospheric concentration. This test indicated a really good reproducibility of the deposition, with variability of results being within 3%.
The arithmetic average of the concentrations of the field blanks was taken into ac-count for the calculation of atmospheric concentrations. Field-blank concentrations (equivalent to concentrations of OC=0.45±0.27 µg/m3and EC=0.045±0.064 µg/m3for
20
a sample of 20 m3of air) account for 6.6 and 4.4% of the average atmospheric concen-trations in summer for OC and EC, respectively (Aymoz, 2005). More than 760 daily concentrations for EC and OC were determined for each site (Table 1).
2.4. Extraction procedures for the determination of WSOC
We first tested two extraction procedures (soaking and filtration methods) aimed at
re-25
ACPD
5, 3999–4036, 2005Seasonal WSOC fraction of aerosol in
the French Alps J.-L. Jaffrezo et al. Title Page Abstract Introduction Conclusions References Tables Figures J I J I Back Close
Full Screen / Esc
Print Version Interactive Discussion
EGU
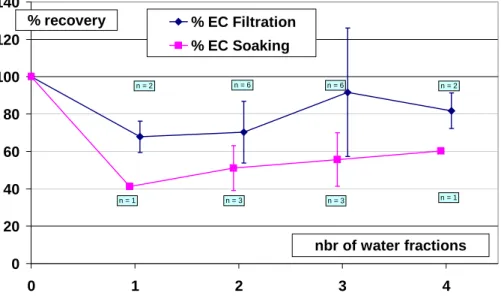
remaining insoluble fraction on the filters with the TOT method. Some of the studies referenced in Table 3 use comparable methods. Our tests were performed on real samples collected on the roof of our institute (in Grenoble), in conditions comparable to those of actual POVA samples. The soaking method consists of the immersion of the filter in n (n=1 to 4) successive bathes of 10 ml of Elga® water for 10 min each.
5
The filtration method consists of the filtration at a low flow rate (with the water sitting for 10 min prior the filtration) of n (n=1 to 4) successive bathes of 10 ml of Elga® water through the sample held in a Millipore® filtration device. A final step of both meth-ods included drying of the sample in a glove box in a nitrogen atmosphere before the analysis, following the protocol mentioned above (Sect. 2.3.). The procedure was
du-10
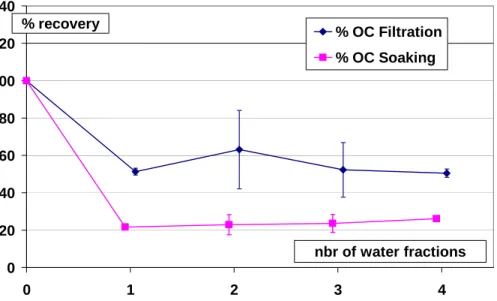
plicated a number of times, depending on the number of water fractions and method. Figures 2 and 3 present the average percentage of recovery of EC and OC, respec-tively, in relation to the number of water fractions used for both methods. Results show that the samples are losing EC (about 22 and 48% by mass on average for the filtra-tion and soaking methods, respectively) as a consequence of the first water fracfiltra-tion,
15
with no further statistically significant changes in EC according to the number of water fractions. As EC is insoluble by definition, removal of these fractions most probably takes place by mechanical processes, with the likely candidates being resuspension in the case of soaking and entrainment in the case of washing. In these conditions, the results obtained for OC (decreases of about 56 and 74% on average for the filtration
20
and soaking methods, respectively) are difficult to interpret in terms of removal of the soluble fraction only. These methods were subsequently abandoned.
We finally used a method with the direct analysis of the soluble OC in the liquid phase (see below). N (n=1 to 3, depending on the OC concentrations) aliquots (i.e. punches of 18 mm in diameter) of the initial daily samples were soaked in airtight glass bottles
25
in 17 ml of Elga® water for 40 min with some manual shaking. The extract was then filtered just before the analysis using Acrodisc filters (Pall Gelmann) with a porosity of 0.2 µm.
ACPD
5, 3999–4036, 2005Seasonal WSOC fraction of aerosol in
the French Alps J.-L. Jaffrezo et al. Title Page Abstract Introduction Conclusions References Tables Figures J I J I Back Close
Full Screen / Esc
Print Version Interactive Discussion
EGU
2.5. Analysis of WSOC
The analyses of WSOC concentrations were performed with a Model 700 TOC analyzer (OI Analytical). It is based on the IR detection of the CO2formed after the hot chemical oxidation of the carbon content of the liquid sample. The sample is first acidified with 200 µl of 5% phosphoric acid to drive off, using a nitrogen flux for 2.5 min, the CO2
5
formed from the inorganic carbonates. The OC content of the sample is then oxidized after the addition of 1 ml of sodium persulfate (100 g/l), and the CO2 is subsequently measured after degassing with the nitrogen flux. The volume of the sampling loop was 10 ml, the oxidation time was set to 11 min, and the temperature for the oxidation was 100◦C. These analytical conditions were previously tested by Pertuisot (1997).
10
The calibration was performed daily with 5 fresh synthetic solutions of sucrose (C12H22O11) covering the full range of the detector (0 to 4.2 µC/ml). This calibration was very stable from day to day. Several tests were performed to evaluate the un-certainty linked with this analysis. The coefficient of variation (standard deviation over mean) of 6 analyses of a synthetic solution at a concentration of 2.1 µC/ml was 0.7%.
15
The average coefficient of variation for the analysis of real atmospheric samples (analy-ses of 3 punches for each of 3 actual samples) was 1.5%. This last value most probably represents the overall uncertainty of the analysis with this method.
A series of 45 blanks from the POVA campaign were analyzed for their WSOC con-tent and were taken into account for the calculation of atmospheric concentrations.
20
Overall, the average blank represents 7.2±1.9% of the average concentration in Saint Jean de Maurienne. This last series was analyzed totally, leading to 277 values of WSOC concentrations because of the accretion of consecutive samples (Table 1). Only 104 values were obtained for the Chamonix series, based on a selection of samples collected mainly during one summer and two winter periods.
ACPD
5, 3999–4036, 2005Seasonal WSOC fraction of aerosol in
the French Alps J.-L. Jaffrezo et al. Title Page Abstract Introduction Conclusions References Tables Figures J I J I Back Close
Full Screen / Esc
Print Version Interactive Discussion
EGU
2.6. Analysis of organic dicarboxylic acids
The remaining parts of the filter (after extraction of the punches for EC/OC and WSOC analyses and removal of the outer ring in contact with the filter holder) were analyzed with Ionic Chromatography (IC) for the determination of a whole suite of anionic and cationic species (Jaffrezo et al., 2005c3) following the method described in Jaffrezo
5
et al. (1998), Ricard et al. (2002) and Aymoz (2005). In brief, samples were soaked in 10 ml of Milli-Q water for 30 min in airtight glass bottles. They were then filtered just before the analysis using Acrodisc filters (Pall Gelmann) with a porosity of 0.2 µm. Analysis of cations (NH+4, K+, Mg2+, Ca2+) took place with a CS12 column on a Dionex 100 IC. The determination of Na+ was prevented by the high concentration remaining
10
in the quartz filters. Analysis of inorganic anions (Cl−, NO−3, SO2−4 ) and dicarboxylic acids (DCA) (oxalate, glutarate, malonate, succinate, malate, and tartrate) took place on an AS11 column on a Dionex 500 analyzer. Table 2 presents the detection limits for these organic acids under the conditions of our analysis. We will only present results concerning the potassium concentration, as well as concentrations for the sum of all
15
measured DCA. The full suite of the daily samples was analyzed for the series from Saint Jean de Maurienne, while only 536 samples were processed for the Chamonix series (Table 1).
2.7. Final data set
The final data set for this long-term sampling campaign also includes daily data for
20
NO, NOx, O3, SO2, and PM10 concentrations, obtained by averaging the 15-min mea-surements. Furthermore, our investigation includes an analysis of meteorological data obtained from M ´et ´eo France (temperature, precipitation, wind speed) from the stations in Chamonix and Saint Jean de Maurienne, with hourly measurements averaged to obtain daily values. We also obtained traffic data from regional administrations and
25
highway companies for the sites of Tunnel des Chavants (at the lower entrance of the Chamonix valley) and Saint Michel de Maurienne (10 km upward of Saint Jean de
Mau-ACPD
5, 3999–4036, 2005Seasonal WSOC fraction of aerosol in
the French Alps J.-L. Jaffrezo et al. Title Page Abstract Introduction Conclusions References Tables Figures J I J I Back Close
Full Screen / Esc
Print Version Interactive Discussion
EGU
rienne). These are daily data sets, with separate counts for individual cars and trucks. Finally, the data pool also includes daily concentrations for many VOC species, sam-pled in parallel to PM10 with automatic systems during the first year of the campaign (Colomb, 2002). These measurements will not be discussed in this study.
3. Concentrations, mass fractions and seasonal variations of WSOC
5
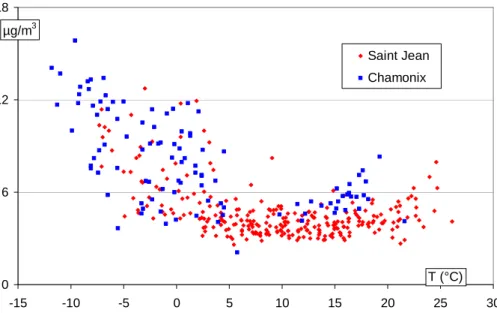
Table 3 presents a comparison of concentrations and WSOC fractions derived from most of the studies available in the literature. With the exception of much higher concentrations in Tokyo (Sempere and Kawamura, 1994) and considerably lower con-centrations at the high-altitude site of Jungfraujoch (Kryvacsy et al., 2001), all other concentrations (including our data) are in the same range. Our data indicates that
con-10
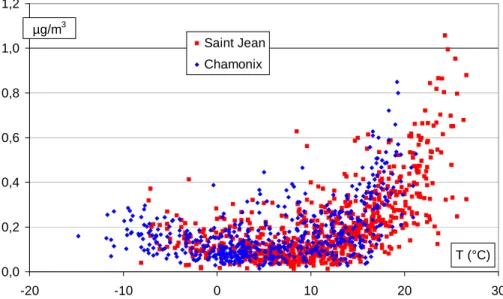
centrations of WSOC well above 10 µgCm−3 can be measured in winter conditions in these urban areas, close to the emission sources (Fig. 4). This is much higher than concentrations obtained in “warm” conditions (T>15◦C), which are generally consid-ered favourable for the formation of WSOC. It should be noted that these data are, to the best of our knowledge, the first to include measurements at temperatures below
15
freezing. We will not discuss the evolution of WSOC concentrations, which is strongly dependant upon atmospheric dynamics and local dispersion conditions. A presenta-tion of factors influencing OC concentrapresenta-tions is presented elsewhere (Aymoz, 2005; Jaffrezo et al., 2005b2). However, potential sources of WSOC will be discussed below (see Sect. 4).
20
Average data for WSOC fractions range from a low of 12% (next to a highway in Paris; Ruellan and Cachier, 2001) up to 80% for a rural area in Sweden during sum-mer (Zappoli et al., 1999) (Table 3). There is some tendency for lower values to be associated with urban areas, particularly in winter, and for higher values to occur in ru-ral areas, especially in summer. This is more or less consistent with the hypothesis of
25
WSOC consisting of a large fraction of secondary (oxidized) organic species. However, these data were obtained through very different protocols and are hardly comparable.
ACPD
5, 3999–4036, 2005Seasonal WSOC fraction of aerosol in
the French Alps J.-L. Jaffrezo et al. Title Page Abstract Introduction Conclusions References Tables Figures J I J I Back Close
Full Screen / Esc
Print Version Interactive Discussion
EGU
No clear seasonal pattern has emerged so far from the only consistent data set de-rived from samples obtained in all seasons (Decesari et al., 2001). Our data largely confirms such a trend, with lower average values at both sites in winter compared to other seasons. Furthermore, these average values are nearly identical for the two sites during both summer and winter, despite their slightly different characteristics (kerbside
5
for Chamonix, urban background for Saint Jean).
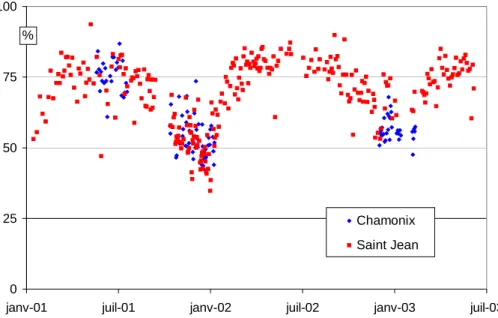
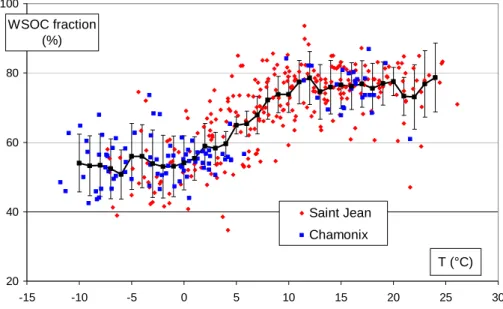
Figure 5 presents all measurements of the WSOC fraction obtained in this study. It shows a clear seasonal cycle with minima during both winters (2002 and 2003) for the two sites. While the values during the 3 summer periods are rather similar (averages between 75–80%), the minimum values during the winters are different, reaching (for
10
both sites) 40–45% for the winter of 2002, but remaining above 50% during the winter of 2003. This suggests a strong correlation with changes in temperature.
All of these observations are confirmed in Fig. 6, which shows the evolution of the WSOC fraction in relation to temperature for both sites, together with the moving av-erage (and standard deviation) for each 2◦C increment. A clear pattern of change
15
emerges, with the average WSOC fraction being stable at 54.8±7.7% and 75.9±6.3% for temperatures below 3◦C (in the range −10 to+3◦C) and above 12◦C (in the range 12 to 24◦C), respectively. There is a constant increase of the WSOC fraction between these ranges. These observations indicate that, on average, there are processes that prevent on the one hand WSOC fractions higher than 80%, even for so-called
20
favourable oxidation conditions, and on the other hand WSOC fractions lower than 40% for conditions that do not favour the oxidation of primary OC.
However, dispersion is still rather high (average coefficient of variation about 11.1% for all of the 2◦C intervals), and indicates that temperature (taken as a gauge of ox-idation conditions) is not the only factor affecting observed patterns. It will therefore
25
be interesting to relate these changes with other indicators of oxidation or tracers of sources.
ACPD
5, 3999–4036, 2005Seasonal WSOC fraction of aerosol in
the French Alps J.-L. Jaffrezo et al. Title Page Abstract Introduction Conclusions References Tables Figures J I J I Back Close
Full Screen / Esc
Print Version Interactive Discussion
EGU
4. Relation between WSOC, ozone, organic diacids and potassium
The evolution of the WSOC fraction has already been positively related to ozone concentrations in some studies (Sullivan et al., 2004), indicating a degree of depen-dency between processes that lead to the formation of oxidized species in the gas and particulate phases. However, it has been shown that such a relation does not
5
hold in all environmental conditions, with no further gain in the understanding of the connection between the processes (Sullivan et al., 2004). In our case, there are also some degrees of co-variation between ozone concentrations and the WSOC fractions at both sites, but the relations are not strong:
10
WSOC fraction (%)=0.28 * [ozone (µgm−3)]+ 56.9; r2=0.45; n=277 in Saint Jean WSOC fraction (%)=0.32 * [ozone (µgm−3)]+ 51.3; r2=0.51; n=104 in Chamonix. However, the correlations between WSOC and ozone concentrations are much lower:
15
WSOC (µgm−3)=−0.026 * [ozone (µgm−3)]+ 5.81; r2=0.18; n=277 in Saint Jean WSOC (µgm−3)=−0.065 * [ozone (µgm−3)]+ 9.65; r2=0.29; n=104 in Chamonix. The absence of a correlation can reflect the influence of many processes, such
20
as differences in oxidation and removal processes, their time scales, temperature dependence, or differences in the concentrations of primary species. Indeed, a more interesting analytical approach concerns the comparison of concentrations of WSOC with concentrations of species of known secondary origin in the particulate phase. This is the case for dicarboxylic acids (DCA), which are generally regarded as end
25
products of the oxidation of primary species, even if primary sources appear to be present in the urban atmosphere (Chebbi and Carlier, 1996). The most likely oxidation pathways for the production of DCA are probably in aqueous phase (hydrated particles
ACPD
5, 3999–4036, 2005Seasonal WSOC fraction of aerosol in
the French Alps J.-L. Jaffrezo et al. Title Page Abstract Introduction Conclusions References Tables Figures J I J I Back Close
Full Screen / Esc
Print Version Interactive Discussion
EGU
or cloud droplets) after an initial gas phase oxidation of primary compounds (Ervens et al., 2004), since direct production in the gas phase seems unlikely (Aumont et al., 2000).
Figure 7 presents the change of concentrations of the sum of DCA measured in our samples in relation to temperature. It shows a large continuous increase of the
con-5
centrations for warmer temperatures, and is consistent with a secondary production by oxidation. The concentrations do not reach a plateau for the warmer temperatures, an indication that the production of these species with low vapour pressures is not the limiting factor explaining the maximum ratio at 80% for the WSOC fraction (Fig. 6). The concentrations are still significant for cooler temperatures, possibly indicating primary
10
production or a degree of secondary formation. Indeed, this behaviour at sub-freezing temperatures is not the same for all species investigated (Aymoz, 2005), with some (tartrate, malate) showing near-zero concentrations while others (oxalate) exhibit sig-nificant concentrations. This finding will not be discussed further in this paper.
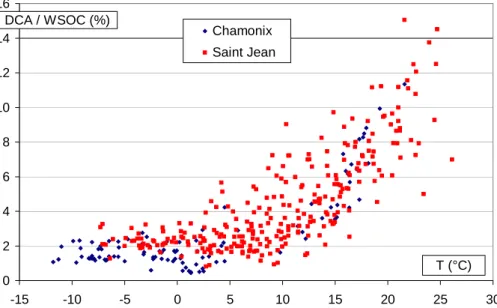
Figure 8 presents the mass fraction of WSOC represented by the measured DCA
15
in relation to temperature. Again, we observe a large and continuous increase with increasing temperature which does not show any sign of reaching a limitation. This mass fraction reaches a level of about 10–14%, and is in the range discussed by Sax-ena and Hildemann (1996) for observations made in urban sites. This mass fraction is much lower at low temperatures, and measures of DCA never account for more than
20
3% of the WSOC concentrations for T◦C<4◦C.
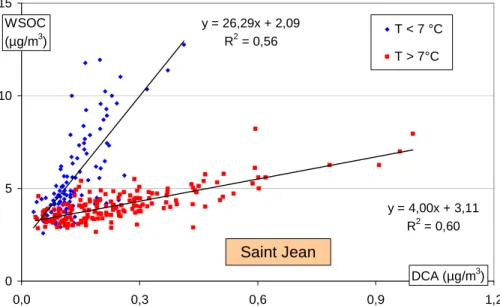
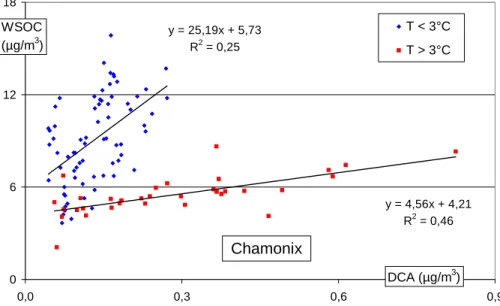
Indeed, Figs. 9 and 10 show that very different responses exist for WSOC and DCA on each side of a threshold temperature, with large increases of DCA concentrations occurring with moderate increases for WSOC concentrations for the higher tempera-tures. Conversely, the increase of DCA is only minor when large increases in WSOC
25
concentrations occur at the lower temperatures. This clearly indicates two regimes for the formation of WSOC: one being closely related to oxidation processes produc-ing DCA (at warmer temperatures), and another (at lower temperatures) beproduc-ing more loosely dependent upon the formation of these secondary species.
ACPD
5, 3999–4036, 2005Seasonal WSOC fraction of aerosol in
the French Alps J.-L. Jaffrezo et al. Title Page Abstract Introduction Conclusions References Tables Figures J I J I Back Close
Full Screen / Esc
Print Version Interactive Discussion
EGU
The slopes and intercepts of the regressions (Figs. 9 and 10) for the two sites are similar in both regimes, and indicate that the processes may be the same in the two valleys. However, a difference of 4◦C can be seen in the threshold temperature between the two sites, corresponding to the difference in the average daily temperature at the sites:
5
T◦C (CHX)=0.99 * T◦C (STJ) – 4.3 (r2=0.96; n=2145; 18 July 1997 to 1 June 2003). A likely hypothesis to explain this difference is that the link between WSOC and DCA for the warmer temperatures results from oxidation reactions that take place at similar
10
temperatures at places further away from the sampling sites, with the aerosols be-ing subsequently transported into the valleys (with the temperature at each receptor site being dependent on altitude, among others factors). The impact of imported air-masses in the valleys in summer has already been demonstrated in the case of ozone (Brulfert, 2004; Brulfert et al., 2005). Furthermore, this hypothesis could explain the
15
same shift of 4◦C that is also seen in Figs. 4 and 7 for the increases in the concentra-tions of WSOC and DCA in the warmer temperature ranges. This implies that a large share of the summer PM10 particles (at least for the secondary species) at both sites is coming for transport, and that it is not produced locally. Such a shift in the case of WSOC probably implies that most of the WSOC results from oxidation processes with
20
a characteristic time dependent on the transport time to the sites, with a small share of soluble primary compounds or secondary species produced locally, during the summer periods.
The case involving cold temperatures is more complex, exhibiting a much weaker correlation when considering the combined data set:
25
DCA (µg/m3)=0.124 * WSOC (µg/m3) – 0.28 (r2=0.54) for warm conditions (n=206) DCA (µg/m3)=0.011 * WSOC (µg/m3)+ 0.06 (r2=0.26) for cold conditions (n=173).
ACPD
5, 3999–4036, 2005Seasonal WSOC fraction of aerosol in
the French Alps J.-L. Jaffrezo et al. Title Page Abstract Introduction Conclusions References Tables Figures J I J I Back Close
Full Screen / Esc
Print Version Interactive Discussion
EGU
This may reflect the impact of several processes, or of different processes in each valley, on the production of WSOC in winter. It should be remembered that the char-acteristics of aerosol at our two sites are more strongly influenced by local conditions (primary emissions, meteorology) in winter than in summer periods (Aymoz, 2005). At least three non-exclusive hypotheses can be proposed to explain both the weak link
be-5
tween DCA and WSOC, and the large WSOC fraction during winter: i) direct emissions of soluble species, ii) oxidation pathways differ between summer and winter periods, and iii) changes in the gas/particle repartition for semi-volatile species.
The strong influence of temperature on the repartition of semi-volatile species be-tween gas and particulate phases (described by the coefficient Kp) is well known
10
(Pankow, 1994), and was verified in our case for some PAH species (Marchand, 2003). It has been shown, for example, that Kp can change by nearly 2 orders of magni-tude between 21◦C and −3◦C for some semi-volatile species (Leaitch et al., 1999), a change that is dependent upon the enthalpy of vaporization of the species (Tsigaridis and Kanakidou, 2003; Pun et al., 2003). Such a response has been reported for
15
soluble aldehydes (Saxena and Hildemann, 1996). Therefore, larger concentrations of such species (both primary and secondary) could be transferred in the particulate phase during winter. Additionally, partitioning for each species is dependent upon the composition of the aerosol that is already condensed, with Kp greatly increasing with the affinity between the condensed and condensable products (Leaitch et al., 1999;
20
Chandramouli et al., 2003). Residential biomass burning is a significant source of OC in winter in the valley (see below), with a large share of the emission products being composed of polar compounds, potentially increasing the condensation of this class of soluble species. However, detailed studies of the relation between the particulate and gaseous phases together with further molecular speciation of OC and WSOC are
25
needed to verify if such a process can have a significant impact on the WSOC fraction of OC at low temperatures.
The oxidation of primary species during winter conditions is also possible, but it is still rather difficult to evaluate its importance in terms of the chemical evolution of
ACPD
5, 3999–4036, 2005Seasonal WSOC fraction of aerosol in
the French Alps J.-L. Jaffrezo et al. Title Page Abstract Introduction Conclusions References Tables Figures J I J I Back Close
Full Screen / Esc
Print Version Interactive Discussion
EGU
OC. Measurements of the size distribution of OC in winter during POVA (Jaffrezo and Aymoz, 2005) show that a very large fraction of its mass (61±2%, n=6 daily samples collected in January 2003) exists in the so-called droplet mode (aerodynamic diameter in the range 0.26 to 1.0 µm), which is generally associated with cloud processing of smaller particles (Blando and Turpin, 2000; Ervens et al., 2004). A much smaller
5
fraction of the OC mass exists in the lower size ranges (15±1%, for the same samples) associated with primary emissions, such as those produced from diesel (Kerminen et al., 1997) or wood-smoke emissions (Hays et al., 2004). Oxalate is also measured in the same samples and exists mainly in this droplet mode, albeit with a much lower mass ratio to OC than that found in summer samples. It is likely that a large share of
10
this cloud processing during this period is taking place locally in the fog that formed at the top of the low inversion layers during these anti-cyclonic conditions. The processes involved in the formation of such a droplet mode at low temperature could lead to repartition of soluble organic species that differ from those of the summer period, and may potentially include aldehydes and other compounds (Blando and Turpin, 2000), as
15
well as polyacidic compounds (Decesari et al., 2001). Even if polyacidic compounds were present in larger proportions in the winter rather than summer samples in the study of Decesari et al. (2001), this hypothesis needs to be tested extensively and compared to the addition of OC mass in the particulate phase via a polymerization mechanism as proposed by Kalberer et al. (2004).
20
Finally, we can try to test the hypothesis concerning a change in the sources of OC that would increase WSOC concentrations in winter independently of DCA produc-tion. We have several indications that residential wood burning represents a substantial share of the emissions of OC in winter in the valleys (Marchand et al., 2004, 20053; Aymoz, 2005), and it is well known that these emissions include a large proportion of
25
soluble organic species (Mayol-Bracero et al., 2002; Schauer et al., 2001). We can at-3Marchand, N., Aymoz, G., Jaffrezo, J. L., Masclet, P., and Besombes, J. L.: Biomass
burn-ing indicators in the aerosol of Alpine valleys, Atmos. Chem. Phys. Discuss., in preparation, 2005.
ACPD
5, 3999–4036, 2005Seasonal WSOC fraction of aerosol in
the French Alps J.-L. Jaffrezo et al. Title Page Abstract Introduction Conclusions References Tables Figures J I J I Back Close
Full Screen / Esc
Print Version Interactive Discussion
EGU
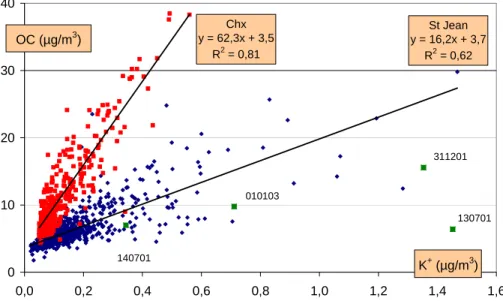
tempt an evaluation of the impact of this source between cold and warm conditions by considering the ratio with soluble potassium, a species also emitted by wood burning. Figure 11 shows the correlation between OC and K+ using the overall data set for the two sites.
Excluding a few points (13 and 14 July 2001, 31 December 2001, and 1 January
5
2003) that are influenced by fireworks, the correlation for the Chamonix series is high (Fig. 11), while the correlation is lower for samples from the Maurienne Valley. The very same correlations are observed when considering WSOC and K+:
Chamonix: WSOC (µgC/m3)=26.7 * K+ (µg/m3)+ 3.5 (r2=0.82; n=95)
10
Saint Jean: WSOC (µgC/m3)=6.8 * K+(µg/m3)+ 3.7 (r2=0.62; n=277).
The OC/K+ ratios shown in Table 4 can be compared to the values of 71–85 pre-sented by Khalil and Rasmussen (2003) for measurements in Olympia (WA, USA) under conditions strongly influenced by residential wood burning, or to measurements
15
of direct fireplace emissions performed by Schauer et al. (2001) that yielded ratios of 202 (for pine) and 91 (for oak) for the fine fraction (diameter <1.8 µm) of the aerosol. Both studies measured elemental K. The ratio observed for Saint Jean in our study most probably indicates additional sources of potassium. Taking into account all of the uncertainties associated with the measurements of OC, both the ratio OC/K+ in
Cha-20
monix and the high correlation between OC and K+are more suggestive of a significant impact by residential wood burning. It is therefore possible that this emission source in-fluences WSOC winter concentrations in Chamonix. However, the small changes of the OC/K+ ratio between winter and summer periods remain unclear, and further investi-gations are needed to substantiate a hypothesis of a WSOC fraction largely modulated
25
ACPD
5, 3999–4036, 2005Seasonal WSOC fraction of aerosol in
the French Alps J.-L. Jaffrezo et al. Title Page Abstract Introduction Conclusions References Tables Figures J I J I Back Close
Full Screen / Esc
Print Version Interactive Discussion
EGU
5. Conclusions
Concentrations of Water Soluble Organic Carbon and WSOC fraction to OC were mea-sured at two urban sites in valleys of the French Alps during a period of two and a half years. Concentrations were as high as 10–15 µg/m3in winter, but there is a clear sea-sonal cycle of the WSOC fraction, with minima occurring during winter. This reflects
5
a marked dependency on temperature, with the average WSOC fraction being stable at 54.8±7.7% and 75.9±6.3% for temperatures in the ranges −10 to+3◦C and 12 to 24◦C, respectively.
Several points are noteworthy in this evolution. First, there are limiting factors that prevent lower mass fractions in the low temperature range and higher mass fractions
10
in the high temperature range. Second, the mass fraction at the lower temperature is rather high, in apparent contradiction with OC being mainly insoluble close to the emis-sion sources. Third, the range of 20% for the change of the WSOC fraction between these extreme conditions is indeed rather narrow when compared to evaluations of the secondary (and supposedly water soluble) OC fraction proposed in the literature, with
15
most of the published values being in the range 40 to 70% (Castro et al., 1999; Strader et al., 1999; Na et al., 2004). All of these points deserve further investigation, both in other environmental conditions and in association with other measurements (molecular speciation, evaluation of chemical functional groups, etc.).
A comparison of the evolution of WSOC concentrations with that of dicarboxylic acids
20
(DCA) clearly indicates the influence of two regimes in the formation of WSOC: one at higher temperatures classically linked with the increase of DCA concentrations and associated with oxidation processes, and another at lower temperatures involving a much lower increase of DCA concentrations. We proposed several hypotheses involv-ing processes that could be responsible for the large concentrations of WSOC in the
25
particulate phase at our sites during winter. None of these hypotheses can be vali-dated or dismissed with our supporting data. Investigations on the WSOC fraction at low temperatures are needed, for such a temperature range is of the utmost importance
ACPD
5, 3999–4036, 2005Seasonal WSOC fraction of aerosol in
the French Alps J.-L. Jaffrezo et al. Title Page Abstract Introduction Conclusions References Tables Figures J I J I Back Close
Full Screen / Esc
Print Version Interactive Discussion
EGU
for cloud formation.
Acknowledgements. The program POVA was supported by R ´egion Rh ˆone-Alpes, ADEME
(Agence pour le D ´eveloppement et la Maˆıtrise de l’Energie), METL (Minist`ere de l’Equipement, des Transports et du Logement), MEDD (Minist `ere de l’Environnement et du D ´eveloppement Durable), and Programme Primequal 2. We would like to thank M ´et ´eo France for providing the
5
meteorological data, and DDE 73 et 74 and SFTRF for providing the traffic data. The sampling was maintained during the overall period by the Air Quality Agency “L’Air de l’Ain et des Pays de Savoie”http://www.atmo-rhonealpes.org/. We would like to thank S. Mongin, D. Gaude, H. Bult ´e, M. Lelimousin, and C. Delabarde for part of the analyses.
References
10
Aumont, B., Madronich, S., Bey, I., and Tyndall, G.: Contribution of secondary VOC to the composition of aqueous atmospheric particles: a modeling approach, J. Atmos. Chem., 35, 59–75, 2000.
Aymoz, G.: Etude de la fraction carbon ´ee de l’a ´erosol atmosph ´erique `a Chamonix et St Jean de Maurienne: ´evolutions saisonni `eres, sources et caract ´eristiques chimiques, Th `ese de
15
l’Universit ´e J Fourier, Grenoble, France, 290, 2005.
Birch, M. E. and Cary, R. A.: Elemental carbon-based method for monitoring occupational exposures to particulate diesel exhaust, Aerosol. Sci. Technol., 25, 221–241, 1996.
Blando, J. D. and Turpin, B. J.: Secondary organic aerosol formation in cloud and fog droplets: a literature evaluation of plausibility, Atmos. Environ., 34, 1623–1632, 2000.
20
Brulfert, G.: Mod ´elisation des circulations atmosph ´eriques pour l’ ´etude de la pollution des vall ´ees alpines. Th `ese de l’Universit ´e J. Fourier, Grenoble, France, 271, available athttp: //tel.ccsd.cnrs.fr/documents/archives0/00/00/79/82/index fr.html, 2004.
Brulfert, G., Chemel, C., Chaxel, E., and Chollet, J. P.: Modelling photochemistry in alpine valleys, Atmos. Chem. Phys. Discuss., 5, 1797–1828, 2005,
25
SRef-ID: 1680-7375/acpd/2005-5-1797.
Castro, L. M., Pio, C. A., and Harrison, R. M.: Carbonaceous aerosol in urban and rural Euro-pean atmospheres: estimation of secondary organic carbon concentrations, Atmos. Environ., 33, 2771–2781, 1999.
ACPD
5, 3999–4036, 2005Seasonal WSOC fraction of aerosol in
the French Alps J.-L. Jaffrezo et al. Title Page Abstract Introduction Conclusions References Tables Figures J I J I Back Close
Full Screen / Esc
Print Version Interactive Discussion
EGU
Chandramouli, B., Jang, M., and Kamens, R. M.: Gas-particle partitioning of semivolatile or-ganic compounds (SOCs) on mixtures of aerosols in a smog chamber, Environ. Sci. Technol., 37, 4113–4121, 2003.
Chebbi, A. and Carlier, P.: Carboxylic acids in the troposphere, occurrence, sources and sinks: a review, Atmos. Environ., 30, 4233–4249, 1996.
5
Colomb, A.: Les compos ´es organiques volatils dans les Vall ´ees Alpines: sources, ´evolutions et transformations, Th `ese de l’Universit ´e J. Fourier, Grenoble, France, 346, 2002.
Decesari, S., Facchini, M. C., Matta, E., Lettini, F., Mircea, M., Fuzzi, S., Tagliavini, E., and Putaud, J. P.: Chemical features and seasonal variation of fine aerosol water-soluble organic compounds in the Po Valley, Italy, Atmos. Environ., 35, 3691–3699, 2001.
10
Dreher, K. L.: Particulate matter physicochemistry and toxicology, In search of causality: a critical perspective, Inhalation Tox., 12 (supp 3), 45–57, 2000.
Ervens, B., Feingold, G., Frost, G. J., and Kreidenweis, S. M.: A modeling study of aqueous production of dicarboxylic acids: 1. Chemical pathways and speciated organic mass produc-tion, J. Geophys. Res., 109, D15205, doi:10.1029/2003JD004387, 2004.
15
Hays, M. D., Dean Smith, N., and Dong, Y.: Nature of unresolved complex mixture in size-distributed emissions of residential wood combustion as measured by thermal desorption-gas chromatography-mass spectrometry, J. Geophys. Res., 109, D16S04, doi:10.1029/2003JD004051, 2004.
Jaffrezo, J. L., Calas, N., and Boucher, M.: Carboxylic acids measurements with ionic
chro-20
matography, Atmos. Environ., 32, 2705–2708, 1998.
Jaffrezo, J. L. and Aymoz, G.: Size distribution of EC and OC in Alpine valleys during summer and winter, Atmos. Chem. Phys. Discuss., accepted, 2005.
Kalberer, M., Paulsen, D., Sax, M., Steinbacher, M., Dommen, J., Prevot, A. S. H., Fisseha, R., Weingartner, E., Frankevich, V., Zenobi, R., and Baltensperger, U.: Identification of polymers
25
as major components of atmospheric organic aerosols, Science, 303, 1659–1662, 2004. Kanakidou, M., Seinfeld, J. H., Pandis, S. N., Barnes, I., et al.: Organic aerosol and global
climate modelling: a review, Atmos. Chem. Phys., 5, 1053–1123, 2005, SRef-ID: 1680-7324/acp/2005-5-1053.
Kerminen, V. M., Makela, T. E., Ojanen, C. H., Hillamo, R. E., Vilhunen, J. K., Rantanen, L.,
30
Havers, N., Von Bohlen, A., and Klockow, D.: Characterisation of the particulate phase in the exhaust of a diesel car, Environ. Sci. Technol., 31, 1883–1889, 1997.
ACPD
5, 3999–4036, 2005Seasonal WSOC fraction of aerosol in
the French Alps J.-L. Jaffrezo et al. Title Page Abstract Introduction Conclusions References Tables Figures J I J I Back Close
Full Screen / Esc
Print Version Interactive Discussion
EGU
1222, 2003.
Kiss, G., Varga, B., Galambos, I., and Ganszky, I.: Characterization of water-soluble organic matter isolated from atmospheric fine aerosol, J. Geophys. Res., 107, 8339, doi:10.1029/2001JD000603, 2002.
Kriv ´acsy, Z., Hoffer, A., S´arv´ari, Z., Temesi, D., Baltensperger, U., Nyeki, S., Weingartner,
5
E., Kleefeld, S., and Jennings, S. G.: Role of organic and black carbon in the chemical composition of atmospheric aerosol at European background sites, Atmos. Environ., 35, 6231–6244, 2001.
Leaitch, K. B., Kamens, R. M., Strommen, M. R., and Jang, M.: Partitioning of semivolatile organic compounds in the presence of a secondary organic aerosol in a controlled
atmo-10
sphere, J. Atmos. Chem., 33, 241–264, 1999.
Marchand, N.: Etude de la composante organique de l’a ´erosol atmosph ´erique: cas de deux vall ´ees alpines (Chamonix et Maurienne) et d ´eveloppement analytique, Th `ese de l’Univ. De Savoie, Chamb ´ery, France, 339, Available athttp://tel.ccsd.cnrs.fr/documents/archives0/00/ 00/35/33/index fr.html, 2003.
15
Marchand, N., Besombes, J. L., Chevron, N., Masclet, P., Aymoz, G., and Jaffrezo, J. L.: Polycyclic aromatic hydrocarbons (PAHs) in the atmospheres of two French alpine valleys: sources and temporal patterns, Atmos. Chem. Phys., 4, 1167–1181, 2004,
SRef-ID: 1680-7324/acp/2004-4-1167.
Mayol-Bracero, O., Guyon, P., Graham, B., Roberts, G., Andreae, M. O., Decesari, S.,
Fac-20
chini, M. C., Fuzzi, S., and Artaxo, P.: Water soluble organic compounds in biomass burning aerosols over Amazonia: 2. Apportionment of the chemical composition and importance of the polyacidic fraction, J. Geophys. Res., 107, 8091, doi:10.1029/2001JD000522, 2002. Na, K., Sawant, A. A., Song, C., and Cocker III, D. R.: Primary and secondary carbonaceous
species in the atmosphere of Western Riverside County, California, Atmos. Environ., 38,
25
1345–1355, 2004.
Pertuisot, M. H.: Transfert du carbone atmosph ´erique dans les neiges et les pluies, Th `ese de doctorat de l’Universit ´e de Paris VII, 250, 1997.
Pankow, J. F.: An absorption model of gas/particle partitioning of organic compounds in the atmosphere, Atmos. Environ., 28, 185–188, 1994.
30
Pun, B. K., Wu, S. Y., Seigneur, C., Seinfeld, J. H., Griffin, R. J., and Pandis, S.: Uncer-tainties in modelling secondary organic aerosols: three-dimensional modeling studies in Nashville/Western Tennessee, Environ. Sci. Technol., 37, 3647–3661, 2003.
ACPD
5, 3999–4036, 2005Seasonal WSOC fraction of aerosol in
the French Alps J.-L. Jaffrezo et al. Title Page Abstract Introduction Conclusions References Tables Figures J I J I Back Close
Full Screen / Esc
Print Version Interactive Discussion
EGU
Ricard, V., Jaffrezo, J. L., Kerminen, V. M., Hillamo, R. E., Sillanpaa, M., Ruellan, S., Liousse, C., and Cachier, H.: Two years of continuous aerosol measurements in northern Finland, J. Geophys. Res., 107(D11), doi:10.1029/2001JD000952, 2002.
Ruellan, S. and Cachier, H.: Characterization of fresh particulate vehicular exhausts near a Paris high flow road, Atmos. Environ., 35, 453–468, 2001.
5
Saxena, P. and Hildemann, L.: Water-soluble organics in atmospheric particles: A critical review of the literature and application of thermodynamics to identify candidates compounds, J. Atmos. Chem., 24, 57–109, 1996.
Schauer, J. J., Kleeman, M. J., Cass, G. R., and Simoneit, B. R. T.: Measurement of emissions from air pollution sources. 3. C1-C29 organic compounds from fireplace combustion of wood,
10
Environ. Sci. Technol., 35, 1716–1728, 2001.
Sempere, R. and Kawamura, K.: Comparative contributions of dicarboxylics acids and related polar compounds in snow, rain and aerosols from urban atmosphere, Atmos. Environ., 28, 449–459, 1994.
Strader, R., Lurmann, F., and Pandis, S. N.: Evaluation of secondary organic aerosol formation
15
in winter, Atmos. Environ., 33, 4849–4863, 1999.
Sullivan, A. P., Weber, R. J., Clements, A. L., Turner, J. R., Bae, M. S., and Shauer, J. J.: A method for on-line measurements of water soluble organic carbon in ambi-ent aerosol particles: Results from an urban site, Geophys. Res. Lett., 31, L13105, doi:10.1029/2004GL019681, 2004.
20
Tsigaridis, K. and Kanakidou, M.: Global modelling of secondary organic aerosol in the tropo-sphere: a sensitivity analysis, Atmos. Chem. Phys., 3, 1849–1869, 2003,
SRef-ID: 1680-7324/acp/2003-3-1849.
Turpin, B. J.: Options for characterizing organic particulate matter: new research strategies could help elucidate the mechanisms and causes of aerosol health effects, Environ. Sci.
25
Technol., 33, 76A–79A, 1999.
Zappoli, S., Andracchio, A., Fuzzi, S., Facchini, M. C., Gelencs ´er, A., Kiss, G., Kriv ´acsy, Z., Moln ´ar, A., M ´esz ´aros, E., Hansson, H. C., Rosman, K., and Zeb ¨uhr, Y.: Inorganic, organic and macromolecular components of fine aerosol in different areas of Europe in relation to their water solubility, Atmos. Environ., 33, 2733–2743, 1999.
ACPD
5, 3999–4036, 2005Seasonal WSOC fraction of aerosol in
the French Alps J.-L. Jaffrezo et al. Title Page Abstract Introduction Conclusions References Tables Figures J I J I Back Close
Full Screen / Esc
Print Version Interactive Discussion
EGU Table 1. Sampling dates, and statistics on sampling at both sites.
Chamonix Saint Jean de Maurienne
Date start 21 Feb 01 10 Feb 01
Date stop 03 Jul 03 25 June 03
Number of days 862 864
Number of valid samples 785 798
% of valid samples 91.1 92.4
Number of field blanks 108 113
Number of EC/OC data 763 788
Number of WSOC data 104 277
ACPD
5, 3999–4036, 2005Seasonal WSOC fraction of aerosol in
the French Alps J.-L. Jaffrezo et al. Title Page Abstract Introduction Conclusions References Tables Figures J I J I Back Close
Full Screen / Esc
Print Version Interactive Discussion
EGU Table 2. Average detection limits and fraction of samples below detection limit for potassium
and the dicarboxylic acids measured in this study.
Detection limit % sples <dl % sples <dl (ng/m−3) (Chamonix) (Saint Jean)
Potassium K+ 12.0 6 0 Oxalate C2O2−4 2.4 0 0 Malonate CH2C2O 2− 4 <1 22 14 Succinate (CH2)2C2O2−4 <1 0 0 Glutarate (CH2)3C2O2−4 <1 8 13 Malate CH2CH(OH)C2O2−4 <1 14 6 Tartarate (CH(OH))2C2O2−4 <1 6 10
ACPD
5, 3999–4036, 2005Seasonal WSOC fraction of aerosol in
the French Alps J.-L. Jaffrezo et al. Title Page Abstract Introduction Conclusions References Tables Figures J I J I Back Close
Full Screen / Esc
Print Version Interactive Discussion
EGU Table 3. WSOC concentrations and mass fractions in the literature. N: number of samples.
WSOC fraction of OC, except when noted. References 1: Sempere and Kawamura (1994), 2: Zappoli et al. (1999), 3: Decesari et al. (2001), 4: Krivacsy et al. (2001), 5: Kiss et al. (2002), 6: Sullivan et al. (2004), 7: Ruellan and Cachier (2001), 8: this study, with winter as DJF, etc., *: continuous mesurements.
Site Dates N WSOC WSOC fraction Ref
(µg/m3) (%) Tokyo (urban) Winter 92 22 3.2–3.4 28–32% of TC
1 Summer 92 21.3–23.2 32–55% of TC Sweden (rural) June/July 96 5 1.7 77
K-Puszta (rural) July/August 96 5 2.4 48 2 Italy (urban) September 96 6 4.0 65
P ˆo Valley (rural) Jan/Feb 98 9 7.1 47
Mar/Apr 98 10 2.3 49
May/Sep 98 9 1.4 50
Oct/Nov 98 4 3.4 47 3
Oct/Feb 98-99 4 5.7 38
Mar/Avr 99 4 2.4 38
Jungfraujoch (altitude) Summer 98 8 0.63 60
4 K-Puszta (rural) Summer 98 22 4.8 63
K-Puszta (rural) Jan–Sept 00 42 2.0–8.25 66% of TC 5
St Louis (urban) June 03 * 2.87 64
Aug 03 2.40 61 6
Oct 03 1.33 31
Paris (kerb side) Aug–Oct. 97 4 4.4 12.4 7
Chamonix Winter 69 8.8±3.1 54.5±6.0
(urban) Summer 26 5.6±1.0 75.9±5.9
Saint Jean Winter 78 5.8±2.4 56.6±10.0 (urban bckgrnd) Spring 93 3.9±0.8 76.0±5.7 8
Summer 42 4.6±1.0 77.0±8.5 Fall 64 4.7±1.6 68.8±9.8
ACPD
5, 3999–4036, 2005Seasonal WSOC fraction of aerosol in
the French Alps J.-L. Jaffrezo et al. Title Page Abstract Introduction Conclusions References Tables Figures J I J I Back Close
Full Screen / Esc
Print Version Interactive Discussion
EGU Table 4. Values of the ratio OC/K+at the two sites.
OC/K+mean Standard deviation Median N Chamonix T<3◦C 108.3 43.2 94.7 202 T>3◦C 134.3 62.4 119.5 318 Saint Jean T<7◦C 48.1 25.2 41.6 246 T>7◦C 51.8 13.7 47.3 526
ACPD
5, 3999–4036, 2005Seasonal WSOC fraction of aerosol in
the French Alps J.-L. Jaffrezo et al. Title Page Abstract Introduction Conclusions References Tables Figures J I J I Back Close
Full Screen / Esc
Print Version Interactive Discussion
EGU Fig. 1. Sampling areas in the French Alps.
ACPD
5, 3999–4036, 2005Seasonal WSOC fraction of aerosol in
the French Alps J.-L. Jaffrezo et al. Title Page Abstract Introduction Conclusions References Tables Figures J I J I Back Close
Full Screen / Esc
Print Version Interactive Discussion EGU 0 20 40 60 80 100 120 140 0 1 2 3 4 % EC Filtration % EC Soaking % recovery nbr of water fractions n = 2 n = 6 n = 6 n = 2 n = 1 n = 3 n = 3 n = 1
Fig. 2. Recovery of EC after washing with filtration and soaking methods, according to the
number of water fractions (10 ml each) used for the washing. n is the number of duplicates and the error bar for each point represents ±1 standard deviation of the measurements.
ACPD
5, 3999–4036, 2005Seasonal WSOC fraction of aerosol in
the French Alps J.-L. Jaffrezo et al. Title Page Abstract Introduction Conclusions References Tables Figures J I J I Back Close
Full Screen / Esc
Print Version Interactive Discussion EGU 0 20 40 60 80 100 120 140 0 1 2 3 4 % OC Filtration % OC Soaking % recovery nbr of water fractions
Fig. 3. Recovery of OC after washing with filtration and soaking methods, according to the
number of water fractions (10 ml each) used for the washing. The number of duplicates is the same as for EC (Fig. 2) and the error bar for each point represents ±1 standard deviation of the measurements.
ACPD
5, 3999–4036, 2005Seasonal WSOC fraction of aerosol in
the French Alps J.-L. Jaffrezo et al. Title Page Abstract Introduction Conclusions References Tables Figures J I J I Back Close
Full Screen / Esc
Print Version Interactive Discussion EGU 0 6 12 18 -15 -10 -5 0 5 10 15 20 25 30 Saint Jean Chamonix µg/m3 T (°C)
ACPD
5, 3999–4036, 2005Seasonal WSOC fraction of aerosol in
the French Alps J.-L. Jaffrezo et al. Title Page Abstract Introduction Conclusions References Tables Figures J I J I Back Close
Full Screen / Esc
Print Version Interactive Discussion EGU 0 25 50 75 100
janv-01 juil-01 janv-02 juil-02 janv-03 juil-03
Chamonix Saint Jean %
ACPD
5, 3999–4036, 2005Seasonal WSOC fraction of aerosol in
the French Alps J.-L. Jaffrezo et al. Title Page Abstract Introduction Conclusions References Tables Figures J I J I Back Close
Full Screen / Esc
Print Version Interactive Discussion EGU 20 40 60 80 100 -15 -10 -5 0 5 10 15 20 25 30 Saint Jean Chamonix WSOC fraction (%) T (°C)
ACPD
5, 3999–4036, 2005Seasonal WSOC fraction of aerosol in
the French Alps J.-L. Jaffrezo et al. Title Page Abstract Introduction Conclusions References Tables Figures J I J I Back Close
Full Screen / Esc
Print Version Interactive Discussion EGU 0,0 0,2 0,4 0,6 0,8 1,0 1,2 -20 -10 0 10 20 30 Saint Jean Chamonix µg/m3 T (°C)
Fig. 7. Evolution of the sum of the concentrations of the dicarboxylic acids (DCA) measured,
ACPD
5, 3999–4036, 2005Seasonal WSOC fraction of aerosol in
the French Alps J.-L. Jaffrezo et al. Title Page Abstract Introduction Conclusions References Tables Figures J I J I Back Close
Full Screen / Esc
Print Version Interactive Discussion EGU 0 2 4 6 8 10 12 14 16 -15 -10 -5 0 5 10 15 20 25 30 Chamonix Saint Jean DCA / WSOC (%) T (°C)
ACPD
5, 3999–4036, 2005Seasonal WSOC fraction of aerosol in
the French Alps J.-L. Jaffrezo et al. Title Page Abstract Introduction Conclusions References Tables Figures J I J I Back Close
Full Screen / Esc
Print Version Interactive Discussion EGU y = 4,00x + 3,11 R2 = 0,60 y = 26,29x + 2,09 R2 = 0,56 0 5 10 15 0,0 0,3 0,6 0,9 1,2 T < 7 °C T > 7°C WSOC (µg/m3) DCA (µg/m3) Saint Jean
Fig. 9. Dicarboxylic acids and WSOC concentrations according to the temperature in Saint
ACPD
5, 3999–4036, 2005Seasonal WSOC fraction of aerosol in
the French Alps J.-L. Jaffrezo et al. Title Page Abstract Introduction Conclusions References Tables Figures J I J I Back Close
Full Screen / Esc
Print Version Interactive Discussion EGU y = 4,56x + 4,21 R2 = 0,46 y = 25,19x + 5,73 R2 = 0,25 0 6 12 18 0,0 0,3 0,6 0,9 T < 3°C T > 3°C DCA (µg/m3) WSOC (µg/m3) Chamonix
Fig. 10. Dicarboxylic acids and WSOC concentrations according to the temperature in
ACPD
5, 3999–4036, 2005Seasonal WSOC fraction of aerosol in
the French Alps J.-L. Jaffrezo et al. Title Page Abstract Introduction Conclusions References Tables Figures J I J I Back Close
Full Screen / Esc
Print Version Interactive Discussion EGU St Jean y = 16,2x + 3,7 R2 = 0,62 Chx y = 62,3x + 3,5 R2 = 0,81 0 10 20 30 40 0,0 0,2 0,4 0,6 0,8 1,0 1,2 1,4 1,6 OC (µg/m3) K+ (µg/m3) 130701 311201 010103 140701