HAL Id: hal-00328216
https://hal.archives-ouvertes.fr/hal-00328216
Submitted on 19 Jul 2007HAL is a multi-disciplinary open access
archive for the deposit and dissemination of sci-entific research documents, whether they are pub-lished or not. The documents may come from teaching and research institutions in France or abroad, or from public or private research centers.
L’archive ouverte pluridisciplinaire HAL, est destinée au dépôt et à la diffusion de documents scientifiques de niveau recherche, publiés ou non, émanant des établissements d’enseignement et de recherche français ou étrangers, des laboratoires publics ou privés.
Small-scale mixing processes enhancing
troposphere-to-stratosphere transport by
pyro-cumulonimbus storms
G. Luderer, J. Trentmann, K. Hungershöfer, M. Herzog, M. Fromm, M. O.
Andreae
To cite this version:
G. Luderer, J. Trentmann, K. Hungershöfer, M. Herzog, M. Fromm, et al.. Small-scale mixing pro-cesses enhancing troposphere-to-stratosphere transport by pyro-cumulonimbus storms. Atmospheric Chemistry and Physics Discussions, European Geosciences Union, 2007, 7 (4), pp.10371-10403. �hal-00328216�
ACPD
7, 10371–10403, 2007 Small-scale processes enhancing TST by pyroCb storms G. Luderer et al. Title Page Abstract Introduction Conclusions References Tables Figures ◭ ◮ ◭ ◮ Back CloseFull Screen / Esc
Printer-friendly Version
Interactive Discussion Atmos. Chem. Phys. Discuss., 7, 10371–10403, 2007
www.atmos-chem-phys-discuss.net/7/10371/2007/ © Author(s) 2007. This work is licensed
under a Creative Commons License.
Atmospheric Chemistry and Physics Discussions
Small-scale mixing processes enhancing
troposphere-to-stratosphere transport by
pyro-cumulonimbus storms
G. Luderer1, J. Trentmann2, K. Hungersh ¨ofer3, M. Herzog4, M. Fromm5, and M. O. Andreae1
1
Max Planck Institute for Chemistry, Dept. Biogeochemistry, Mainz, Germany
2
Institute for Atmospheric Physics, Johannes Gutenberg University Mainz, Mainz, Germany
3
Institute for Meteorology, University of Leipzig, Leipzig, Germany. Current affiliation: LISA, CNRS/Univ. Paris 7&12, Cr ´eteil, France
4
NOAA GFDL, Princeton, New Jersey, USA
5
Naval Research Laboratory, Washington DC, USA
Received: 5 July 2007 – Accepted: 16 July 2007 – Published: 19 July 2007 Correspondence to: G. Luderer ([email protected])
ACPD
7, 10371–10403, 2007 Small-scale processes enhancing TST by pyroCb storms G. Luderer et al. Title Page Abstract Introduction Conclusions References Tables Figures ◭ ◮ ◭ ◮ Back CloseFull Screen / Esc
Printer-friendly Version
Interactive Discussion
Abstract
Deep convection induced by large forest fires is an efficient mechanism for transport of aerosol particles and trace gases into the upper troposphere and lower stratosphere (UT/LS). For many pyro-cumulonimbus clouds (pyroCbs) as well as other cases of severe convection without fire forcing, radiometric observations of cloud tops in the 5
thermal infrared (IR) reveal characteristic structures, featuring a region of relatively high brightness temperatures (warm center) surrounded by a U-shaped region of low brightness temperatures.
We performed a numerical simulation of a specific case study of pyroCb using a non-hydrostatic cloud resolving model with a two-moment cloud microphysics param-10
eterization and a prognostic turbulence scheme. The model is able to reproduce the thermal IR structure as observed from satellite radiometry. Our findings establish a close link between the observed temperature pattern and small-scale mixing processes atop and downwind of the overshooting dome of the pyroCb. Such small-scale mixing processes are strongly enhanced by the formation and breaking of a stationary gravity 15
wave induced by the overshoot. They are found to enhance the stratospheric pene-tration of the smoke by up to 30 K and thus are of major significance for irreversible transport of forest fire smoke into the lower stratosphere.
1 Introduction
Deep convection induced by large forest fires is a highly efficient mechanism for the 20
vertical transport of gaseous and particulate fire emissions. As documented by sev-eral both observational and modeling studies, in its most extreme form, so called pyro-Cumulonimbus (pyroCb) convection, this process can result in direct injection of substantial amounts of smoke as high as into the lower stratosphere (Fromm and
Servranckx,2003;Fromm et al.,2005;Rosenfeld et al.,2007;Trentmann et al.,2006; 25
ACPD
7, 10371–10403, 2007 Small-scale processes enhancing TST by pyroCb storms G. Luderer et al. Title Page Abstract Introduction Conclusions References Tables Figures ◭ ◮ ◭ ◮ Back CloseFull Screen / Esc
Printer-friendly Version
Interactive Discussion processes, the lifetime of many tracers, such as aerosol particles and NOy, is greater
in the lower stratosphere than in the troposphere. The injection of biomass smoke therefore results in a substantial perturbation of the chemical composition and the ra-diative balance of the upper troposphere and lower stratosphere (UT/LS) region, with potentially far reaching consequences for atmospheric chemistry and even climate. 5
The Chisholm fire is one of the largest forest fires ever observed; it has been scien-tifically documented and thoroughly analysed in terms of its fire characteristics (ASRD,
2001; Fromm and Servranckx, 2003) as well as its atmospheric impact (Fromm and
Servranckx,2003;Trentmann et al.,2006;Luderer et al.,2006;Rosenfeld et al.,2007). Here, it serves as a case study for the assessment of the structure of overshooting 10
cloud tops.
This study links two important aspects of intensive deep convection: The occurrence of characteristic cloud top temperature patterns that are regularly associated with py-roCbs and other intensive thunderstorms (cold U with an enclosed warm center, see below), and the role of small-scale mixing processes at the cloud top in troposphere-15
to-stratosphere transport (TST).
Understanding and quantification of TST from mid-latitude deep convection is not only important for pyroCbs, but also for intensive regular thunderstorms. Even though mid-latitude deep convection accounts for only a small fraction of the air masses in the lowermost extra-tropical stratosphere (Holton et al.,1995), this process is very impor-20
tant for the budgets of many trace species in the lower stratosphere, most notably water vapor as well as some short-lived species (Mullendore et al.,2005). This is due to the rapid and direct transport from the planetary boundary layer, where most tracers have their sources. Several studies, e.g.,Fischer et al. (2003), Ray et al.(2004), Hanisco
et al. (2007) andPittman et al.(2007), report direct observational evidence for the in-25
fluence of water vapor and tracers into the lower stratosphere due to deep convection at high- and mid-latitudes. Numerical studies using cloud resolving models have in-vestigated the characteristics of TST induced by deep convection.Wang(2003,2007) identified gravity wave formation and breaking atop convective thunderstorm clouds as
ACPD
7, 10371–10403, 2007 Small-scale processes enhancing TST by pyroCb storms G. Luderer et al. Title Page Abstract Introduction Conclusions References Tables Figures ◭ ◮ ◭ ◮ Back CloseFull Screen / Esc
Printer-friendly Version
Interactive Discussion an important process for the injection of moisture plumes into the lower stratosphere.
Lane et al.(2003) andLane and Sharman (2006) found that the breakdown of grav-ity waves generated by thunderstorms is an important source of turbulence above the cloud and at tropopause level.Mullendore et al.(2005) assessed the vertical transport of idealized passive tracers by deep convection and found that, in addition to latent 5
heating, mixing processes contribute significantly to potential temperature increases necessary for irreversible TST.
When observed from space, many pyroCbs, as well as intense regular thunderstorm clouds, feature a distinct cloud top temperature pattern. Due to its structure with a warm center surrounded by a U-shaped cold region, this feature will hereafter be referred to 10
as the “cold U/warm center”. Typically, cold U brightness temperatures are lower than the tropopause minimum, while the temperatures in the warm center are higher than the temperatures of ambient air at the cloud top altitude. Observations of such thermal structures have been reported repeatedly in the literature (e.g.,Heymsfield et al.,1983;
Heymsfield and Blackmer, Jr.,1988;Levizzani and Setv ´ak,1996;Setv ´ak et al.,2007; 15
Rosenfeld et al.,2007).
Most of these studies agree that the cold U region is due to exposure of air masses that have cooled while ascending adiabatically beyond their level of neutral buoyancy (e.g.,Heymsfield and Blackmer, Jr.,1988;Rosenfeld et al.,2007). There is, however, substantial uncertainty about the cause of the warm center. In a recent study based on 20
analysis of brightness temperatures at various wavelengths,Setv ´ak et al.(2007) found that, for some storms, moisture plumes above the anvil level reach equilibrium with high stratospheric temperatures and mask the colder temperatures of the underlying cloud tops, thus giving rise to the observed warm center. Other studies suggested effects related to variations in radiative properties of cloud hydrometeors at the cloud top, with 25
optically less opaque hydrometeors in the center allowing IR radiometers to see further down to a lower, hence warmer level of effective emission (Heymsfield et al., 1983). In this paper, we will demonstrate that both observations and simulations suggest that neither moisture masking nor effects related to the hydrometeors’ radiative properties
ACPD
7, 10371–10403, 2007 Small-scale processes enhancing TST by pyroCb storms G. Luderer et al. Title Page Abstract Introduction Conclusions References Tables Figures ◭ ◮ ◭ ◮ Back CloseFull Screen / Esc
Printer-friendly Version
Interactive Discussion were relevant in our case study. The analysis ofRosenfeld et al.(2007) showed that the
emissivity in the core is close to unity and does not show any inferred change of particle size in the warm center. Based on these observational results, and the simulation of the Chisholm pyroCb presented here, we infer that the warm center originated from subsidence and mixing of stratospheric air masses induced by gravity wave activity. 5
This explanation is in good agreement with those proposed in earlier studies byAdler
and Mack (1986) andSchlesinger(1984).
This paper is structured as follows: In the next section, observations of the Chisholm pyroCb are presented. In Section 3, the Active Tracer High Resolution Atmospheric Model (ATHAM) and the model setup used for this study are described. Section 4 10
presents an analysis of the cloud top structure based on the model results. Discussions and conclusions are presented in Section 5.
2 Observations
The Chisholm fire serves as a case study for this paper. In terms of its atmospheric impacts, the Chisholm fire is the largest boreal forest fire ever to be scientifically docu-15
mented. Its fire characteristics were thoroughly documented by the Alberta Sustainable Resource Development agency. According to the post-burn assessment presented in
ASRD (2001), the Chisholm Fire burned an area of 50 000 ha in the time of its most intensive activity between 17:00 and 24:00 local time on 28 May 2001 alone. The fire intensity was up to 239 000 kW m−1(Trentmann et al.,2006;ASRD,2001). The severe
20
intensification of the fire-induced convection was observed to coincide with the passage of a synoptic cold front. As documented by numerous satellite and ground based ob-servations, it injected substantial amounts of smoke into the lower stratosphere, which persisted for several months and resulted in a significant enhancement of the lower
ACPD
7, 10371–10403, 2007 Small-scale processes enhancing TST by pyroCb storms G. Luderer et al. Title Page Abstract Introduction Conclusions References Tables Figures ◭ ◮ ◭ ◮ Back CloseFull Screen / Esc
Printer-friendly Version
Interactive Discussion stratospheric aerosol loading on a hemispheric scale (Fromm et al., 2007a1; Fromm
et al., 2007b2). Rosenfeld et al.(2007) analyzed the structure, precipitation and light-ning activity of the pyroCb based on satellite and RADAR data and found that the convection reached an altitude of about 13.5 km. In an earlier modeling study,
Trent-mann et al. (2006) and Luderer et al. (2006) reproduced the observed structure of 5
the Chisholm pyroCb, and assessed its sensitivity to fire activity and meteorological background conditions. It was found that the main driving forces for the vertical devel-opment of the convection and subsequent TST of smoke were the release of sensible heat from the fire and the background meteorological conditions, while the release of latent heat in the form of water vapor and the presence of aerosol particles acting as 10
cloud condensation nuclei was of much lesser importance.
Not only the stratospheric aerosol plume produced by the Chisholm fire, but also the pyroCb convection itself was well captured by satellite observations (Fromm and
Servranckx,2003;Rosenfeld et al.,2007). Fortuitously, a NOAA Advanced Very High Resolution Radiometer (AVHRR) overpass occurred at 02:20 UTC during the mature 15
phase of the pyroCb convection. The anvil of the pyroCb is clearly visible in both the 0.65 µm channel (Fig.1a) and the thermal IR at 10.8 µm (Fig.1b).
The fire was located between approximately 55.0◦N and 55.2◦N at 114.3◦W, below
the southern edge of the pyroCb anvil. Due to strong southerly winds associated with the passing cold front, the convection cell was tilted to the north and the anvil spread 20
to northward directions. The areas of maximum reflectance and the shadows cast in the 0.65 µm give a good indication of the location of the overshooting dome.
The cloud top temperatures of the pyroCb are much lower than those of the sur-rounding clouds that were not affected by the fire, showing that the fire induced con-vection reached much higher than ambient concon-vection. As is the case for a number 25
1
Fromm, M., Torres, O., Diner, D., et al.: The stratospheric impact of the Chisholm Pyro-Cumulonimbus eruption: nadir satellite perspective, J. Geophys. Res., submitted, 2007a.
2
Fromm, M., Shettle, E., Fricke, K. H., et al.: The stratospheric impact of the Chisholm Pyro-Cumulonimbus eruption: vertical profile perspective, J. Geophys. Res., submitted, 2007b.
ACPD
7, 10371–10403, 2007 Small-scale processes enhancing TST by pyroCb storms G. Luderer et al. Title Page Abstract Introduction Conclusions References Tables Figures ◭ ◮ ◭ ◮ Back CloseFull Screen / Esc
Printer-friendly Version
Interactive Discussion of other pyroCbs, the Chisholm pyroCb features a distinct pattern when observed from
space with a thermal IR radiometer. While most of the anvil region is characterized by brightness temperatures of about −61◦
C to −59◦C, corresponding to the tropopause
cold point temperature level, a region with brightness temperatures that exceed those in the other parts of the anvil by 5–10 K is evident at the center of the pyroCb’s top. 5
This warm center structure is located above and downwind of the overshooting dome. In the upwind direction, the warm center is surrounded by an arch-shaped area of very cold temperatures. The background temperature profile at the time and location of the pyroCb convection was obtained from the radiosonde observations recorded at 00:00 UTC at Edmonton (Fig.2), at about 200 km distance and shortly before the time 10
of the convective blow-up of the pyroCb. The cloud top temperature structure is very remarkable since the coldest temperature of −66◦C is much colder than the tropopause
cold point. Conversely, the warmest areas are warmer than −52◦C. According to this
sounding, temperatures were −53.7◦C or lower throughout the lower stratosphere. The
observed temperature maximum can therefore not be explained by the overshooting 15
into warm areas of the lower stratosphere alone.
According to Inoue (1987), the actual cloud top temperature nearly equals the cloud top thermal temperature if the difference between the brightness temperatures recorded at 10.8 µm and 12.0 µm is within a fraction of a degree. Since the brightness temperature difference is near zero throughout the center of the Chisholm pyroCb’s 20
cloud top (Rosenfeld et al.,2007), we conclude that the observed brightness tempera-ture pattern is representative of the actual temperatempera-ture structempera-ture at the cloud top.
The cold U/warm center structure of the Chisholm pyroCb was also captured by the Defense Meteorological Satellite Program (Rene Servranckx, personal communi-cation, 2005) and shows up as a persistent feature in the GOES geostationary satellite 25
imagery (Fromm et al., 2007a1). Similar cloud top brightness temperature patterns were also observed for other pyroCbs (Fromm et al.,2005) as well as regular thunder-storms (see Introduction), indicating that these are characteristic features of intensive convection.
ACPD
7, 10371–10403, 2007 Small-scale processes enhancing TST by pyroCb storms G. Luderer et al. Title Page Abstract Introduction Conclusions References Tables Figures ◭ ◮ ◭ ◮ Back CloseFull Screen / Esc
Printer-friendly Version
Interactive Discussion
3 The Active Tracer High Resolution Atmospheric Model (ATHAM)
The numerical simulations presented here were performed with the Active Tracer High resolution Atmospheric Model (ATHAM), a non-hydrostatic cloud-resolving model originally designed for the simulation of the extreme dynamical conditions present in plumes. In earlier studies, ATHAM was employed to investigate volcanic eruptions 5
(e.g.,Oberhuber et al.,1998;Herzog et al.,1998;Graf et al.,1999;Textor et al.,2003) and wildfire induced convection (Trentmann et al.,2002,2006;Luderer et al.,2006).
The dynamical core of ATHAM is such that it fully accounts for the effects of all trac-ers such as hydrometeors, aerosols and gaseous components on heat capacity and density. The feedback of liquid and frozen cloud particles on the convection dynam-10
ics is therefore explicitly represented. The Euler equation is solved for a gas-particle mixture under the assumption of zero net fluxes between its constituents for momen-tum and heat. The volume mean momenmomen-tum is conserved. The tracer advection is formulated in mass-conserving form.
For realistic simulation of entrainment of environmental air into the the plume, as well 15
as detrainment and mixing of smoke at the cloud top, subgrid scale turbulence is pa-rameterized using a modified TKE scheme. In this approach, turbulent kinetic energy (TKE) is a prognostic variable from which the horizontal and vertical turbulent exchange coefficients are derived (Herzog et al.,2003). Cloud microphysical processes are rep-resented using a two-moment microphysical scheme (Textor et al., 2006a,b). There 20
are four hydrometeor classes, namely, cloud droplets (small, liquid), rain drops (large, liquid), ice crystals (small, frozen), and graupel (large, frozen), for each of which mass concentrations and number densities are predicted. A total of 13 processes transferring water between the four hydrometeor classes and the vapor phase are considered.
The model setup is identical to that used inTrentmann et al.(2006) andLuderer et al.
25
(2006). The fire forcing is assumed to be constant during the simulation and is repre-sented as a rectangular front of 15 000 m length and 500 m width. The model domain is 85 km in the direction along the fire front and 65 km across, with the upper boundary
ACPD
7, 10371–10403, 2007 Small-scale processes enhancing TST by pyroCb storms G. Luderer et al. Title Page Abstract Introduction Conclusions References Tables Figures ◭ ◮ ◭ ◮ Back CloseFull Screen / Esc
Printer-friendly Version
Interactive Discussion at 26 km. The number of grid points used is 110×85 in the x- and y-directions and 100
in the z-direction. We used a focusing grid with maximum resolution at the fire and its vicinity, where the gradients of tracer concentrations and temperature are largest. To-wards the edges of the model domain, the grid spacing is larger. In the horizontal, the minimum grid spacing was set to 100 m perpendicular to the fire front and 500 m along 5
the front. In the vertical, we used two regions of enhanced spatial resolution: the grid spacing was 50 m at the ground and, for more accurate simulation of troposphere-to-stratosphere transport, 150 m at the tropopause. In the mid-troposphere, the maximum vertical spacing was 300 m.
The fire was assumed to consume 9 kg m−2 of fuel at a rate of spread of 1.5 m s−1.
10
In this simulation run we assumed that 100% of the fire energy goes into the heating of the atmospheric layer over the fire, i.e., radiative losses were assumed to be zero. A fuel moisture value of 40% based on dry fuel mass was assumed. This yields a fire intensity, i.e., sensible heat release per unit fire front length, of 239×106W m−1, and a
moisture release of 12.2 kg m−1s−1. For the aerosol emissions, we used an emission
15
factor for total particulate matter (TPM) of 17.6 gTPMkg−1fuel (Andreae and Merlet,2001)
and assumed, for the particles, a volume mean diameter of 0.2 µm, which is consistent withReid et al.(2005).
Background meteorology was adopted from radiosonde observations that were per-formed at Edmonton (53.5◦N, 114.1◦W), located about 200 km south of the fire
loca-20
tion, at 00:00 UTC, shortly before the time of the blow-up (Fig.2). This sounding is likely to closely match the meteorological background condition for the Chisholm pyroCb. Based on ECMWF reanalysis data, the dynamical tropopause (defined as the 2 PVU potential vorticity level) was located at a potential temperature of 332 K, corresponding to an altitude of 11.2 km. Here, we opted to use the tropopause definition in terms of 25
potential vorticity (PV) since it is most meaningful in terms of troposphere-stratosphere exchange at mid-latitudes. Since the PV isosurfaces become strongly disturbed during the active convection, we use the 332 K isentrope of potential temperature to calculate the TST from the model simulation.
ACPD
7, 10371–10403, 2007 Small-scale processes enhancing TST by pyroCb storms G. Luderer et al. Title Page Abstract Introduction Conclusions References Tables Figures ◭ ◮ ◭ ◮ Back CloseFull Screen / Esc
Printer-friendly Version
Interactive Discussion Given the complicated three-dimensional structure of the pyroCb, the interaction of
its dynamics with incident solar and thermal radiation from the fire are highly com-plex. Interactive broadband three-dimensional simulation of radiation is computation-ally much too expensive for simulations with cloud-resolving models such as ATHAM. Therefore, the following assumptions were made. Since most of the radiative energy 5
from the fire is absorbed by the pyro-cloud, we assumed that the entire fire energy becomes available for the convection. This is consistent with the finding presented in
Luderer et al.(2006) that the observed structure of the pyroCb can only be reproduced, if the radiative loss is small compared to the fire energy release. Moreover, effects of solar heating were assumed to be negligible. While it likely contributed substantially to 10
the lofting of the stratospheric aerosol plume during the days after the Chisholm fire, solar heating is of low significance for the convective time scales of less than one hour and the large solar zenith angles during the convective phase considered here.
In order to compare the simulations with satellite observations of brightness tem-perature, an offline-simulation of the radiative properties of the pyroCb was performed 15
using a one-dimensional, broadband, δ-four-stream radiative transfer model (Fu and
Liou, 1993; Hungersh ¨ofer, 2007). At each vertical column of the ATHAM grid, an independent-column calculation was performed. Up to an altitude of 26 km, the ver-tical model layers were adopted from ATHAM. For the remaining part up to the top of the atmosphere at 80 km, data for a standard mid-latitude summer atmosphere (
Ander-20
son et al.,1986) were applied. In total, this resulted in 129 horizontally homogenous layers with a thickness varying from 50 m near the surface to 10 km in the mesosphere. The brightness temperature was determined from the upward-directed flux density at the top of the atmosphere for the wavelength band from 10.2 µm to 12.5 µm. In this atmospheric window region, only the absorption of water vapor and the effect of the 25
hydrometers had to be taken into account. To determine the optical properties of the four hydrometeor classes, pre-calculated values were scaled with the respective mass concentrations simulated with the ATHAM model. In case of the water droplets, a con-stant effective radius of 5 µm was assumed. For ice crystals, a plate-like structure with
ACPD
7, 10371–10403, 2007 Small-scale processes enhancing TST by pyroCb storms G. Luderer et al. Title Page Abstract Introduction Conclusions References Tables Figures ◭ ◮ ◭ ◮ Back CloseFull Screen / Esc
Printer-friendly Version
Interactive Discussion an effective size of 25 µm was applied, which roughly corresponds to an effective
ra-dius of about 10 µm as obtained in the retrieval byRosenfeld et al. (2007). Aerosol optical properties were considered as well, but their influence was found to be small in the wavelength region considered.
4 Model results
5
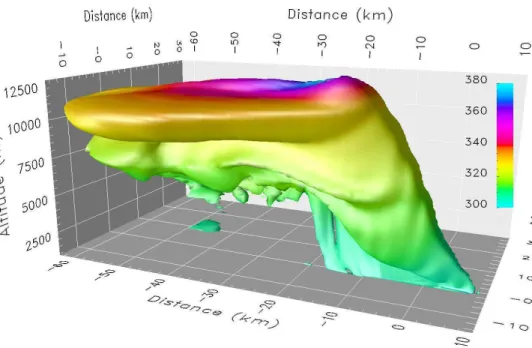
Two- and three-dimensional visualizations of the modeled smoke plume are provided in Figs.3and4. Figure3depicts the 50 µg m−3isosurface of aerosol mass concentration
color coded with potential temperature θ. In the coordinate frame used for the simu-lations, the x-direction is aligned with the fire front orientation and is therefore rotated with respect to north by 165◦
. The overshooting cloud top is centered at x =15 km, 10
y =−5 km and reaches to a maximum altitude of about 13 000 m. At this altitude level, background winds were blowing from south-south-west, at an angle of about 25◦to the
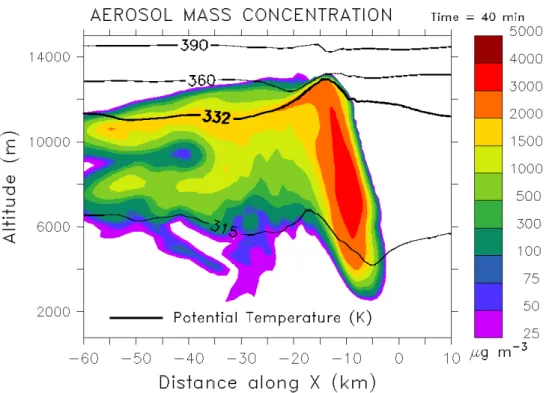
x-axis. In order to optimally capture the overshooting cloud top and its substructure, the vertical 2d cross sections presented here were prepared along the y =−5 km line. The vertical cross section of the aerosol mass distribution depicted in Fig.4shows that the 15
plume reached a peak altitude of 13 km, well above the tropopause, which was located at 11.2 km. The maximum potential temperature at the cloud top was approximately 360 K.
4.1 Simulated radiative and thermal structure of the cloud top
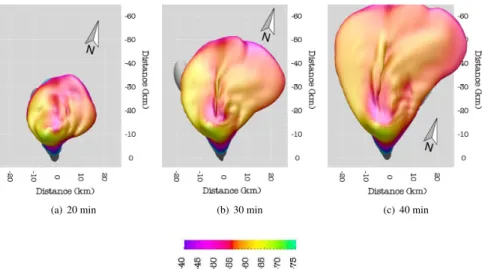
Top views of the modeled smoke cloud at three different times are given in Fig.5. The 20
pyroCb is represented by the 0.5 g kg−1hydrometeor concentration isosurface and has
been color-coded with the temperature field on this isosurface, thus showing the “skin temperature” of the cloud top. Similar to the satellite observations, the thermal structure of the cloud top features a warm center partially surrounded by an arch-shaped region of cold temperatures.
ACPD
7, 10371–10403, 2007 Small-scale processes enhancing TST by pyroCb storms G. Luderer et al. Title Page Abstract Introduction Conclusions References Tables Figures ◭ ◮ ◭ ◮ Back CloseFull Screen / Esc
Printer-friendly Version
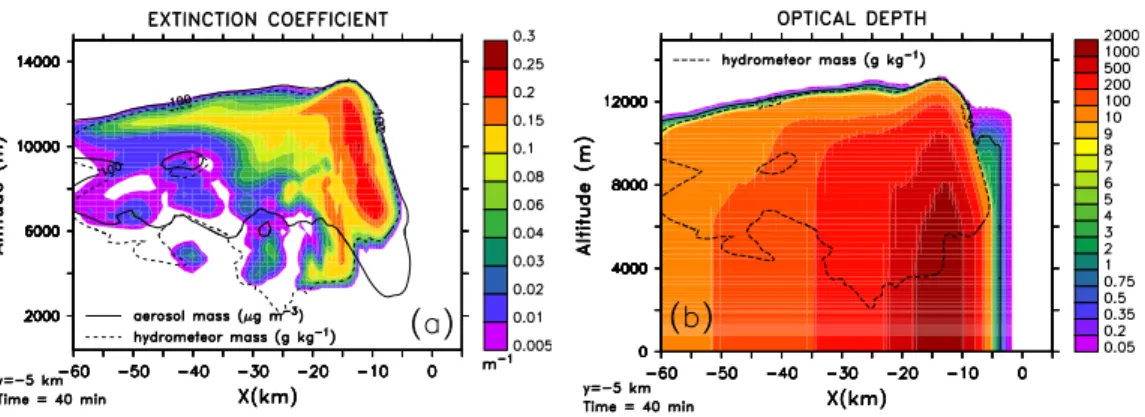
Interactive Discussion Fig. 6 shows results from offline calculations of the pyroCb’s radiative properties
after 40 min simulation time. Figure 6a presents the extinction coefficient resulting from aerosols and hydrometeors in the AVHRR 10.8 µm wavelength channel. At this wavelength, scattering is much less significant than absorption, and the extinction is dominated by hydrometeors. The extinction coefficient is highly variable throughout 5
the pyroCb, with maximum values of 0.25 m−1in the non-frozen part of the updraft, and
more moderate extinction at the cloud top and the anvil. Figure6b depicts the total optical depth relative to the top of the atmosphere. The τ=1 contour can be used to estimate the effective thermal emission level (e.g.,Thomas and Stamnes,1999). Even though the aerosol and hydrometeor extinction is small at the cloud top compared 10
to the pyroCb center, the τ=1 level is located very close to the cloud top, indicating that the temperature structure observed by the satellite radiometer is representative of the conditions at the cloud top. This explains the close agreement between mod-eled brightness temperature (Fig.7) and modeled in situ “skin temperature” (Fig.5c). As discussed in Sect.2, the observations also support the conclusion that the cloud 15
was optically thick in the thermal IR. Hence the occurrence of the cold U/warm center structure must have been due to dynamic effects at the cloud top rather than radiative effects.
The simulated cloud top brightness temperature structure (Fig.7) is in good agree-ment with the observations. When viewed from above, the warm center is located at 20
the downwind side of the overshooting dome, while the minimum cloud top tempera-tures are found on the upwind side of the overshoot. For most of the anvil, brightness temperatures are in the −56 to −59◦C range, roughly in equilibrium with the tropopause
temperature level at this altitude. These brightness temperatures are slightly warmer, by 2–3 K, than in the observations, but are consistent with the uncertainty in the back-25
ground temperature profile and the anvil altitude, which might have been slightly under-estimated by our ATHAM simulations. The maximum cloud top brightness temperature in the warm center is −48◦
C, substantially warmer than the −58◦C of the ambient air
ACPD
7, 10371–10403, 2007 Small-scale processes enhancing TST by pyroCb storms G. Luderer et al. Title Page Abstract Introduction Conclusions References Tables Figures ◭ ◮ ◭ ◮ Back CloseFull Screen / Esc
Printer-friendly Version
Interactive Discussion region are close to −65◦C, about 5◦C colder than the tropopause cold point. The
differ-ence of 17◦C between the simulated maximum and minimum cloud top temperatures is
in good agreement with the AVHRR brightness temperature field, where a difference of 15◦C between the warm center and the cold U was recorded (see Sect.2and Fig.1b).
4.2 Gravity wave formation 5
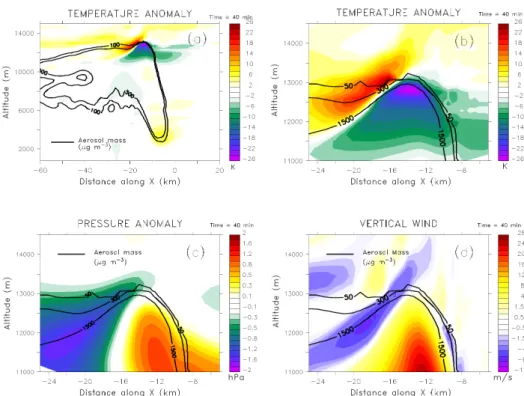
Vertical cross sections through the pyroCb reveal the physical reason for the observed cloud top temperature structure. Figures8a, b depict the temperature anomaly, i.e., the difference between in-situ temperature within the pyro-cloud and the background tem-perature at the corresponding altitude level on the vertical plane parallel to the fire front at y =−5 km. It shows a distinct bipolar temperature structure, featuring a strong neg-10
ative temperature anomaly within the pyroCbs overshooting dome, accompanied by a strong positive temperature anomaly above and downwind (Fig.8b). A similar bipolar structure is also found in the pressure anomaly and vertical wind fields, indicating a stationary gravity wave induced by the overshoot: The cold overshooting air masses are negatively buoyant and tend to sink as they are advected downwind, thereby cre-15
ating a negative pressure anomaly on the downwind side of the overshoot (Fig. 8c). In turn, this negative pressure anomaly induces downward motion of airmasses from above the cloud top (Fig.8d). Due to adiabatic heating, this process gives rise to the strong positive temperature anomaly above and downwind of the overshooting dome.
The gravity wave also shows up prominently as a strong perturbation in the potential 20
temperature field (Fig. 9g). The air masses in the warm area right above the cloud top feature θ-values of up to 380 K, indicating that these airmasses originate from an altitude level of 13 600 m, having descended as much as 600 m.
4.3 Cross-isentrope transport due to small-scale mixing
The gravity wave induced by the overshooting cloud top enhances the cross-isentrope 25
ACPD
7, 10371–10403, 2007 Small-scale processes enhancing TST by pyroCb storms G. Luderer et al. Title Page Abstract Introduction Conclusions References Tables Figures ◭ ◮ ◭ ◮ Back CloseFull Screen / Esc
Printer-friendly Version
Interactive Discussion proximity of the pyroCb’s overshooting dome, with its strong negative temperature
anomaly, to a region of air masses with stratospheric origin and positive temperature anomaly above and downwind of the dome results in very large gradients of potential temperature and trace gas concentration directly atop of the overshooting dome. Sec-ond, gravity wave breaking generates additional turbulence, thereby greatly enhancing 5
the mixing efficiency.
Figure 9 depicts vertical cross sections through the fields of potential temperature (a, c, e, g) and of the vertical turbulent exchange coefficient, as simulated by ATHAM’s turbulence scheme (b, d, f, h) for four points in time. During the first 20 min of the devel-opment of the pyroCb, the air masses in the cloud are highly turbulent, with maximum 10
values of the vertical turbulent exchange coefficient of up to 1500 m2s−1 at the center
of the updraft. The strong gradient of potential temperature above the overshooting dome, i.e., a very stable stratification, acts as a sink for turbulent kinetic energy. There-fore, the turbulent exchange coefficient strongly decreases at the cloud top.
After about 30 min of simulation time, the gravity wave becomes unstable due to 15
the vertical wind shear at the tropopause level. Downwind of the overshooting dome, air masses with high potential temperature are transported below potentially colder air masses, resulting in gravity wave breaking (Fig.9e). Such gravity wave breaking is a highly efficient mechanism for the generation of turbulence (Fig.9f). It is evident from the potential temperature and turbulence fields after 40 min (Figs.9g, h) that the advec-20
tion of gravity-wave generated turbulence along the cloud top results in very efficient mixing of smoke laden air masses of the pyro-cloud with potentially warm air masses of stratospheric origin.
As discussed in Sect. 4.2, such cloud top mixing of potentially warm stratospheric air with smoke and hydrometeor enriched pyroCb air gives rise to the warm center 25
structure as observed in the thermal satellite imagery. This establishes a direct link between the thermal structure and TST above deep convection, hence the cold U/warm center feature as derived from satellite could serve as an indicator for the occurrence of TST above deep convection.
ACPD
7, 10371–10403, 2007 Small-scale processes enhancing TST by pyroCb storms G. Luderer et al. Title Page Abstract Introduction Conclusions References Tables Figures ◭ ◮ ◭ ◮ Back CloseFull Screen / Esc
Printer-friendly Version
Interactive Discussion 4.4 Troposphere-to-stratosphere transport
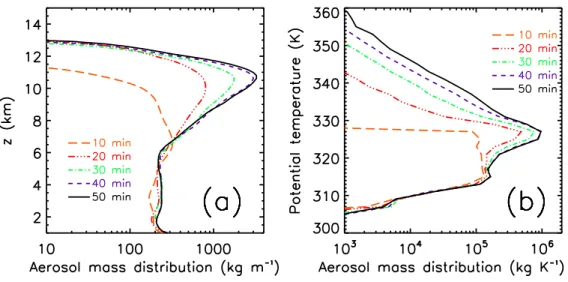
In order to assess troposphere-to-stratosphere transport (TST) of smoke tracers, it is instructive to consider vertical tracer distributions both as a function of altitude, and as a function of potential temperature. The temporal evolution of such vertical aerosol distributions is given in Fig.10.
5
The most notable feature of this analysis is the fact that the maximum penetration altitude is already reached after 20 min, whereas the aerosol distribution as a func-tion of potential temperature continues to progress to higher values as the simulafunc-tion advances in time.
As shown in Fig.10a, the maximum penetration height is approximately 13 000 m. 10
The main outflow height of the smoke is at 10 500 m, giving rise to a peak in the vertical aerosol mass distribution at this level. Over the course of the simulation, due to the continuing convective vertical transport of smoke, increasing amounts of aerosol mass become injected and the layers above 7000 m become increasingly enriched in aerosol mass. The maximum penetration height, however, remains almost unchanged once 15
the 13 000 m level is reached after about 20 min, i.e., the strong inversion in the lower stratosphere inhibits further vertical ascent of the air parcels in the overshoot to higher altitude levels.
In terms of TST, however, the aerosol distribution as a function of potential temper-ature θ is more meaningful (Fig. 10b). In order to mask out the high temperatures 20
directly above the fire, only smoke parcels above an altitude of 5000 m were consid-ered for the analysis presented here. At this level, the sensible heat from the fire is sufficiently diluted, so that the high potential temperature tail of the aerosol distribution represents smoke located in the tropopause region only. In contrast to the maximum penetration altitudes, the maximum θ-values reached by the aerosol plume continue to 25
rise to higher levels: The aerosol density exceeds 1000 kg K−1 up to a potential
tem-perature level of 342 K after 20 min, 350 K after 30 min, 354 K after 40 min and 359 K after 50 min.
ACPD
7, 10371–10403, 2007 Small-scale processes enhancing TST by pyroCb storms G. Luderer et al. Title Page Abstract Introduction Conclusions References Tables Figures ◭ ◮ ◭ ◮ Back CloseFull Screen / Esc
Printer-friendly Version
Interactive Discussion The continuous increase in maximum potential temperature without an increase in
maximum altitude strongly supports the finding that, in addition to convective advection, other driving forces are responsible for the cross-tropopause transport at the cloud top. We can assess the relative importance of turbulent mixing by considering the energy balance of an individual air parcel.
5
The difference in potential temperature between the boundary layer and the lower stratosphere is typically of the order of several tens of K. According to traditional parcel theory, the most important heat source in an air mass ascending within a convection column is the latent heat from condensing water. The equivalent potential temperature incorporates the amount of latent heating that would be added if all the water vapor 10
contained in the air parcel was condensed. In the case of the Chisholm fire, equiva-lent potential temperature was almost constant throughout the lower troposphere. If a modified equivalent potential temperature definition that also takes into account the latent heat of freezing is used, values are in a range between 320 and 322 K from the boundary layer to an altitude of about 8 km. The equivalent potential temperature of the 15
tropopause, by contrast, was 332 K – hence latent heating alone would not have been sufficient to lift airmasses into the lower stratosphere. For pyroCbs, of course, heating from the fire is an important additional contributor to the internal energy of air parcels. As reported in Trentmann et al. (2006), we estimate that the fire heating contributed about 6 K to the temperature of air parcels at the anvil level of the Chisholm pyroCb. 20
The combined effect of latent heating and fire heating can yield potential temperatures of 328 K. This is in good agreement with the main outflow level of the pyroCb. On the other hand, as shown by Fig.10, a substantial fraction of the aerosol mass ends up at much higher potential temperature levels. Neglecting radiative heating, which is not significant on the short time scales considered here, any aerosol mass at θ>328 K 25
must be the result of mixing with stratospheric air characterized by large values of potential temperature. We can thus conclude that the small-scale mixing processes, most importantly those induced by gravity wave breaking at the cloud top, increased the stratospheric penetration of the pyroCb smoke by as much as 20–30 K.
ACPD
7, 10371–10403, 2007 Small-scale processes enhancing TST by pyroCb storms G. Luderer et al. Title Page Abstract Introduction Conclusions References Tables Figures ◭ ◮ ◭ ◮ Back CloseFull Screen / Esc
Printer-friendly Version
Interactive Discussion
5 Summary and conclusions
We investigated the cloud top of an intensive pyroCb and provide an explanation for the occurrence of the characteristic cold U/warm center cloud top temperature structure that has also been observed for other cases of severe thunderstorm convection. A close link between the cold U/warm center feature and TST induced by small-scale 5
mixing processes at the cloud top could be established.
The model results presented here show that the cold U/warm center cloud top tem-perature pattern observed from satellite radiometry can be closely reproduced with the cloud resolving model ATHAM. Analysis of the simulated fields of potential tempera-ture and other prognostic variables of the model demonstrates that this featempera-ture is due 10
to dynamic processes at the cloud top: the pyroCb’s overshooting dome induces a stationary gravity wave, which strongly enhances mixing of smoke laden air masses of the pyroCb with stratospheric air masses characterized by high potential temperatures. The gravity wave generates large gradients of potential temperature and tracer con-centration, and turbulence produced by gravity wave breaking results in efficient mixing 15
across isentropes. While convective advection, latent heating and sensible heating from the fire alone can explain only the transport of air masses to sub-tropopause lev-els of about 328 K, the small-scale mixing processes presented in this paper are of key importance for the injection of a small but significant fraction of smoke to lower strato-spheric potential temperature levels of up to 360 K. Thus, small-scale mixing increased 20
the stratospheric penetration of the smoke by as much as 30 K.
The results presented here are in good agreement with earlier studies of regular thunderstorm convection. Our explanation for the formation of the cold U/warm center structure based on small-scale mixing processes is consistent with the thunderstorm cloud top dynamics presented bySchlesinger(1984) andAdler and Mack(1986). The 25
importance of gravity wave formation and breaking for TST of pyroCb smoke found here is very similar to the role of gravity waves in transporting water vapor to the lower stratosphere by mid-latitude convection as described byWang(2003,2007). The close
ACPD
7, 10371–10403, 2007 Small-scale processes enhancing TST by pyroCb storms G. Luderer et al. Title Page Abstract Introduction Conclusions References Tables Figures ◭ ◮ ◭ ◮ Back CloseFull Screen / Esc
Printer-friendly Version
Interactive Discussion connection between the thermal structure of the cloud top as observed from satellite
and TST, as demonstrated in this study, opens up the possibility of assessing the oc-currence of TST induced by deep convection using IR satellite observations.
PyroCb induced smoke injection is an important source of trace gases and aerosols in the upper troposphere and lower stratosphere. Modeling studies are an important 5
tool to advance our understanding of the relevant mechanisms. The Chisholm fire case study, presented here and inLuderer et al.(2006) and Trentmann et al.(2006), suggests that the principal ingredients for direct smoke injection by pyroCbs are 1) strong fire forcing through heat release, 2) favorable meteorological conditions, with, most importantly, sufficient moisture in the lower and mid-troposphere, and 3) small-10
scale mixing processes at the cloud top.
More studies are needed to further improve our understanding of the causes and effects of UT/LS aerosol plumes originating from forest fires. Moreover, more convec-tion scale modeling studies also for other cases and geographical regions would be desirable. Regional simulations also considering radiative effects for longer timescales 15
and larger spatial scales would enhance the understanding of the further development of lower stratospheric aerosol plumes induced by pyroCbs. Finally, global chemistry climate models should be used to assess the effect of forest fire smoke on radiative balance and lower stratospheric chemistry.
Acknowledgements. We would like to thank H. Wernli, D. Rosenfeld, R. Servranckx and S. Eto
20
for stimulating discussions. G. Luderer was supported by an International Max Planck Re-search School fellowship. J. Trentmann was supported by the Helmholtz Association within the Virtual Institute COSI TRACKS. This work was also funded by the Max Planck Society.
References
Adler, R. F. and Mack, R. A.: Thunderstorm Cloud Top Dynamics as Inferred from Satellite
25
Observations and a Cloud Top Parcel Model, J. Atmos. Sci., 43, 1945–1960, 1986. 10375,
ACPD
7, 10371–10403, 2007 Small-scale processes enhancing TST by pyroCb storms G. Luderer et al. Title Page Abstract Introduction Conclusions References Tables Figures ◭ ◮ ◭ ◮ Back CloseFull Screen / Esc
Printer-friendly Version
Interactive Discussion
Anderson, G. P., Clough, S. A., Kneizys, F. X., Chetwynd, J. H., and Shettle, E. P.: AFGL atmo-spheric constituent profiles (0–120 km), Tech. Rep. AFGL-TR-86-0110, Air Force Geophys. Lab., Hanscom Air Force Base, Mass., 1986. 10380
Andreae, M. O. and Merlet, P.: Emission of trace gases and aerosols from biomass burning, Global Biogeochem. Cycles, 15, 955–966, 2001. 10379
5
ASRD: Final Documentation Report – Chisholm Fire (LWF-063), Forest Protection Division, ISBN 0-7785-1841-8, Tech. rep., Alberta Sustainable Resource Development, 2001. 10373,
10375
Fischer, H., de Reus, M., Traub, M., Williams, J., Lelieveld, J., de Gouw, J., Warneke, C., Schlager, H., Minikin, A., Scheele, R., and Siegmund, P.: Deep convective injection of
10
boundary layer air into the lowermost stratosphere at midlatitudes, Atmos. Chem. Phys., 3, 739–745, 2003. 10373
Fromm, M., Bevilacqua, R., Servranckx, R., Rosen, J., Thayler, J., Herman, J., and Larko, D.: Pyro-cumulonimbus injection of smoke into the stratosphere: Observations and impact of a super blowup in northwestern Canada on 3-4 August 1998, J. Geophys. Res., 110, D08205,
15
doi:10.1029/2004JD005350, 2005.10372,10377
Fromm, M. D. and Servranckx, R.: Transport of forest fire smoke above the tropopause by supercell convection, Geophys. Res. Lett., 30, 1542, doi:10.1029/2002GL016820, 2003.
10372,10373,10376
Fu, Q. and Liou, K. N.: Parameterization of the radiative properties of cirrus clouds, J. Atmos.
20
Sci., 50, 2008–2025, 1993.10380
Graf, H.-F., Herzog, M., Oberhuber, J. M., and Textor, C.: The effect of environmental conditions on volcanic plume rise, J. Geophys. Res., 104, 24 309–24 320, 1999.10378
Hanisco, T. F., Moyer, E. J., Weinstock, E. M., St. Clair, J. M., Sayres, D. S., Smith, J. B., Lockwood, R., Anderson, J. G., Dessler, A. E., Keutsch, F. N., Spackman, J. R., Read, W. G.,
25
and Bui, T. P.: Observations of deep convective influence on stratospheric water vapor and its isotopic composition, Geophys. Res. Lett., 34, L04814, doi:10.1029/2006GL027899, 2007.
10373
Herzog, M., Graf, H.-F., Textor, C., and Oberhuber, J. M.: The effect of phase changes of water on the development of volcanic plumes, J. Volcanol. Geotherm. Res, 87, 55–74, 1998.10378
30
Herzog, M., Oberhuber, J. M., and Graf, H.-F.: A prognostic turbulence scheme for the nonhy-drostatic plume model ATHAM, J. Atmos. Sci., 60, 2783–2796, 2003.10378,10402
Se-ACPD
7, 10371–10403, 2007 Small-scale processes enhancing TST by pyroCb storms G. Luderer et al. Title Page Abstract Introduction Conclusions References Tables Figures ◭ ◮ ◭ ◮ Back CloseFull Screen / Esc
Printer-friendly Version
Interactive Discussion
vere Thunderstorm Anvils, Mon. Wea. Rev., 116, 2200–2224, 1988. 10374
Heymsfield, G. M., Sezejwach, G., Schotz, S., and Blackmer Jr.,, R. H.: Upper level structure of Oklahoma tornadic stroms on 2 May 1979. II: Proposed explanation of ”V” pattern and internal warm region in infrared observation, J. Atmos. Sci., 40, 1756–1767, 1983. 10374
Holton, J. R., Haynes, P. H., McIntyre, M. E., Douglass, A. R., Rood, R. B., and Pfister, L.:
5
Stratosphere-Troposphere Exchange, Reviews of Geophysics, 33, 403–439, 1995. 10373
Hungersh ¨ofer, K.: Optical properties of aerosol particles and radiative transfer in connection with biomass burning, Ph.D. thesis, Institute for Meteorology, University of Leipzig, 2007.
10380
Inoue, T.: A cloud type classification with NOAA 7 split-window measurements, J. Geophys.
10
Res., 92, 3991–4000, 1987. 10377
Lane, T. P. and Sharman, R. D.: Gravity wave breaking, secondary wave generation, and mixing above deep convection in a three-dimensional cloud model, Geophys. Res. Lett., 33, L23813, doi:10.1029/2006GL027988, 2006. 10374
Lane, T. P., Sharman, R. D., Clark, T. L., and Hsu, H.-M.: An Investigation of Turbulence
Gen-15
eration Mechanisms above Deep Convection., J. Atmos. Sci., 60, 1297–1321, 2003.10374
Levizzani, V. and Setv ´ak, M.: Multispectral, High-Resolution Satellite Observations of Plumes on Top of Convective Storms, J. Atmos. Sci., 53, 361–369, 1996. 10374
Luderer, G., Trentmann, J., Winterrath, T., Textor, C., Herzog, M., Graf, H. F., and Andreae, M. O.: Modeling of biomass smoke injection into the lower stratosphere by a large forest
20
fire (Part II): Sensitivity studies, Atmos. Chem. Phys., 6, 5261–5277, 2006. 10372, 10373,
10376,10378,10380,10388
Mullendore, G. L., Durran, D. R., and Holton, J. R.: Cross-tropopause tracer transport in midlati-tude convection, J. Geophys. Res., 110, D06113, doi:10.1029/2004JD005059, 2005.10373,
10374
25
Oberhuber, J. M., Herzog, M., Graf, H.-F., and Schwanke, K.: Volcanic plume simulation on large scales, J. Volcanol. Geotherm. Res, 87, 29–53, 1998.10378
Pittman, J. V., Weinstock, E. M., Oglesby, R. J., Sayres, D. S., Smith, J. B., Anderson, J. G., Cooper, O. R., Wofsy, S. C., Xueref, I., Gerbig, C., Daube, B. C., Richard, E. C., Ridley, B. A., Weinheimer, A. J., Loewenstein, M., Jost, H.-J., Lopez, J. P., Mahoney, M. J.,
Thomp-30
son, T. L., Hargrove, W. W., and Hoffman, F. M.: Transport in the subtropical lowermost stratosphere during the Cirrus Regional Study of Tropical Anvils and Cirrus Layers-Florida Area Cirrus Experiment, J. Geophys. Res., 112, D08304, doi:10.1029/2006JD007851, 2007.
ACPD
7, 10371–10403, 2007 Small-scale processes enhancing TST by pyroCb storms G. Luderer et al. Title Page Abstract Introduction Conclusions References Tables Figures ◭ ◮ ◭ ◮ Back CloseFull Screen / Esc
Printer-friendly Version
Interactive Discussion
10373
Ray, E. A., Rosenlof, K. H., Richard, E. C., Hudson, P. K., Cziczo, D. J., Loewenstein, M., Jost, H.-J., Lopez, J., Ridley, B., Weinheimer, A., Montzka, D., Knapp, D., Wofsy, S. C., Daube, B. C., Gerbig, C., Xueref, I., and Herman, R. L.: Evidence of the effect of summertime midlatitude convection on the subtropical lower stratosphere from CRYSTAL-FACE tracer
5
measurements, J. Geophys. Res., 109, D18304, doi:10.1029/2004JD004655, 2004. 10373
Reid, J. S., Koppmann, R., Eck, T. F., and Eleuterio, D. P.: A review of biomass burning emis-sions part II: intensive physical properties of biomass burning particles, Atmos. Chem. Phys., 5, 799–825, 2005. 10379
Rosenfeld, D., Fromm, M., Trentmann, J., Luderer, G., Andreae, M. O., and Servranckx, R.:
10
The Chisholm firestorm: observed microstructure, precipitation and lightning activity of a pyro-cumulonimbus, Atmos. Chem. Phys., 6, 645–659, 2007. 10372,10373,10374,10375,
10376,10377,10381,10393
Schlesinger, R. E.: Mature Thunderstorm Cloud-Top Structure and Dynamics: A Three-Dimensional Numerical Simulation Study., J. Atmos. Sci., 41, 1551–1570, 1984. 10375,
15
10387
Setv ´ak, M., Rabin, R. M., and Wang, P. K.: Contribution of the MODIS instrument to obser-vations of deep convective storms and stratospheric moisture detection in GOES and MSG imagery, Atmos. Res., 83, 505–518, 2007. 10374
Textor, C., Graf, H.-F., Herzog, M., and Oberhuber, J. M.: Injection of gases into the stratosphere
20
by explosive volcanic eruptions, J. Geophys. Res., 108, 4606, doi:10.1029/2002JD002987, 2003. 10378
Textor, C., Graf, H. F., Herzog, M., Oberhuber, J. M., Rose, W. I., and Ernst, G. G. J.: Volcanic particle aggregation in explosive eruption columns. Part I: Parameterization of the micro-physics of hydrometeors and ash, J. Volcanol. Geotherm. Res, 150, 359–377, 2006a.10378
25
Textor, C., Graf, H. F., Herzog, M., Oberhuber, J. M., Rose, W. I., and Ernst, G. G. J.: Vol-canic particle aggregation in explosive eruption columns. Part II: Numerical experiments, J. Volcanol. Geotherm. Res, 150, 378–394, 2006b.10378
Thomas, G. E. and Stamnes, K.: Radiative transfer in the atmosphere and ocean, Cambridge University Press, Cambridge, 1999. 10382
30
Trentmann, J., Andreae, M. O., Graf, H.-F., Hobbs, P. V., Ottmar, R. D., and Trautmann, T.: Simulation of a biomass-burning plume: Comparison of model results with observations, J. Geophys. Res., 107, 4013, doi:10.1029/2001JD000410, 2002.10378
ACPD
7, 10371–10403, 2007 Small-scale processes enhancing TST by pyroCb storms G. Luderer et al. Title Page Abstract Introduction Conclusions References Tables Figures ◭ ◮ ◭ ◮ Back CloseFull Screen / Esc
Printer-friendly Version
Interactive Discussion
Trentmann, J., Luderer, G., Winterrath, T., Fromm, M., Servranckx, R., Textor, C., Herzog, M., and Andreae, M. O.: Modeling of biomass smoke injection into the lower stratosphere by a large forest fire (Part I): Reference study, Atmos. Chem. Phys., 6, 5247–5260, 2006. 10372,
10373,10375,10376,10378,10386,10388
Wang, P. K.: Moisture plumes above thunderstorm anvils and their contributions
cross-5
tropopause transport of water vapor in midlatitudes, J. Geophys. Res., 108, 4194, doi: 10.1029/2002JD002581, 2003. 10373,10387
Wang, P. K.: The thermodynamic structure atop a penetrating convective thunderstorm, Atmos. Res., 83, 254–262, 2007.10373,10387
ACPD
7, 10371–10403, 2007 Small-scale processes enhancing TST by pyroCb storms G. Luderer et al. Title Page Abstract Introduction Conclusions References Tables Figures ◭ ◮ ◭ ◮ Back CloseFull Screen / Esc
Printer-friendly Version
Interactive Discussion
(a) 0.65 µm reflectance (b) 10.8 µm brightness temperature
Fig. 1. Images from a NOAA AVHRR overpass during the mature phase of pyroCb convection.
Reflectance in the visible 0.65 µm channel is depicted in (a), brightness temperatures mea-sured by the 10.8 µm thermal IR channel are shown in (b). Reproduced fromRosenfeld et al.
ACPD
7, 10371–10403, 2007 Small-scale processes enhancing TST by pyroCb storms G. Luderer et al. Title Page Abstract Introduction Conclusions References Tables Figures ◭ ◮ ◭ ◮ Back CloseFull Screen / Esc
Printer-friendly Version
Interactive Discussion
Fig. 2. Skew-T diagramm depicting vertical profiles of temperature (solid line) and dew point temperature (dotted line) measured at Edmonton at 00:00 UTC. The thick red and blue isotherms indicate the maximum and minimum cloud top brightness temperatures as measured by the AVHRR. These deviate substantially from background tropopause temperatures. This sounding was also used for the initialization of the background meteorology in the model simu-lations. The arrows indicate the wind profile, with every full barb corresponding to 10 m s−1.
ACPD
7, 10371–10403, 2007 Small-scale processes enhancing TST by pyroCb storms G. Luderer et al. Title Page Abstract Introduction Conclusions References Tables Figures ◭ ◮ ◭ ◮ Back CloseFull Screen / Esc
Printer-friendly Version
Interactive Discussion
Fig. 3. Three-dimensional representation of the aerosol plume after 40 min simulation time.
ACPD
7, 10371–10403, 2007 Small-scale processes enhancing TST by pyroCb storms G. Luderer et al. Title Page Abstract Introduction Conclusions References Tables Figures ◭ ◮ ◭ ◮ Back CloseFull Screen / Esc
Printer-friendly Version
Interactive Discussion
Fig. 4. Aerosol mass concentration along the y =−5 km vertical cross section. Contour lines
ACPD
7, 10371–10403, 2007 Small-scale processes enhancing TST by pyroCb storms G. Luderer et al. Title Page Abstract Introduction Conclusions References Tables Figures ◭ ◮ ◭ ◮ Back CloseFull Screen / Esc
Printer-friendly Version
Interactive Discussion
(a) 20 min (b) 30 min (c) 40 min
Fig. 5. Cloud top temperatures in◦C on the 0.5 g kg−1 hydrometeor concentration isosurface
ACPD
7, 10371–10403, 2007 Small-scale processes enhancing TST by pyroCb storms G. Luderer et al. Title Page Abstract Introduction Conclusions References Tables Figures ◭ ◮ ◭ ◮ Back CloseFull Screen / Esc
Printer-friendly Version
Interactive Discussion
Fig. 6. Results from offline calculation of radiative properties. (a) Extinction due to absorption
and scattering by hydrometeors and aerosols at 10.8 µm. Contours of aerosol mass concentra-tion (solid line) and hydrometeor concentraconcentra-tion (dashed line) indicate the extent of the smoke plume and pyroCb. (b) Aerosol and hydrometeor extinction optical depth τ at 10.8 µm from the top of the atmosphere as a function of z. Note that the τ=1 contour (solid line), which can be used as an indication of the effective level of emission of the thermal radiation, is situated very close to the cloud top.
ACPD
7, 10371–10403, 2007 Small-scale processes enhancing TST by pyroCb storms G. Luderer et al. Title Page Abstract Introduction Conclusions References Tables Figures ◭ ◮ ◭ ◮ Back CloseFull Screen / Esc
Printer-friendly Version
Interactive Discussion
Fig. 7. Brightness temperatures derived from upwelling radiance simulated for the 10.8 µm
wavelength band. The contour lines indicate the altitude in km of the 100 µg m−3isosurface of
ACPD
7, 10371–10403, 2007 Small-scale processes enhancing TST by pyroCb storms G. Luderer et al. Title Page Abstract Introduction Conclusions References Tables Figures ◭ ◮ ◭ ◮ Back CloseFull Screen / Esc
Printer-friendly Version
Interactive Discussion
Fig. 8. Vertical cross-sections of (a, b) temperature anomaly, (c) pressure anomaly, and (d)
vertical wind field at y=–5 km. Solid black lines indicate isolines of aerosol concentration. Tem-perature and pressure anomalies are defined as the difference with respect to the background temperature and pressure profiles. The distinct bipolar structure is a clear indication of gravity wave activity.
ACPD
7, 10371–10403, 2007 Small-scale processes enhancing TST by pyroCb storms G. Luderer et al. Title Page Abstract Introduction Conclusions References Tables Figures ◭ ◮ ◭ ◮ Back CloseFull Screen / Esc
Printer-friendly Version
Interactive Discussion
(a) 20 min (b) 20 min
(c) 28 min (d) 28 min
(e) 34 min (f) 34 min
ACPD
7, 10371–10403, 2007 Small-scale processes enhancing TST by pyroCb storms G. Luderer et al. Title Page Abstract Introduction Conclusions References Tables Figures ◭ ◮ ◭ ◮ Back CloseFull Screen / Esc
Printer-friendly Version
Interactive Discussion
Fig. 9. Vertical cross sections of potential temperature (left column) and vertical turbulent
exchange coefficient (right column) for four different points in time. Due to the anisotropic treat-ment of turbulence in ATHAM (Herzog et al.,2003), the verticlal turbulent exchange coefficient
Kver is related to the horizontal turbulent exchange coefficient Khoras Kver=
√ 2Kver.
ACPD
7, 10371–10403, 2007 Small-scale processes enhancing TST by pyroCb storms G. Luderer et al. Title Page Abstract Introduction Conclusions References Tables Figures ◭ ◮ ◭ ◮ Back CloseFull Screen / Esc
Printer-friendly Version
Interactive Discussion
Fig. 10. Temporal evolution of the vertical distributions of aerosol mass as a function of (a)