HAL Id: hal-02904210
https://hal.archives-ouvertes.fr/hal-02904210
Submitted on 9 Dec 2020
HAL is a multi-disciplinary open access
archive for the deposit and dissemination of sci-entific research documents, whether they are pub-lished or not. The documents may come from teaching and research institutions in France or abroad, or from public or private research centers.
L’archive ouverte pluridisciplinaire HAL, est destinée au dépôt et à la diffusion de documents scientifiques de niveau recherche, publiés ou non, émanant des établissements d’enseignement et de recherche français ou étrangers, des laboratoires publics ou privés.
On the dynamics in the southeastern Ligurian Sea in
summer 2010
Pierre-Marie Poulain, Elena Mauri, R. Gerin, Jacopo Chiggiato, Katrin
Schroeder, Annalisa Griffa, M. Borghini, E. Zambianchi, P. Falco, Pierre
Testor, et al.
To cite this version:
Pierre-Marie Poulain, Elena Mauri, R. Gerin, Jacopo Chiggiato, Katrin Schroeder, et al.. On the dynamics in the southeastern Ligurian Sea in summer 2010. Continental Shelf Research, Elsevier, 2020, 196, pp.104083. �10.1016/j.csr.2020.104083�. �hal-02904210�
Continental Shelf Research
On the dynamics in the southeastern Ligurian Sea in summer 2010
--Manuscript
Draft--Manuscript Number:
Article Type: Research paper
Section/Category: Physical Oceanography (estuarine, coastal and shelf sea - modelling and process studies)
Keywords: Drifter, glider, Ligurian Sea, Corsica Channel, offshore-flowing filaments, wind-driven circulation
Corresponding Author: Pierre-Marie Poulain OGS
Sgonico, Trieste Italy First Author: Pierre-Marie Poulain Order of Authors: Pierre-Marie Poulain
Elena Mauri Riccardo Gerin Jacopo Chiggiato Katrin Schroeder Annalisa Griffa Mireno Borghini Enrico Zambianchi Pier Paolo Falco Pierre Testor Laurent Mortier
Abstract: Drifters and a glider were operated in the southeastern Ligurian Sea to study the near-surface currents and water mass properties in summer 2010. Additional data were collected by a moored current meter in the Corsica Channel (CC). These in situ data were complemented by surface wind products, satellite images of chlorophyll concentration and a Regional Ocean Modeling System (ROMS) numerical model that was implemented to simulate the local coastal dynamics. Southward currents were prevailing along the continental Italian coast, advecting filaments with a high optical signal coming from the Arno River. North of Elba Island, currents turned westward and northward in the vicinity of the CC. Further to the north they veered eastward, forming an anticyclonic circulation feature centered around Capraia Island. This general circulation picture was disrupted and reversed during events of sustained southerly winds occurring with a period of about a week. The near-surface currents in the CC and the anticyclonic circulation around Capraia Island showed the same weekly variations related to the local wind forcing. The ROMS model simulations agreed satisfactorily with the observations, in particular the strength of the Capraia anticyclonic circulation (quantified with the Capraia index) was confirmed to be strongly wind-dependent.
Suggested Reviewers: Hezi Gildor
[email protected] Dan Hayes [email protected] Nadia Pinardi [email protected] Carlo Brandini
Sgonico, 13 September 2019
Dear Sir/Madam:
Please find attached a manuscript entitled “On the dynamics in the southeastern Ligurian Sea in summer 2010” that we would like to be considered for publication in the Continental Shelf Research.
Sincerely yours.
Dr. Pierre-Marie Poulain
Head, Mobile Autonomous Oceanographic Systems (MAOS) Oceanography Section, OGS
Senior Scientist
Environmental Knowledge and Operational Effectiveness (EKOE), CMRE Manuscript File
1
On the dynamics in the southeastern Ligurian Sea in summer 2010
2 3 4
1,2Poulain P.-M, 1Mauri E., 1Gerin R., 3Chiggiato J., 3Schroeder K., 4Griffa A., 4Borghini M.,
5
5,6Zambianchi E., 5Falco P., 7Testor P., 7Mortier L.
6 7 8
1Istituto Nazionale di Oceanografia e di Geofisica Sperimentale (OGS), Trieste, Italy
9
2Center for Maritime Research and Experimentation (CMRE), La Spezia, Italy
10
3Istituto di Scienze Marine (ISMAR), CNR, Venezia, Italy
11
4Istituto di Scienze Marine (ISMAR), CNR, La Spezia, Italy
12
5Università Parthenope, Naples, Italy
13
6Istituto di Scienze Marine (ISMAR), CNR, Rome, Italy
14
7Laboratoire d’Océanographie et du Climat (LOCEAN), Paris, France
15 16 Corresponding author: 17 P.-M. Poulain, 18
OGS, Borgo Grotta Gigante, 40/c, 19 Sgonico (TS), Italy 20 ([email protected]) 21 22
Continental Shelf Research 23
September 2019 24
25
Keywords: Drifter, glider, Ligurian Sea, Corsica Channel, offshore-flowing filaments,
26
wind-driven circulation 27
28 Manuscript File
Highlights
29 30
The surface circulation in the southeastern Ligurian Sea is strongly wind-31
dependent. 32
Anticyclonic circulation around Capraia Island is predominant. 33
Currents transport offshore filaments of low-salinity and nutrient-rich waters of 34
riverine origin. 35
Abstract
36 37
Drifters and a glider were operated in the southeastern Ligurian Sea to study the near-38
surface currents and water mass properties in summer 2010. Additional data were collected by 39
a moored current meter in the Corsica Channel (CC). These in situ data were complemented 40
by surface wind products, satellite images of chlorophyll concentration and a Regional Ocean 41
Modeling System (ROMS) numerical model that was implemented to simulate the local 42
coastal dynamics. Southward currents were prevailing along the continental Italian coast, 43
advecting filaments with a high optical signal coming from the Arno River. North of Elba 44
Island, currents turned westward and northward in the vicinity of the CC. Further to the north 45
they veered eastward, forming an anticyclonic circulation feature centered around Capraia 46
Island. This general circulation picture was disrupted and reversed during events of sustained 47
southerly winds occurring with a period of about a week. The near-surface currents in the CC 48
and the anticyclonic circulation around Capraia Island showed the same weekly variations 49
related to the local wind forcing. The ROMS model simulations agreed satisfactorily with the 50
observations, in particular the strength of the Capraia anticyclonic circulation (quantified with 51
the Capraia index) was confirmed to be strongly wind-dependent. 52
1. Introduction
54
Currents and transports of water mass properties in sea areas including islands and channels 55
and in the coastal zone are crucial at the local scale for the dispersion and mixing of pollutants 56
and at the large scale for the interaction between different basins, which in turn can control 57
the whole functioning of entire seas or oceans. Besides, if important river mouths co-exist in 58
the vicinity of islands and channels, the distribution of the water masses and the local 59
ecosystem dynamics can even be more complex and challenging to monitor and study. 60
61
The Mediterranean area in the southeastern Ligurian Sea and northern Tyrrhenian Sea (Fig. 62
1), connected by the Corsica Channel (CC), is such an area, with complex topography and 63
coast morphology, the existence of several islands (Elba, Monte Cristo, Giglio, etc) and also 64
the mouth of an important Italian river (the Arno River). Fluxes across the CC have been 65
measured almost continuously between 1982 and 1998 with moored currentmeters (Manzella, 66
1984; Astraldi et al., 1990; Astraldi and Gasparini, 1992). The northward flowing current in 67
the CC, also referred to as the Tyrrhenian (Astraldi and Gasparini, 1992) or Eastern Corsica 68
Current (ECC, Pinardi et al. 2006), is maximum in winter and is mainly driven by the steric 69
sea level difference between the Tyrrhenian to the south and the Ligurian Sea to the north. 70
This difference is larger in winter due to the larger heat loss and the local effect of the wind 71
stress curl in the Liguro-Provençal basin (Pinardi and Masetti, 2000). The heat flux 72
associated with the ECC varies seasonally and plays a crucial role for deep water formation 73
processes in the NW Mediterranean (Astraldi and Gasparini, 1992). The ECC is characterized 74
by velocity fluctuations with periods between 2 and 15 days with the occurrence of 75
intermittent reversals (Astraldi et al., 1990). 76
77
This ECC seasonal (and also inter-annual) variability was confirmed by satellite altimetry 78
data along selected satellite sub-tracks criss-crossing in the CC vicinity (Vignudelli et al., 79
1999, 2000, 2005; Bouffard et al., 2008). Vignudelli et al. (1999) have shown that the 80
interannual variations of water transport through the CC, as measured by satellite altimeters, 81
can be related to the North Atlantic Oscillation. More recently, Bouffard et al. (2008) have 82
demonstrated that multi-mission altimetric data agree well with in-situ measurements and 83
therefore represent an accurate long-term mean to monitor the exchange between the 84
Tyrrhenian and Ligurian seas. 85
86
Conductivity-temperature-depth (CTD) measurements and numerical simulations (Onken et 87
al., 2005) as well as surface drifters (Poulain et al., 2012) have shown that the ECC can veer 88
in the clockwise sense around Capraia Island and form an anticyclonic eddy centered around 89
the island. We will refer to this circulation feature as the Capraia anticyclone, although it has 90
recently been also named “Ligurian Anticyclone” by Ciuffardi et al. (2016). It appears to be 91
dominant in summer when the ECC is weak. In particular, one drifter in summer 2007 92
completed 5 full loops around the island with a periodicity of about 3 days (Poulain et al., 93
2012). 94
95
In this paper, simultaneous observations of currents and water mass properties obtained by a 96
glider, surface drifters and moored instruments, along with ancillary satellite data and wind 97
products and numerical model simulations, are used to explore and study the dynamics of the 98
southeastern Ligurian and CC in summer 2010. Most data were collected as part of the 99
LIDEX10 campaign, whose general objective was to improve the understanding of turbulent 100
transport and dispersion in the ocean, more specifically to study the dispersion in a coastal 101
frontal zone due to mixing by meso- and submesoscale structures (Schroeder et al., 2012). 102
The main focus of this paper is on mesoscale (~10 km) and submesoscale (< 10 km) 103
structures, some of them transporting offshore and mixing the fresh and nutrient-rich waters 104
of river origin. The Capraia anticyclone, which has a subbasin scale (40-50 km), is described 105
quantitatively using the drifter data. Some aspects of the near-surface circulation and ECC 106
transport are also investigated, relating them to the local wind forcing. 107
108
Details about the instruments used and the collected data are provided in section 2. The 109
surface circulation as measured by the drifters is described in section 3.1, including a 110
qualitative description of their motions and a quantitative study of the Capraia anticyclone. 111
The effect of the local wind forcing is explored in section 3.2, using both observations and 112
numerical simulations obtained with the Regional Ocean Modelling System (ROMS). The 113
surface circulation derived from ocean color satellite images superimposed with drifter tracks 114
is discussed in section 3.3. Section 3.4 includes the results on the 3D spatial structure and 115
temporal evolution of the water mass properties (temperature and salinity) provided by the 116
glider and also detected in ocean color satellite images. Discussion of the most salient results 117
and conclusions are found in section 4. 118
119
2. Data and methods
120
The LIDEX10 experiment took place on-board the R/V Maria Grazia of the Italian National 121
Research Council (CNR) on 3 July 2010 in the southeastern Ligurian Sea off the Tuscany 122
coast (Italy). First, a conductivity-temperature-depth (CTD) survey was carried on, along a 123
zonal transect at latitude 43˚ 35.34’ N and between longitudes 9˚ 56.7’ E and 10˚ 5.94’ E, 124
including 12 casts down to 50 m depth and separated by 1-4 km. The CTD data revealed a 125
near-surface vertical front in the top 7-8 m below the surface, separating lower salinity and 126
higher chlorophyll fluorescence water inshore from saltier and poorer water offshore 127
(Schroeder et al., 2012). The CTD data are not discussed any further in this paper since the 128
glider repeated the same transect shortly after. 129
2.1 In-situ observations
131
2.1.1 Drifters 132
133
Two groups of 9 drifters were deployed after the CTD transect on 3 July 2010, on each side of 134
the front, approximately 5 km apart. For each group, the drifters were released in three tight 135
triplets separated by 300-500 m, and with 50-100 m distance between the drifters within each 136
triplet (see Fig. 2 of Schroeder et al., 2012). An additional drifter was deployed between the 2 137
groups on the front. In brief, the 19 drifters were deployed with relative distances ranging 138
from 50 m to 6 km. The deployments were conducted in less than 4 h (from 11:34 to 15:26 139
GMT). All drifters were CODE designs (Poulain, 1999; Poulain and Gerin, 2019), fitted with 140
GPS receivers and manufactured by Technocean (Cape Coral, Florida). They measure the 141
currents in the top first meter below the surface with an accuracy of 1-2 cm/s. The principal 142
error is a wind-induced slip of about 0.1% of the wind speed (Poulain and Gerin, 2019). Most 143
of the drifters (17 units) transmitted their data to the Argos system on-board polar-orbiting 144
satellites, whereas 2 drifters used the Iridium telemetry system. GPS positions and ancillary 145
data (e.g., sea surface temperature, battery voltage) were transmitted every hour. 146
147
The drifter GPS data were quality controlled and interpolated at 0.5 h intervals using a kriging 148
technique (see Menna et al., 2017 and references therein). Velocities were calculated by finite 149
differencing the interpolated positions (central difference scheme with hourly interval). For 150
some applications (see section 3.2) the drifter velocity timeseries were low-pass filtered with a 151
Hamming filter (36 h) to remove high frequency motions. 152
153
The mean half-life of the 19 drifters deployed on 3 July 2010 is about 2 weeks (many drifters 154
stopped on 19-21 July after 16-18 days). Unfortunately, the single drifter deployed between 155
the two clusters was rather short lived and stopped functioning on 7 July. 156
157
2.1.2 Glider 158
A shallow water Slocum glider manufactured by Teledyne Webb Research, Falmouth, 159
Massachussetts was deployed at location 43° 35.78’ N, 10° 06.20’ E on 3 July 2010, shortly 160
after the drifter deployments (i.e., at 16:29 GMT). The glider was equipped with an un-161
pumped Sea-Bird Scientific SBE 41 CT to measure conductivity (0.0003 S/m), temperature 162
(0.002 °C) and pressure (0.5 psi), along with sensors to measure dissolved oxygen, particle 163
backscattering and coloured dissolved organic matter fluorescence. It was programmed to 164
measure vertical properties of the water column as deep as 200 m. All sensors were set to 165
record every 8 seconds. The typical horizontal resolution of the glider data along its route was 166
about 0.5 km. In this paper only temperature, salinity and density observations are considered 167
to describe the local dynamics, with a main focus on the top 40 m of water. 168
169
The glider was initially piloted to sample the transect surveyed by the research vessel. Given 170
the southward motion of the drifters, and in order to have the glider and drifters in the same 171
area at about the same time, the glider was subsequently programmed to survey the 172
southeastern Ligurian Sea in a southward zig-zag pattern until it approached the northern 173
coast of Elba Island (Fig. 1). At this point it was piloted to move westward and to sample the 174
CC, until it was recovered on 20 July 2010 (at about 10:00 GMT) at 43° 00.90’ N, 09° 35.82’ 175
E, between the northern tip of Corsica and Capraia Island. 176
177
2.1.3 Mooring 178
A mooring with current meters is maintained by CNR ISMAR in the CC (between the 179
northern tip of Corsica and Capraia Island) since 1985. Its location is 43° 1.5’ N, 9° 41.0’ E. 180
Current profiles are measured with an upward 75 KHz RDI Acoustic Dopler Current Profiler 181
(ADCP), with a bin size of 16 m, between 32 and 384 m at 2 h intervals. The meridional and 182
zonal velocities were extracted from the dataset for the period July-August 2010. Only the 183
meridional (along-channel) component is considered here, since it is more significant for our 184
scopes than the zonal (across-channel) component (the meridional speed is on average 3 times 185
stronger than the zonal one), and gives indication on the water exchange between the 186
Tyrrhenian and the Ligurian Sea. For comparison with the surface drifter data, the mooring 187
data near 32 m depth was considered. In order to remove high frequency fluctuations, a 188
Hamming filter with cut off period of 36 h was applied to the velocity time series. 189
190
2.2 Remotely sensed data
191
Moderate Resolution Imaging Spectroradiometer (MODIS) satellite images of chlorophyll 192
concentration of the study area were used to describe the spatial structure and temporal 193
evolution of the surface circulation assuming that chlorophyll is a passive tracer advected by 194
the surface horizontal currents. Images of chlorophyll concentration were preferred on sea 195
surface temperature images as they delineate better the circulation features at meso- and 196
submesoscales (better contrast). Being in a coastal area where a river outflows nutrient-rich 197
water, there is a sharp contrast between coastal and offshore waters, the former being richer 198
(higher chlorophyll) and slightly colder (by about 1 ˚C, in our case). The daily images have a 199 horizontal resolution of 1 km. 200 201 2.3 Wind products 202
Consortium for Small-scale Modeling (COSMO, http://www.cosmo-model.org) wind 203
products run by the Italian Air Force National Meteorological Center were obtained for the 204
study area in July and August 2010. In particular, the COSMO-ME gridded 10-m vector 205
winds with 7 km grid spacing were used to force the ROMS model and to relate the wind 206
forcing to the currents measured by the drifters and at the CC mooring. For some applications 207
(see section 3.2) the COSMO-ME wind velocity timeseries were also low-pass filtered with a 208
Hamming filter (36 h) to remove high frequency fluctuations. Wind data at 10-m were also 209
obtained from the ODAS buoy (also called W1-M3A) located in the central Ligurian Sea (43° 210 48’ N, 9° 9.6’ E). 211 212 2.4 Numerical simulations 213
The ocean model employed in this application is the ROMS (Haidvogel et al., 2008; 214
Shchepetkin and McWilliams, 2005). As part of LIDEX10, the model was set up in 215
operational forecast mode on a domain covering the entire Ligurian Sea. The horizontal 216
resolution is 2 km, with 32 vertical sigma-levels non-linearly stretched to resolve the surface 217
boundary layer. The ocean model was forced by the COSMO-ME 10-m winds. Open 218
boundary conditions were applied to tracers and baroclinic velocity with radiation and 219
nudging (Marchesiello et al. 2001) from daily averages of the large-scale Mediterranean 220
Forecasting System (MFS) forecasts (Oddo et al., 2009). Three major rivers were included: 221
the Arno (daily discharges), Serchio and Magra (monthly climatologies). The operational 222
ROMS-based system was initialized on 1 May 2010 using an analysis field from the 223
Mediterranean Forecasting System (MFS) model. Since then, ROMS was run in forecast 224
mode once a day (00:00 UTC) with output data every 3 h and forecast range of 72 h. Data 225
assimilative analysis fields from the forecast system are available in Mourre and Chiggiato 226
(2014), but just for a short period. Thus, for this work only the free run (i.e., without data 227
assimilation) is considered. Additional details on the physics and numerical details 228
implemented in this application and performance can be found in Alvarez et al. (2012), 229
Schroeder et al. (2012), Mourre et al. (2011) and Mourre and Chiggiato (2014). 230 231 3. Results 232 3.1 Surface circulation 233 234
After deployment, all drifters moved southward, with the coastal group (red tracks in Fig. 2) 235
going faster and reaching 43˚N latitude after 4 days, on 7 July. The other group (blue tracks in 236
Fig. 2) followed with about 1-day delay. Between 7 and 10 July the coastal group proceeded 237
westward towards the CC, and veered southward upon approaching Corsica. In contrast, the 238
other drifters slowed down and stagnated just north of Elba Island for about 2 days (11-12 239
July). Most of these drifters then moved northward (in the ECC and also near the Italian 240
continental coast) on 13-14 July, before turning back and moving south and west starting on 241
15 July. On 15-19 July, the drifters in the southern part of the CC showed slow and rather 242
chaotic currents, except for 2 drifters which moved swiftly northward between the northern tip 243
of Corsica and Capraia Island on 14 and 19 July. Four drifters (blue tracks) moved to the 244
southwest rapidly on 19 July and joined the area of the CC. 245
246
After the recovery of the glider on 20 July, some drifters continued to provide data on the 247
surface circulation in the study area for about another month (not shown). The most striking 248
characteristics of the currents during that period are: 1) on 22 July, fast northward currents in 249
the CC; 2) on 23-25 July, reversal of this current with drifter moving south in the CC; and 3) a 250
prevailing anticyclonic circulation around Capraia Island mostly during the period 20 July - 251
17 August. No drifter moved north of 43˚ 30’ N and only 3 drifters moved eventually to the 252
Tyrrhenian Sea south of 42˚ 30’ N after some time. The composite plot of all the drifter 253
trajectories between 3 July and 27 August 2010 is shown in Fig. 3, with speed color-coded 254
along the trajectories. Fastest unfiltered currents reaching 90 cm/s occur north of the CC in 255
the ECC (near 43˚ 15’ N). Southward currents sampled during the first few days after 256
deployment range in 30-40 cm/s. Currents in the anticyclonic circulation around Capraia 257
Island are mostly in the 30-60 cm/s range. In the “stagnant” areas north of Elba Island and in 258
the CC, the speed is bounded by 20 cm/s. Note that high frequency motions, shown as loops 259
in the tracks, are ubiquitous in most of the drifter data. These motions have speeds of 10-20 260
cm/s. Spectral analysis revealed that they correspond to near-inertial oscillations, tidal 261
motions and currents driven by sea breeze. These high frequency motions are not considered 262
in the rest of the paper since the main focus is on dynamics at meso- and submesoscales. 263
264
Pseudo-Eulerian statistics were calculated from the drifter data for the period 3 July to 27 265
August 2010 using bins of 0.05˚ latitude x 0.05˚ longitude. The number of hourly drifter 266
observations in the bins is maximum (in excess of 500) north of Elba Island and in the 267
southern part of the CC (not shown). Mean currents are shown in Fig. 4. for bins with more 268
than 5 hourly observations. The strong anticyclonic circulation around Capraia Island is 269
striking with mean speeds reaching 30 cm/s. This feature is about 60-70 km in diameter and is 270
bounded by 9˚ 30’ E and 10˚ 20’ E in longitude and 42˚ 50’ N and 43˚ 30’ N in latitude. Its 271
center is just to the northeast of Capraia Island. The period of rotation is 5-10 days. In total, 272
eight drifters executed 13 loops in this structure between 19 July and 19 August (one month). 273
Two drifters executed 4 loops each. 274
275
Fig. 5 shows the geographical distribution of the variability of the surface currents with 276
respect to the mean pattern shown in Fig. 4. The eddy kinetic energy (see definition in 277
Poulain, 2001) is low in the eastern part of the study area and in the southern CC. It increases 278
near the northern tip of Corsica and the northern extension of the CC (in the ECC) and the 279
northern limb of the anticyclonic circulation around Capraia Island. 280
281
3.2 Wind forcing, near-surface currents and numerical simulations
282
The COSMO-ME wind products at the grid point nearest the CNR mooring in the CC (43˚ 283
7.5’ N, 9˚ 37.5’ E, see Fig. 1) were considered to study the variability of the near-surface 284
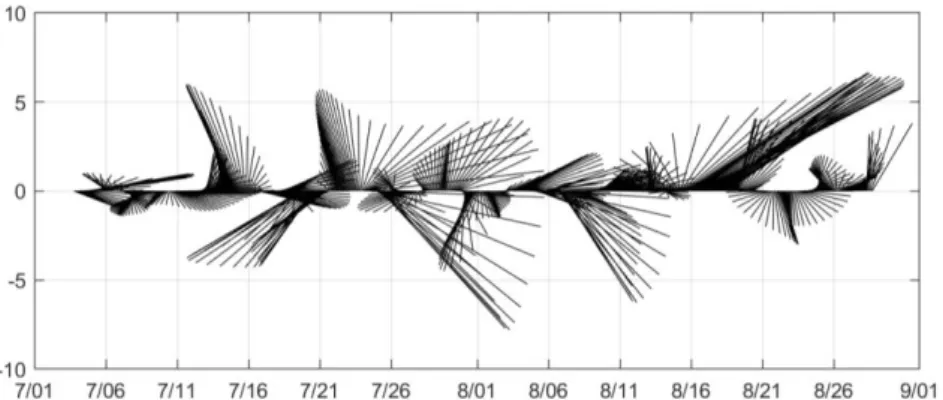
currents related to the wind forcing. As shown in Fig. 6, in addition to daily variations 285
corresponding to sea breeze (see thin curve in middle panel), the wind is alternating between 286
northerly and southerly regimes with a periodicity of about a week. More specifically, major 287
northerly wind events occurred on 19, 24 and 30 July and on 6 and 21 August. On 14, 22 and 288
29 July and 15-16 and 27 August, winds were primarily southerly. Fig. 6 shows that the low-289
pass filtered currents at 32 m depth measured by the mooring in the CC respond to the local 290
wind forcing, i.e., major events of southerly (northerly) winds correspond to increased 291
northward (southward) velocity. The correlation with zero-time lag between the meridional 292
winds and currents is about 0.69, but it increases to 0.71 for a lag of 5 h. This means that the 293
currents are barely delayed with respect to the wind. 294
295
If we plot the pass filtered drifter meridional velocities versus time along with the low-296
pass filtered near-surface meridional flow in the Corsica Channel (Fig. 6, bottom panel), it is 297
striking that most drifter speeds co-vary with the mooring data. In particular, during the 298
events of strong northward flow (and southerly winds) of 13-14, 22-23 and 28-29 July, most 299
drifters are moving northward with speeds up to about 50 cm/s (after low-pass filtering). On 300
18-19, 23-24 and 29-30 July under northerly wind forcing the majority of drifters are moving 301
southward and the upper current in the CC is reversed (southward). Note that the variance of 302
the drifter meridional velocity is much higher than the mooring data mostly due to the spatial 303
variability sampled by the drifters. 304
305
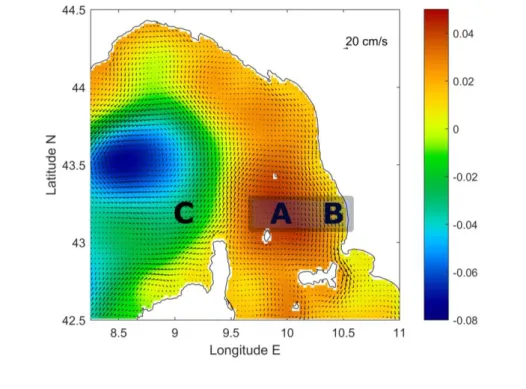
Fig.7 shows the average surface circulation in the Ligurian Sea in July - August 2010 306
produced by ROMS. The two–month average clearly suppresses all short-term variability and 307
the emerging picture is controlled by the permanent features in the area. The overall 308
circulation of the western Ligurian Sea is cyclonic. Surface Atlantic Water (AW) enters the 309
Ligurian Sea from the south, mostly from the Algerian basin through the Western Corsica 310
Current (WCC). As expected in summer, the ECC in the CC is weak, in good agreement with 311
the drifter data (Fig. 4). The resulting current proceeds northward as a geostrophic frontal 312
system becoming the so-called Northern Current (NC) in the northern Ligurian Sea. In the 313
eastern Ligurian Sea, the Capraia anticyclone, identifiable in Fig. 7 by the relative maximum 314
in sea surface elevation, was a robust permanent feature of summer 2010. 315
316
In order to test the relationship with wind impulses, a Capraia Index was defined as the 317
difference in sea surface elevation between points A and B (see location in Fig. 7, top panel); 318
thus, a value close to zero corresponds to a wide shelf current whereas a large positive value is 319
suggestive of a strong anticyclone. The choice of an index that included point C (see Fig. 7) 320
was discarded, as the difference in sea surface elevation with respect to A may be due to a 321
structured boundary current (i.e., the WCC) disregarding the existence of the anticyclone. 322
From the time-series of the Capraia index (Fig. 7, middle panel) it can be seen that (a) the 323
anticyclone grows in intensity from early July to the end of August and (b) significant wind 324
events have the ability to partially or totally suppress the feature, with the noticeable example 325
of the (southwesterly) storm on 14-15 August (see wind speed in Fig. 7 bottom panel). As the 326
wind impulse weakens however, the index is suggestive of a re-emergence of the feature. The 327
southerly wind event around 13-14 July is in good agreement with the reversal of the coastal 328
current revealed by the drifters (Fig. 2). 329
330
3.3 Surface circulation and satellite images
331 332
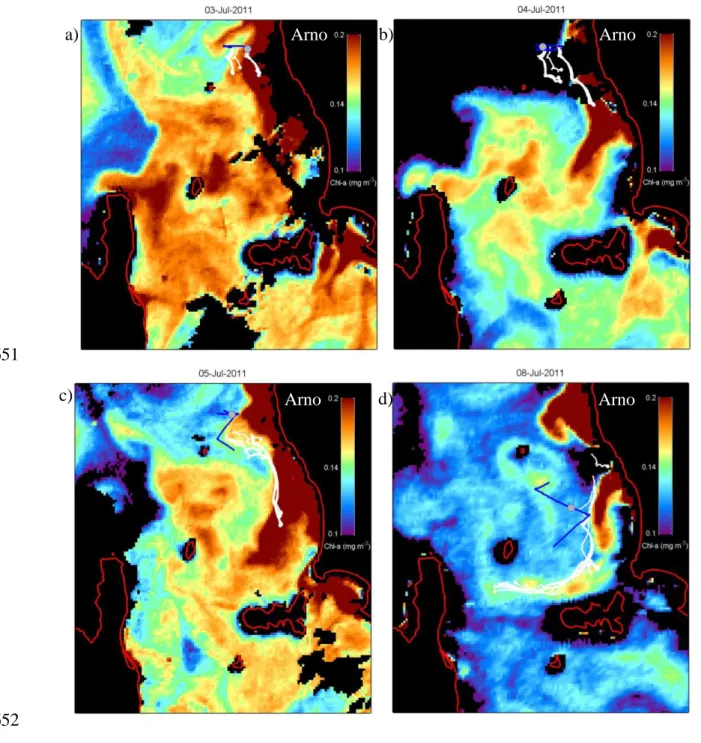
During the period of glider operation (3-20 July) only 8 MODIS images were partially cloud 333
free and provided a useful description of chlorophyll concentration and the associated near-334
surface circulation. On the day of the drifter and glider deployments (3 July), there was a 335
rather well-developed area of water with high chlorophyll concentration off the continental 336
Italian coast from the Arno River mouth to about 43˚N 15’ (Fig. 8a). This increased optical 337
signal is related to the higher nutrients discharged by the river. The significant Arno plume 338
was probably the result of an event on high discharge rate (reaching nearly 200 m3/s) around 339
21 June 2010 (data courtesy of Regione Toscana). The image confirms that the two groups of 340
9 drifters were deployed in and outside the coastal layer. The next two days (4 and 5 July, Fig. 341
8b,c), while all drifters were moving southward, the coastal layer developed two instabilities 342
forming offshore-flowing (and also southward flowing) filaments near 43˚ 25’ N and 43˚ 10’ 343
N. On 8 July (Fig. 8d), these instabilities were well separated in latitude and showed cyclonic 344
veering, that is offshore and southward circulation. The rich water of the southern instability 345
was advected towards Elba Island and then westward towards Corsica. There is a particularly 346
good agreement between the chlorophyll structures and the drifter tracks. 347
348
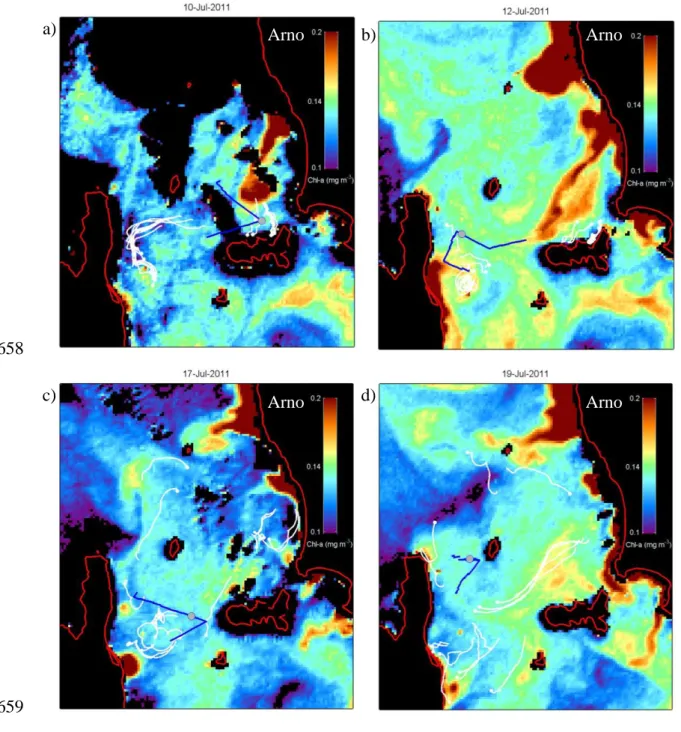
The offshore-flowing instabilities rooted on the Italian continental coast were still present 349
between 10 and 19 July (Fig. 9) with various shapes and offshore extensions. The northern 350
one extended as far as the Gorgona Island. Others developed near and south of Elba Island, 351
but were away from the areas sampled by the drifters and glider. To the west, off Corsica, an 352
instability plume was evident on 12, 17 and 19 July (Fig. 9b,c,d). On 12 July (Fig. 9b) drifters 353
were even trapped in it as it developed more offshore (as far as east as 9˚ 45’ E). 354
355
During its entire mission, the glider protruded in and out of the chlorophyll-rich waters. For 356
instance, on 8 July (Fig. 8d) it encountered richer waters near the surface at both extremities 357
of this southwestward transect. 358
359
3.4 Water mass properties and geostrophic currents in the water column
360 361
The distribution of temperature, salinity and density along the glider track is discussed here 362
below, with main focus on the top 40 m of water where most of the variability occurs. 363
Selected transect (1, 8 and 15, see location in Fig. 1) are considered for the sake of brevity. 364
365
During its entire operation, the glider revealed a near-surface mixed layer extending down to 366
5-10 m (Figs. 10-12) on top of a thermocline spreading between approximately 10 and 40 m. 367
Along the northernmost transect 1 (Fig. 10) the isotherms and isopycnals are inclined 368
(deepening going offshore to the W) and the corresponding geostrophic currents are directed 369
southward. Further to the south, along transect 8 (Fig. 11), the above-mentioned iso-curves 370
are characterized by a concave upward structure. Qualitatively, the geostrophic currents are to 371
the SW in the eastern portion, where the drifters also move to the S and SW (see Fig. 8d). 372
More offshore (to the W) the currents are reversed, thus representing a mesoscale anticyclonic 373
circulation feature. In the southern part of the CC, along the zonal transect 15 (Fig. 12), the 374
isotherms and isopycnals correspond to concave downward. Again this is compatible with the 375
southward motion of the drifters near Corsica, and the usual northward direction of the ECC, 376
which is rather weak in summer. 377
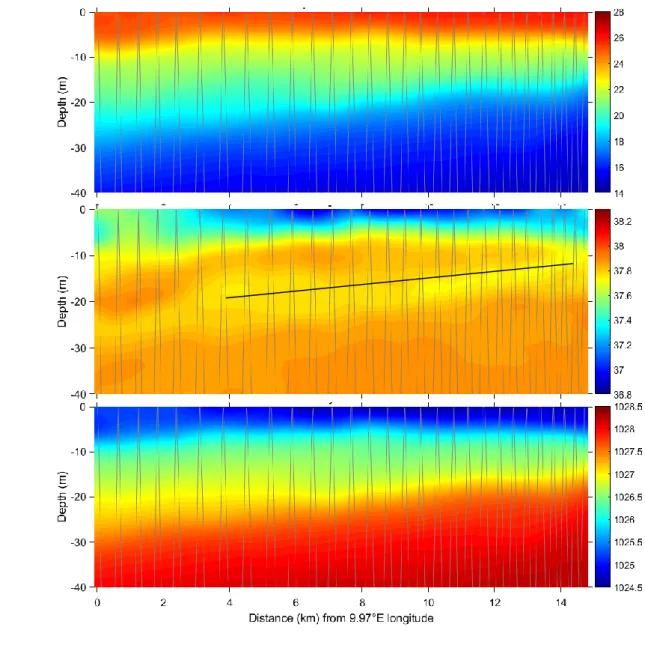
378
Low-salinity water of Arno River origin (as demonstrated before in satellite images) extends 379
almost across the entire section but most importantly for distances larger than 2 km from the 380
westernmost point (Fig. 10). Water with salinity less than 37.6 prevails in the top 5-m layer. 381
Below it, the salinity is gradually increasing and reaching values in excess of 38.0 around 40 382
m depth. This is a signature of the upper core of the Levantine Intermediate Water which can 383
reach salinity of 38.6-38.7 at depths of 300-500 m in the Ligurian Sea (Bosse et al., 2015). 384
Besides the above-described features, the high horizontal resolution of the glider allowed to 385
sample a vein of relatively low salinity (~37.6) expanding offshore along transect 1 (Fig. 10) 386
between 10 and 25 m depth. The inclination of the vein is compatible with the slope of the 387
isopycnals and indicates the subduction of coastal water. 388
Along transect 8 the near surface salinity above 10 m has two minima (near 37.0) at the 390
extremities, corresponding to the Arno River plume extending offshore (to the east), and 391
presumably to the Atlantic Water coming from the CC (to the west). This low-salinity water 392
is also seen in transect 15 across the CC, although a little bit deeper (5-10 m) and capped 393
partially by saltier water. 394
395
In the CC (eastern part of transect 15), the glider data show consistent northward currents in 396
the entire depth range (0-200 m) whereas the mooring currents (Fig. 13) show mostly 397
northward currents above 80 m, with intensification on 13-14, 22 and 29 July and 14-15 398
August. Below, there are 1-2 weeks long periods of flow reversal, the most prominent one 399
lasting from 14 to 25 July and involving the water column up to 60 m depth. The surface 400
northward velocities average was 11.2±7.4 cm/s, while the southward ones were much weaker 401
(-2.8±2.6 cm/s). 402
403 404
4. Discussion and conclusions
405 406
During summer 2010, surface drifters and a glider were operated simultaneously to explore 407
the dynamics of the southeastern Ligurian Sea where the wind forcing, the local 408
geography/bathymetry and the outflow of the Arno River are supposed to affect significantly 409
the circulation and the distribution of the water mass properties. The glider was piloted in 410
order to obtain information in the water column in the area sampled by most of the drifters. 411
Ancillary data were obtained from a permanent mooring in the CC and from satellites 412
(MODIS images of chlorophyll concentration). In addition, a ROMS numerical model was 413
used to simulate the local dynamics and to help with the interpretation of the collected data. 414
The drifters revealed a surface circulation strongly affected by the local winds. Southward 416
currents dominated off the Italian continental coast. These currents reversed on 13-14 July due 417
to a change in wind direction, changing to southerly. The fluctuation of surface currents 418
between the southward and northward directions is seen in the drifter tracks over the entire 419
study area (in particular in the vicinity of Capraia Island) and in the near-surface records of 420
the mooring in the CC (see Fig. 6) during July and August 2010. The typical period of these 421
oscillations is one week. 422
423
Some drifters eventually depicted a strong anticyclonic circulation pattern centered on 424
Capraia Island (the Capraia anticyclone) starting on 20 July. The rotation period of these 425
drifters is 5-10 days, that is, slightly longer than the value (3 days) reported by Poulain et al. 426
(2012). Both drifters (Fig. 2) and the simulated sea surface height (Capraia index in Fig. 7) 427
showed an enhancement of the Capraia anticyclone in late July and August, only interrupted 428
by a storm on 14-15 August. This trend is related to the increase of negative vorticity of the 429
winds from July to August (not shown). On 14-15 August, strong winds from the SW 430
disrupted this trend and the anticyclone essentially vanished. In conclusion, ROMS numerical 431
model successfully simulated the occurrence of the Capraia anticyclone as a semi-permanent 432
and strengthening feature during July-August 2010, corroborating the hypothesis of the 433
significant role played by wind-storms in perturbing this eddy as well as the surface 434
circulation in the area. 435
436
The southward coastal currents advected the plume of the Arno River and associated 437
filaments of nutrient-rich waters towards the south, forming a layer of high chlorophyll 438
concentration along most of the Italian continental coast. This layer became unstable and 439
offshore-flowing filaments were generated typically at two locations between the Arno mouth 440
and Elba Island (see for instance Fig. 8d.). The northernmost filament reached almost the area 441
near Gorgona Island (Fig. 9d) and the southern one was advected near the northern coast of 442
Elba Island, into the CC and around Capraia Island (Fig. 8c,d). 443
444
The temperature, salinity and density data provided by the glider between 3 and 20 July 2010 445
show stratified conditions typical of summer with a surface mixed layer down to 10-20 m, a 446
thermocline expanding down to a maximum depth of 40 m. In terms of salinity, horizontal 447
variability (fronts) associated with the Arno plume and/or the AW occur along most transects. 448
For the Arno plume and its extension into offshore-flowing filaments, there is a good 449
agreement between the satellite chlorophyll images and the glider data. In the thermocline, an 450
inclined intrusion of fresher water (probably of Argo River origin) observed in transect 1 (Fig. 451
10) corresponds to subduction along isopycnals. Below 40 m, the increase of salinity with 452
depth represents the upper part of the LIW. 453
454
Currents measured at the CNR mooring in the CC corroborated the fluctuations of the near-455
surface circulations with events of northward flow on 13-14, 22 and 29 July and 14-15 August 456
also experienced by the drifters (Fig. 13). Deeper in the water column, southward reversing 457
flow was observed for longer period (1-2 weeks) and rather independently from the surface 458
variability. These flow reversal events have already been reported by Astraldi et al. (1990). 459
They are not forced by the local winds but are probably related to the sea level difference 460
between the Tyrrhenian and Ligurian Sea. 461
462
The combined use of data provided by mobile and fixed autonomous instruments (drifters, 463
glider, mooring), by environmental satellites and numerical simulations in the southeastern 464
Ligurian Sea exemplifies an efficient way of collecting oceanographic data in this complex 465
sea area at relatively low costs. Obviously, a better sampling approach could have involved 466
data collection with more than one glider, the deployment of fixed moorings at key locations, 467
and an extensive survey of the entire study area with a research vessel. The study of coastal 468
dynamics as described in this paper, nevertheless, is a good example of multi-platform and 469
multi-parameter approach, which is the future paradigm in observational oceanography. 470
471
Acknowledgements
472 473
The authors are grateful to all the people who helped with the drifter and glider 474
deployment/recovery operations and with the data processing, and in particular to P. Zanasca, 475
A. Bussani, M. Menna, I. Mancero-Mosquera and K. Mahiouz. The drifters used in LIDEX10 476
were kindly provided by the NATO NURC Center (La Spezia, Italy), CNR, University 477
Parthenope of Naples and OGS. The glider (TENUSE) was contributed by LOCEAN. The 478
satellite data were downloaded from https://modis.gsfc.nasa.gov/data/dataprod/ . ODAS wind 479
data were provided by the EU FP7 EuroSITES project. COSMO-ME data were kindly made 480
available by CNMCA in Rome, Italy. Arno River data are courtesy of Servizio Idrologico – 481
Regione Toscana. E. Z and P. F acknowledge support from the Parthenope University 482
individual and group research funding. 483
484 485
486
References
487 488
Alvarez, A., Chiggiato, J., Mourre, B., 2012. Robotic characterization of access-restricted 489
marine environments. IEEE Rob. Autom. Mag., 20 (3), 42-49. 490
491
Astraldi, M., Gasparini, G.P., Manzella, G.M.R., Hopkins, T.S., 1990. Temporal variability of 492
currents in the eastern Ligurian Sea, J. Geophys. Res., 95(C2), 1515–1522. 493
494
Astraldi, M., Gasparini, G.P., 1992. The seasonal characteristics of the circulation in the 495
North Mediterranean basin and their relationship with the atmospheric climatic conditions. J. 496
Geophys. Res., 97 (C6), 9531-9540. 497
498
Bosse, A., Testor, P., Mortier, L., Prieur, L., Taillandier, V., d’Ortenzio, F., Coppola, L., 499
2015. Spreading of Levantine Intermediate Waters by submesoscale coherent vortices in the 500
northwestern Mediterranean Sea as observed with gliders, J. Geophys. Res. Oceans, 120, 501
1599–1622, doi:10.1002/ 2014JC010263. 502
503
Bouffard, J., Vignudelli, S., Cipollini, P., Menard, Y., 2008. Exploiting the potential of an 504
improved multimission altimetric data set over the coastal ocean, Geophys. Res. Lett., 35, 505
L10601, doi: 10.1029/2008GL033488. 506
507
Ciuffardi, T., Napolitano, E., Iacono, R., Reseghetti, F., Raiteri, G., Bordone, A., 2016. 508
Analysis of surface circulation structures along a frequently repeated XBT transect crossing 509
the Ligurian and Tyrrhenian Seas. Ocean Dynam., 66(6–7), 767–83. 510
Haidvogel, D.B., Arango, H., Budgell, W.P., Cornuelle, B.D., Curchitser, E., Di Lorenzo, E., 512
Fennel, K., Geyer, W.R., Hermann, A.J., Lanerolle, L., Levin, J., McWilliams, J.C., Miller, 513
A.J., Moore, A.M., Powell, T.M., Shchepetkin, A.F., Sherwood, C.R., Signell, R.P., Warner, 514
J.C., Wilkin, J., 2008. Ocean forecasting in terrain-following coordinates: Formulation and 515
skill assessment of the Regional Ocean Modeling System. J. Comput. Phys., 227: 3595-3624. 516
517
Manzella, G., 1985. Fluxes across the Corsica Channel and coastal circulation in the East 518
Ligurina Sea. Morth-Western Mediterranean, Ocean. Acta, 8 (1), 29-35. 519
520
Marchesiello, P., McWilliams, J. C., Shchepetkin, A. F., 2001. Open boundary conditions for 521
long-term integration of regional oceanic models. Ocean Modell., 3, 1–20. 522
523
Menna, M., Gerin R., Bussani A., Poulain P.-M., 2017. The OGS Mediterranean Drifter 524
Dataset: 1986-2016. Rel. OGS 2017/92 Sez. OCE 28 MAOS, OGS, Trieste, Italy. 525
526
Mourre, B., Chiggiato, J., 2014. A comparison of the performance of the 3-D super-ensemble 527
and an ensemble Kalman filter for short-range regional ocean prediction. Tellus A, 66, 21640. 528
529
Mourre, B., Chiggiato, J., Lenartz, F., Rixen, M., 2012. Uncertainty forecast from 3-D super-530
ensemble multi-model combination: Validation and calibration. Ocean Dynam., 62(2): 283-531
294. 532
533
Oddo, P., Adani, M., Pinardi, N., Fratianni, C., Tonani, M., and Pettenuzzo, D., 2009. A 534
nested Atlantic-Mediterranean Sea general circulation model for operational forecasting, 535
Ocean Sci., 5, 461-473, doi:10.5194/os-5-461-2009. 536
Onken, R., Robinson, A.R., Kantha, L., Lozano, C.J., Haley, P.J., Carniel S. 2005. A rapid 538
response nowcast/forecast system using multiply-nested Ocean models and distributed data 539
systems, J. Mar. Sys., 56, 45-66. 540
541
Pinardi, N., Masetti, E. 2000. Variability of the large-scale general circulation of the 542
Mediterranean Sea from observations and modelling: a review. Palaeogeography, 543
Palaeoclimatology, Palaeoecology, 158, 153-173. 544
545
Pinardi, N., Arneri E., Crise A., Ravaioli M., Zavatarelli M. 2006. The physical, sedimentary 546
and ecological structure and variability of shelf areas in the Mediterranean Sea. In: A. R. 547
Robinson and K. Brink (eds.), The Sea, Vol. 14 Harvard University Press, Cambridge, USA, 548
1245-1330. 549
550
Poulain, P.-M. 1999. Drifter observations of surface circulation in the Adriatic Sea between 551
December 1994 and March 1996, J. Mar. Syst., 20, 231-253. 552
553
Poulain, P.-M. (2001), Adriatic Sea surface circulation as derived from drifter data between 554
1990 and 1999, J. Marine Sys., 29, 3-32. 555
556
Poulain P.-M., Gerin R., Rixen M., Zanasca P., Teixeira J., Griffa A., Molcard A., De Marte, 557
M., Pinardi N. 2012. Aspects of the surface circulation in the Liguro-Provençal basin and 558
Gulf of Lion as observed by satellite-tracked drifters (2007-2009), Boll. Geofis. Teor. Appli., 559
53(2), 261-279. 560
561
Poulain, P.-M. Gerin, R. 2019. Assessment of the water-following capabilities of CODE 562
drifters based on direct relative flow measurements. J. Atmos. Ocean Tech., 36(4), 621-633, 563
doi: 10.1175/JTECH-D-18-0097.1 564
565
Vignudelli, S., Gasparini, G.P., Astraldi, M., Schiano, M.E. 1999. A possible influence of the 566
North Atlantic Oscillation on the circulation of the Western Mediterranean Sea, Geophys. 567
Res. Lett., 26 (5), 623-626. 568
569
Vignudelli, S., Cipollini, P., Astraldi, M., Gasparini G.P., Manzella, G., 2000. Integrated use 570
of altimeter and in situ data for understanding the water exchanges between the Tyrrhenian 571
and Ligurian Seas. J. Geophys. Res., 105 (C8), 19649-19663. 572
573
Shchepetkin, A.F., McWilliams, J.C., 2005. The regional ocean modelling system: a split-574
explicit, free-surface, topography-following-coordinates ocean model. Ocean Modell. 9, 347– 575
404. 576
577
Vignudelli, S., Cipollini, P., Roblou, L., Lyard, F., Gasparini, G.P., Manzella G., Astraldi, M. 578
2005. Improved satellite altimetry in coastal systems: Case study of the Corsica Channel 579
(Mediterranean Sea), Geophys. Res. Lett., 32, L07608, doi:10.1029/2005GL022602. 580
581
Schroeder, K., Chiggiato, J., Haza, A.C., Griffa, A., Özgökmen, T.M., Zanasca, P., Molcard, 582
A., Borghini, M., Poulain, P.-M., Gerin, R., Zambianchi, E., Falco, P., Trees, C. 2012. 583
Targeted Lagrangian sampling of submesoscale dispersion at a coastal frontal zone. Geophys. 584
Res. Lett., 39, L11608, doi:10.1029/2012GL051879.
586
Figure 1. Geography and bathymetry of the study area in the southeastern Ligurian and 587
Corsica Channel. The Gorgona (G), Capraia (C) and Pianosa (P) islands are shown in addition 588
to the Elba Island. The location of the CNR mooring is shown with a cyan triangle. The 589
deployment locations of the drifters (red dots) and glider (green square) are also indicated. 590
The glider track is shown in magenta, including the 3 transects (1, 8 and 15) described in the 591
paper. Bathymetry is contoured (100 and 200 m) and shown with blue shades (m). 592
594
595
Figure 2. Two-day long drifter (red: coastal group; blue: outer group; green: intermediate 596
drifter) and glider (black) track segments, with dot corresponding to the end of the second 597
day, between 3 and 20 July. Cumulative tracks are shown in light grey shade. 598
600 601 602 Figure 2. Continued. 603 604
605 606 Figure 2. Continued. 607 608 609
610
611
Figure 3. Drifter trajectories for the period 3 July – 27 August 2010 color-coded as a function 612 of drifter speed (cm/s). 613 614 615 616 617 618 619
620
621 622
Figure 4. Mean surface circulation (arrows) and mean kinetic energy (colors, cm2/s2) in study 623
area for the period 3 July – 27 August 2010 using bins of 0.05º x 0.05º. Bins with less than 5 624
hourly observations were omitted. 625
626 627
628
629
Figure 5. Kinetic energy per unit mass of the velocity residuals or eddy kinetic energy (EKE, 630
cm2 s-2) in study area for the period 3 July – 27 August 2010 using bins of 0.05º x 0.05º. Bins 631
with less than 5 hourly observations were omitted. 632
633 634 635
636
Figure 6. Stick diagram of the low-pass filtered COSMO-ME 10-m winds at grid point 43˚ 637
7.5’ N, 9˚ 37.5’ E in the CC between 3 July and 27 August 2010 (top panel). Full (thin curve) 638
and low-pass filtered (tick curve) COSMO-ME 10-m wind meridional component at the same 639
location (middle panel). Low-pass filtered near-surface velocities at 32 m in the CC from 640
mooring data (thick curve) and low-pass filtered velocities (light grey stars) of all the drifters 641
in the study area (bottom panel). 642
644
Figure 7. Ligurian Sea average circulation in July-August 2010 as simulated by ROMS (top 645
panel). Colour is sea surface height (m) and arrows surface currents. Evolution of the daily 646
average of the Capraia Index (m; middle panel) confronted to the daily average of COSMO-647
ME 10-m wind speed (m/s) at the ODAS buoy location and the measured ODAS 10-m wind 648
speed (bottom panel). 649
651
652
Figure 8. MODIS images of chlorophyll concentration on 3, 4, 5 and 8 July 2010, 653
superimposed with centered 2-day long trajectories of drifters (white) and glider (blue). The 654
gray dot represents the location of the glider at 12 GMT, contemporaneous with the satellite 655 images. 656 657 a) b) c) Arno d) Arno Arno Arno
658
659 660
Figure 9. Same as Figure 8 but for 10, 12, 17 and 19 July 2010. 661 662 c) d) a) b) Arno Arno Arno Arno
663
664
665 666
Figure 10. Contour plots of temperature (°C, top), salinity (middle) and density (kg/m3, 667
bottom) versus depth and horizontal distance along glider transect 1. The origin is the 668
westernmost location and the glider yo-yo track is shown with light grey lines. In the middle 669
panel, a black line indicate subduction of less saline water along the isopycnals. 670
671
672
673 674
Figure 11. Same as in Figure 10 but for glider transect 8. 675 676 677 678 679 680 681
682
683
684 685
Figure 12. Same as in Figure 10 but for glider transect 15. 686
687 688
Figure 13. Meridional velocity (cm/s) measured by the moored ADCP in the CC (positive 689
northward) as a function of time and depth above 200 m depth. The uppermost ADCP cell 690
was excluded. The null value is contoured with black curves. 691
693