HAL Id: hal-00299082
https://hal.archives-ouvertes.fr/hal-00299082
Submitted on 9 Mar 2004
HAL is a multi-disciplinary open access
archive for the deposit and dissemination of
sci-entific research documents, whether they are
pub-lished or not. The documents may come from
teaching and research institutions in France or
abroad, or from public or private research centers.
L’archive ouverte pluridisciplinaire HAL, est
destinée au dépôt et à la diffusion de documents
scientifiques de niveau recherche, publiés ou non,
émanant des établissements d’enseignement et de
recherche français ou étrangers, des laboratoires
publics ou privés.
Bíldudalur, NW-Iceland
R. Bell, T. Glade
To cite this version:
R. Bell, T. Glade. Quantitative risk analysis for landslides ? Examples from Bíldudalur, NW-Iceland.
Natural Hazards and Earth System Science, Copernicus Publications on behalf of the European
Geo-sciences Union, 2004, 4 (1), pp.117-131. �hal-00299082�
© European Geosciences Union 2004
and Earth
System Sciences
Quantitative risk analysis for landslides – Examples from
B´ıldudalur, NW-Iceland
R. Bell and T. Glade
Department of Geography, University of Bonn, Meckenheimer Allee 166, 53115 Bonn, Germany
Received: 24 September 2003 – Revised: 9 February 2004 – Accepted: 13 February 2004 – Published: 9 March 2004 Part of Special Issue “Landslide and flood hazards assessment”
Abstract. Although various methods to carry out quanti-tative landslide risk analyses are available, applications are still rare and mostly dependent on the occurrence of disas-ters. In Iceland, two catastrophic snow avalanches killed 34 people in 1995. As a consequence the Ministry of the En-vironment issued a new regulation on hazard zoning due to snow avalanches and landslides in 2000, which aims to pre-vent people living or working within the areas most at risk until 2010. The regulation requires to carry out landslide and snow avalanche risk analyses, however, a method to calculate landslide risk adopted to Icelandic conditions is still missing. Therefore, the ultimate goal of this study is to develop such a method for landslides, focussing on debris flows and rock falls and to test it in B´ıldudalur, NW-Iceland.
Risk analysis, beside risk evaluation and risk management, is part of the holistic concept of risk assessment. Within this study, risk analysis is considered only, focussing on the risks to life. To calculate landslide risk, the spatial and temporal probability of occurrence of potential damaging events, as well as the distribution of the elements at risk in space and time, considering also changing vulnerabilities, must be de-termined.
Within this study, a new raster-based approach is devel-oped. Thus, all existent vector data are transferred into raster data using a resolution of 1 m×1 m. The specific attribute data are attributed to the grid cells, resulting in specific raster data layers for each input parameter. The calculation of the landslide risk follows a function of the input parameters haz-ard, damage potential of the elements at risk, vulnerability, probability of the spatial impact, probability of the temporal impact and probability of the seasonal occurrence. Finally, results are upscaled to a resolution of 20 m×20 m and are presented as individual risk to life and object risk to life for each process. Within the quantitative landslide risk analysis the associated uncertainties are estimated qualitatively.
Correspondence to: R. Bell ([email protected])
In the study area the highest risks throughout all of the analyses (individual risk to life and object risk to life) are caused by debris flows, followed by rock falls, showing that risk heavily varies depending on the process considered. The resultant maps show areas, in which the individual risk to life exceeds the acceptable risk (defined in the aforemen-tioned regulation), so that for these locations risk reduction measures should be developed and implemented. It can be concluded that the newly developed method works satisfac-tory and is applicable to further catchments in Iceland, and potentially to further countries with different environmental settings.
1 Introduction
Many settlements in Iceland are endangered by various
nat-ural hazards. In 1995 two catastrophic snow avalanches
caused altogether 34 fatalities. As a consequence,
pre-existing snow avalanche and landslide regulations were com-pletely revised and the “Regulation No. 505/2000 on hazard zoning due to snow- and landslides, . . . ” was issued by The Ministry of the Environment (2000). The regulation demands snow avalanche and landslide risk assessments to be carried out. Acceptable individual risk to life levels have been de-fined and three different risk zones are distinguished. Risk zone A is determined by a risk of 0.3−1×10⁻⁴, risk zone B by a risk of 1−3×10⁻⁴ and risk zone C by a risk over 3×10⁻⁴. It is a very strict regulation, with the ultimate aim to prevent the use of the areas most at risk until 2010.
Within the study area, the dominating landslide types, threatening the people, are debris flows and rock falls (land-slide terminology refers to Cruden and Varnes, 1996 and Dikau et al., 1996).
Within this study, a scientific approach is used to calculate the risks (modified after Varnes, 1984 and Fell, 2000). Risk (R) is a function of the probability of a hazardous event (H) and its consequences (C):
What could happen? What could happen if something
changes?
What could happen, and where? (and if something changes?) What could happen, and when?
(and if something changes?) What could happen, when and
where? (and if something changes?)
Risk analysis Risk evaluation
Risk management
What is allowed to happen? What must not happen? Who is affected? Who has to decide?
What is to be done? What can be done? What are the alternatives? Who is paying?
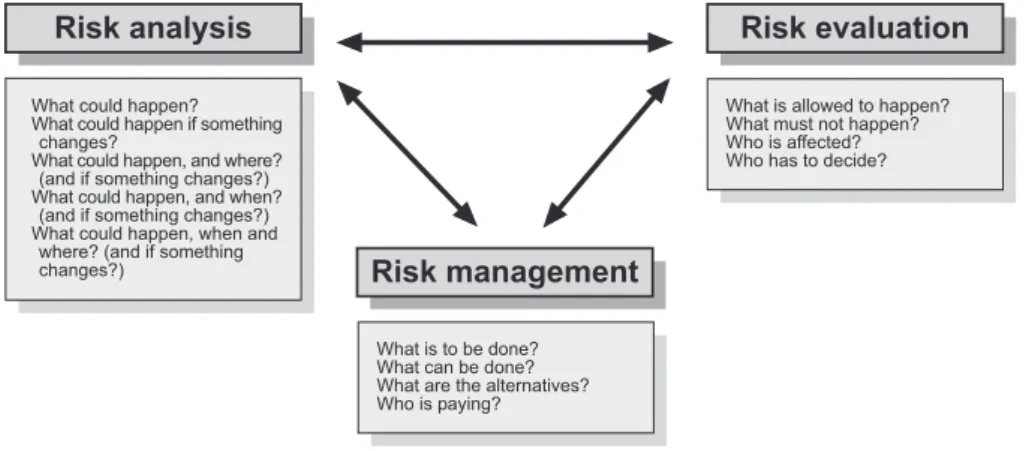
Fig. 1. The holistic concept of risk assessment (based on Glade, 2001; Heinimann, 1999; Hollenstein, 1997 and Kienholz, 1993).
Risk = Natural hazard × Consequence × Elements at Risk (R = H × C × E),
with natural hazard defined as the probability of occur-rence of a potentially damaging phenomenon within a spec-ified period of time, within a given area and a given magni-tude, consequence meaning the (potential) outcomes arising from the occurrence of a natural phenomenon (including the vulnerability, the probability of temporal and spatial impact as well as the probability of seasonal occurrence) and the el-ements at risk referring to people, houses, etc.
A method for snow avalanche risk analysis in Iceland was developed by J´onasson and Sigurdsson (1999), fol-lowed by rough guidelines on how to integrate results from landslide hazard assessments into a comprehensive land-slide and snow avalanche risk assessment (J´ohannesson and
´
Ag´ustsson, 2002). As a suitable methodology to calculate the landslide risk to individual life is still missing, it is the aim of this study to develop such a methodology and to finally apply it in B´ıldudalur (NW-Iceland). Furthermore, the object risk to life (taking all people at a building into account) is calculated and compared with the individual risk to life.
2 Risk assessment
From a social scientific point of view any form of “natu-ral risk” is produced by humans themselves. What is often called a natural disaster is not caused by nature (or natural phenomenon) but is the result of a bad or false adaptation to nature (Dombrowsky, 2001). Usually, when a natural disas-ter happens complex systems are involved. This means that no easy, no one-sided solutions can be found. To tackle the problems thoroughly, holistic concepts are essential.
Such holistic concepts were developed to natural risks (Hollenstein, 1997), and particularly to landslide risk (for ex-ample, Fell, 2000; Einstein, 1997; Fell and Hartford, 1997; Leroi, 1996; Einstein, 1988).
The entire risk assessment comprises three equal parts: risk analysis, risk evaluation and risk management (Fig. 1). Risk analysis is a method to estimate and display the risk in
a given environmental setting. It is mostly approached using methods based on engineering and natural science (Glade, 2002). For risk evaluation social scientific methods are ap-plied to identify risk perception and acceptance of the in-volved people. Risk management combines the results of risk analysis and risk evaluation to find the “best” solution. Figure 1 displays the risk assessment concept. The questions presented are characterising the main focus of each part.
Within this study, risk analysis alone is considered. Risk analysis can be carried out at a national, regional or
lo-cal slo-cale. The work-scale should be chosen on basis of
the purpose of the assessment, the extent of the study area, data availability (Aleotti and Chowdhury, 1999) and financial and/or time constraints.
Working on a specific scale a problem may arise: the dif-ferent input data layers may be only achievable at various scales. If this is the case final results should only be dis-played at the scale of the input data layer with the lowest resolution. Otherwise an accuracy is displayed which does not exist in reality. Moreover, the scale of investigation often determines the methods to use.
Risk analysis can be done either in a qualitative, semiquan-titative or quansemiquan-titative manner (Heinimann, 1999). Dai et al. (2002, p.67) pointed out “whether qualitative or quantita-tive assessments are more suitable depends on both the de-sired accuracy of the outcome and the nature of the problem, and should be compatible with the quality and quantity of available data”. Fell and Hartford (1997) emphasized that us-ing descriptive terms may be the most appropriate approach and is quite acceptable, but difficulties arise in application where there is a potential for risk to life. Michael-Leiba et al. (2000) stressed that quantitative risk analysis can be more effectively communicated and allows for more effective sup-port management strategies and additional comparisons.
Applications of risk analysis include, but are not limited to, examples in Germany (Glade, 2004b), Italy (Cardinali et al., 2002; Aleotti et al., 2000; Eusebio et al., 1996; Carrara, 1993), Australia (Flentje and Chowdhury, 2000; Michael-Leiba et al., 2000), Hong Kong (Lee et al., 2000; Hard-ingham et al., 1998; Smallwood et al., 1997), Switzerland
Attributing respective values: vulnerability of people (Vpe) and property (Vp), number of people (Epe) and probability
of temporal impact (Pt)
Attributing respective values: Hazard (H) Estimating the recurrence interval of df and rf
Scope definition (Ch. 3.2), Hazard identification (Ch. 3.3)
Digital base map 1:5000
Defining elements at risk
Consequence Analysis (Ch. 3.5) Hazard Analysis (Ch. 3.4)
Risk Calculation (Ch. 3.6)
Calculating risk: a) Object risk to life, b) Individual risk to life
a) Object risk to life b) Individual risk to life
Debris flow Rock fall Debris flow Rock fall
Summarise and rescale Summarise and rescale Debris flow risk Rock fall risk Debris flow risk Rock fall risk
Debris flow Rock fall
Debris flow Rock fall Debris flow (df) run-out map
1:5000 Rock fall (rf) run-out map1:5000
Transfering into raster data Other factors Transfering into raster data probability of spatial impact (Ps) probability of seasonal occurrence (Pso) 2*10* 50* 10*100* 150* 2*10* 50* 10*100* 150* 2*10* 50* 10*100* 150* 2*10* 50* 10*100* 150*
*= return period in years
Vp Vpe Epe Pt
Vp Vpe
Epe Pt
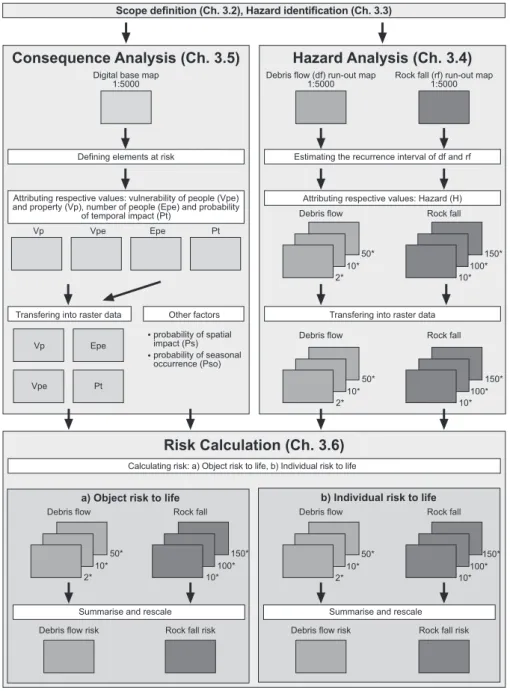
Fig. 2. Methodological concept of landslide risk analysis (details are given in referred sections).
(Heinimann, 1999), India (Anbalagan and Singh, 1996), and United States (Morgan et al., 1992). Although all studies cover landslide risk analysis, applied methodologies are case dependent and differ significantly. Therefore it is important to describe the applied methodology in detail.
3 Methodology
A new raster based method on a regional scale was developed using recent approaches to risk analysis (Glade and von Dav-ertzhofen, submitted; Heinimann, 1999; Fell and Hartford, 1997; Fell, 1994; Morgan et al., 1992). Within this approach, risk analysis consists of the following steps: scope definition,
hazard identification, hazard analysis, consequence analysis and risk calculation.
3.1 General considerations
Risk to life can be analysed using specific raster data lay-ers for each input factor. These are multiplied following the risk formulas mentioned further below. The input factors are: probability of a hazardous event (hazard (H )), probability of spatial impact of a hazardous event (Ps), probability of
tem-poral impact of a hazardous event (Pt), probability of
sea-sonal occurrence of a hazardous event (Pso), elements at risk
(of buildings (Vp)and of people (Vpe)). All this information
was then stored in ARC/INFO coverages (vector data). Us-ing a raster based approach all vector data were transferred into raster data with a cell resolution of 1 m×1 m. This reso-lution ensured that the elements at risk were well represented in the calculation. Risk was calculated for all natural pro-cesses with their respective hazard classes. To ascertain the actual risk caused by a single process, all risk layers calcu-lated for the different hazard classes must be summarised.
Considering that the resulting risk should only be dis-played in the resolution such as the one factor with the lowest resolution (within this study: the hazard factor) it was nec-essary to upscale the resulting risk map. This was carried out by using the BLOCKMAJORITY command in Arc/Info. This algorithm seeks for a value most often attributed to each gridcell within a defined block and this value is then used in all of the gridcells of that block. Within this study, a final resolution of 20m x 20m was used. This size was chosen be-cause it is a good compromise between areal extent, degree of detail and the required level of upscaling.
The resultant risk is displayed in loss of life per year (ob-ject risk to life) and loss of life of an individual per year (in-dividual risk to life). The general concept is given in Fig. 2. The following chapters gives details to the procedure.
3.2 Scope definition
The aim of the study and the scale of investigation were de-fined. The study area was delimited geographically and the damage sources (the different potential hazardous processes) and the damage types (for example death of people or dam-age to buildings) were determined.
3.3 Hazard identification
Within this step the specific types of landslide processes and their spatial pattern must be identified. This was carried out in this study by geomorphological field work, interpreting of aerial photographs, and analysis of historical data. The resultant maps were a geomorphological map, providing a comprehensive overview on the general setting, the structure of the natural system and the acting processes, and two spe-cific process maps, a debris flow map and a rock fall map, which give detailed information on the spatial distribution and state of activity of the respective processes (Glade and Jensen, 2004).
3.4 Hazard analysis
After the threatening processes were identified in detail, it was necessary to determine the hazard caused by these pro-cesses using process modelling. Empirical and process based approaches were used for debris flows and rock fall mod-elling, respectively, resulting in specific run-out maps (for details see Glade, 2004a; Glade and Jensen, 2004). These run-out maps were used as a basis for hazard analysis within this study. The hazard zones were determined based on the recurrence interval of the respective processes only. That
means that high frequency and low magnitude events result in a high hazard zone. The medium hazard zone is deter-mined by a medium frequency and medium magnitude event and a low hazard zone by a low frequency and high magni-tude event. In reference to debris flows their frequency was roughly determined by the recurrence interval of triggering rainstorms used in the run-out calculations. It is, however, a worst case scenario because it presupposes that there is always enough sediment stored on the slopes or in the gul-lies, which is available for debris flows (Glade, 2004a). De-tailed investigations of sediment availability and rates of sed-iment supply could not be carried out within this study, but such studies are vital to improve the defined hazard levels. In reference to rock falls, the recurrence interval of differ-ent sized boulders used in the run-out calculations was esti-mated based on field investigations, giving information on how many boulders of each size have fallen since settle-ment in B´ıldudalur started. Additionally, historical sources have been reviewed (P´etursson, 2000). Both information are used to estimate the minimum recurrence interval of rock falls. A problem within historical records is that they are mostly limited to damaging events, thus underestimating real rock fall occurrence. This is best demonstrated in the study area B´ıldudalur. Whereas field investigations show numer-ous fallen boulders, only one rock fall event is listed in the historical landslide database. Although this is a general prob-lem of the usage of historical data in any natural hazard and risk assessment (Glade et al., 2001), it does neither reduce the importance of such sources nor respective analysis. No doubt, the results are a rather rough estimation of hazard and further investigations should be carried out to improve hazard and risk assessments.
For each hazard class (low, medium and high hazard) of each process an own hazard data layer was created.
3.5 Consequence analysis
Consequence analysis consists of the following steps: the definition of elements at risk, vulnerability analysis and the determination of the probabilities of spatial impact, seasonal occurrence and temporal impact. They are described in detail in the following subchapters.
3.5.1 Definition of elements at risk
The definition of elements at risk heavily depends on the scope of the study. A first rough definition of elements at risk was carried out during the field investigations in B´ıldudalur. The definition of elements at risk corresponds to the scale of investigation, and furthermore, is limited due to data con-straints. Detailed information on the defined elements at risk was given by several Icelandic institutions and companies, and through personal interviews.
Detailed digital basic maps at the scale of 1:5000 were used, including ARC/INFO coverages of buildings. Using a raster data based method, specific vector data layers of el-ements at risk were transformed into raster data, attributing
0 100 km 24° 22° 20° 18° 16° 14° 66° 64° Arnarfjörður Suðurfirðir Bíldudalur Bíldudalsvogur Tálknafjörður Hálfdán Fig. 4
Fig. 3. Location of the study area B´ıldudalur (Arrow gives view direction of Fig. 4).
the number of residents or employees of each building to re-spective gridcells. A data layer was created representing the spatial pattern of residents and employees.
3.5.2 Probability of spatial impact
If a hazardous event occurs, it only affects some parts of the study area. Thus, the probability of the spatial impact must be determined. The probability was estimated based on ge-omorphological and process mapping, analysis of historical data and literature study. The probability depends on the con-sidered process and its magnitude. The creation of additional input data layers did not seem to be necessary because this factor could be more easily integrated into the risk formula, just as another multiplying factor. This became possible due to calculating specific risk layers for each hazard class for which this factor is constant.
3.5.3 Probability of seasonal occurrence
Natural phenomena may occur within specific seasons only (for example: snow avalanches occur during periods with snow cover only). Therefore, the probability of seasonal occurrence of the natural phenomena needed to be ascer-tained. Within this study, the probability was roughly esti-mated based on analysis of historical events.
3.5.4 Probability of temporal impact
Analysing the risk to life another important factor is neces-sary to estimate the risk reliably: the probability of tempo-ral impact. Whereas buildings are always 100% (all day, all year) exposed to the threats of natural phenomena, people are not. Therefore, the duration people are staying in their houses or working in a factory for instance, or even pupils attending in schools need to be determined. This was carried out by using values mentioned in national regulations (The
Ministry of the Environment, 2000), values used in other studies (for example, Heinimann, 1999) and by personal in-terviews (in the period September–December 2000).
3.5.5 Vulnerability analysis
Internationally, only very little work has been carried out on spatial assessment of vulnerability. Therefore reliable val-ues of vulnerability for each element at risk given a sin-gle process and a specific magnitude are rare. To deter-mine respective levels of vulnerability of people and build-ings, the available literature was studied (results are given in Glade, 2004b), information found was analysed, modified and adapted to Icelandic conditions. Regarding vulnerability of buildings, no detailed investigations on the building types could be carried out during this study. Therefore, general information on houses in endangered towns are transferred from J´onasson and Sigurdsson (1999). It is stated that most of these houses are fairly weak timber or concrete houses with relatively large windows built towards the mountain-side. Vulnerability of people in buildings was given by the multiplication of the vulnerability of buildings and the vul-nerability of people. However, no new data layer was created for vulnerability of people in buildings, as the two basic vul-nerability layers were used in the calculation.
3.6 Risk calculation
All information layers were multiplied to calculate the vari-ous risks caused by debris flows and rock falls. The follow-ing risk formulas were applied (adapted from Morgan et al., 1992):
R = (H ×C×E), (1)
with
H = probability of occurrence of a potentially damaging
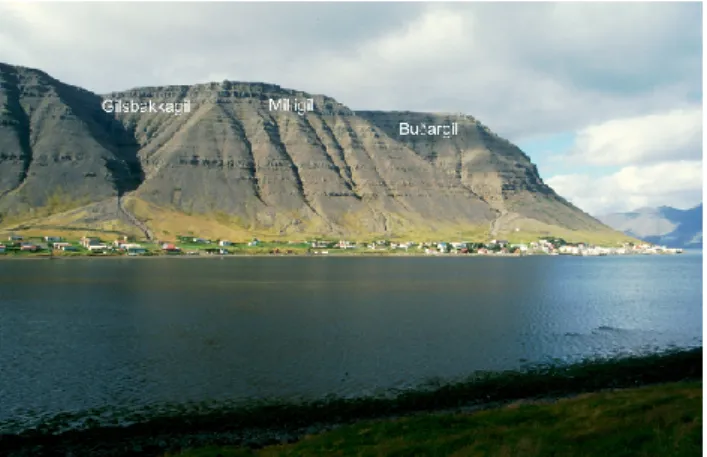
Fig. 4. Photography of B´ıldudalur, view towards Northwest.
a given magnitude
C = (potential) outcomes arising from the occurrence of an
event
E= elements at risk (people in buildings), where
C = Ps×Pt×Vp×Vpe×Pso, (2)
with
Ps = probability of spatial impact given an event (i.e. of the
hazardous event impacting a building)
Pt= probability of temporal impact given an event (i.e. of the
building being occupied)
Vp= vulnerability of the building
Vpe= vulnerability of the people
Pso= probability of seasonal occurrence (e.g. snow
avalanches only in winter). From Eqs. (1) and (2) result: a) Individual risk to people in buildings
Ripe=(H ×Ps×Pt×Vp×Vpe×Pso)×Eipe, (3)
where
Ripe= individual risk to people in buildings (annual
proba-bility of loss of life to an individual)
Eipe= individual person in a building.
b) Object risk to people in buildings
Rpe =(H ×Ps×Pt×Vp×Vpe×Pso)×Epe, (4)
where
Rpe = risk to people in buildings (annual probability of loss
of life)
Epe = number of people in each building.
The results of the calculations were grids showing the fi-nal risk caused by a specific process. Before presenting the results either in risk maps or in risk tables, the risk values needed to be analysed and classified. Classification of risk of loss of life, either individual risk or object risk, was applied using the risk levels defined and implemented in the hazard
zoning regulation, mentioned above. Even though the risk levels given in this regulation refer to individual risk, they were also applied to object risk within this study. This is mainly to show how risk changes if all people at a specific location are to be taken into account in risk calculation.
4 Study area “B´ıldudalur”
The study area B´ıldudalur was selected due to several natural events that occurred and caused damage in the 20th century. The environmental setting cleary shows that there are various active processes acting on the landscape and posing threats to the community which cannot be neglected.
The village B´ıldudalur is situated along the northern shore-line of B´ıldudalsvogur in the Arnarfj¨ordur fjord in the south-ern part of the Westfjords in NW-Iceland (Fig. 3). The size of the study area is approximately 3 km2.
The landscape of the Westfjords is characterised by fjords shaped by glaciers during the last ice ages. The fjords show the typical u-shaped valleys with steep slopes surrounding a flat valley bottom which is partially drowned by rising sea-level. Extensive plateaus characterise the top of the moun-tains. Above B´ıldudalur the mountain B´ıldudalsfjall rises up to 460 m a.s.l. This mountainside is cut by the two large gullies B´udargil and Gilsbakkagil, followed by wide debris cones (Fig. 4). Between these two gullies several smaller gullies appear, collectively named Milligil. The distance be-tween the footslope and the coastline is rather short. Both catchments of the large gullies B´udargil and Gilsbakkagil are about 400–500 m wide and exposed to south-east. The cliffs of the upper slope show an inclination of 45◦to 55◦. Below these cliffs the inclination decreases to 40◦to 30◦on average. The climate is mild and maritime with cool summers and mild winters. Mean annual air temperature is 3◦C and annual precipitation ammounts to approximately 1250 mm. The av-erage snow cover period lasts from October to April, but is highly variable. Snow can also disappear for a few days and then reappear a few days later again.
The lithology consists of parallel and nearly horizontal bedded basaltic layers. Tectonically the study area is not so active as other regions of Iceland. However, in the second part of the 20t hcentury a couple of seismic events could be counted in the Westfjords reaching up to a magnitude of 3.2 (Richter scale). Some of them, at least, were released due to artificial explosions caused by, for example, road works (Gunnar B. Gudmundsson, 2000, personal communication). It is assumed that these events might contribute to weather-ing processes and prepare for or even trigger rock falls. Also the magnitude is rather small and therefore spatial influences might be not too extensive.
A geomorphologic assessment of the study area shows that periglacial, gravitational and fluvial processes are dominant the study area. Large polygonal stone-ring patterns as well as stone stripes on slopes steeper than 2◦on the plateau of B´ıdudalsfjall are clear indicators of high active periglacial processes, also driven by high active weathering processes.
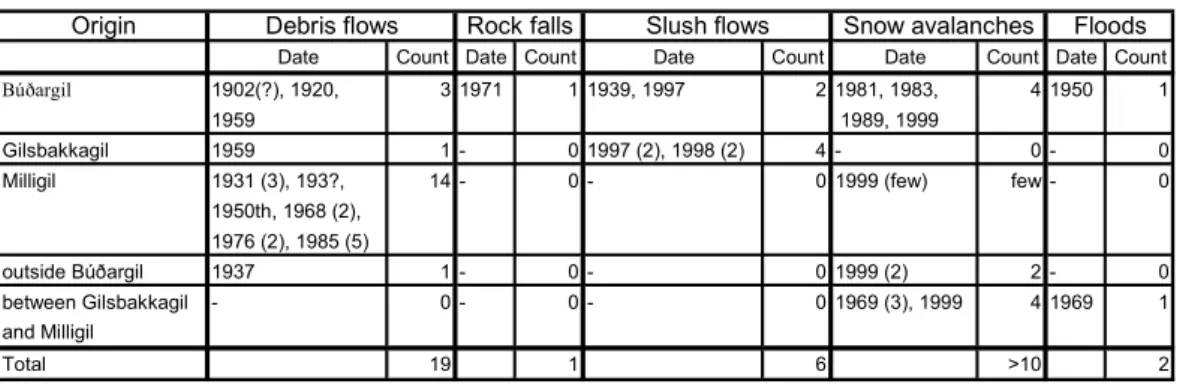
Table 1. Different natural events of various origin in B´ıldudalur since 1902 (Note: if there were more than one event per year the number of events in the specific year is mentioned in brackets, the questionmark in brackets demonstrates the uncertainty of the type of process of the specific event, Source: Glade and Jensen, 2004; slush flows are defined as flowing mixtures of water and snow (T´omasson and Hestnes, 2000).
Origin
Date Count Date Count Date Count Date Count Date Count Búðargil 1902(?), 1920, 3 1971 1 1939, 1997 2 1981, 1983, 4 1950 1
1959 1989, 1999
Gilsbakkagil 1959 1 - 0 1997 (2), 1998 (2) 4 - 0 - 0 Milligil 1931 (3), 193?, 14 - 0 - 0 1999 (few) few - 0
1950th, 1968 (2), 1976 (2), 1985 (5) outside Búðargil 1937 1 - 0 - 0 1999 (2) 2 - 0 between Gilsbakkagil - 0 - 0 - 0 1969 (3), 1999 4 1969 1 and Milligil Total 19 1 6 >10 2
Debris flows Rock falls Slush flows Snow avalanches Floods
Sporadic permafrost is potentially possible. Creeping ma-terial (solifluction, gelifluction) causes a continuous mate-rial supply from the plateau into the slopes and gullies. De-bris flows occurred throughout the whole study area either in channels or on free slopes. Most fallen boulders can be found in the far north-eastern part and occur only sporadically in other parts. The study area is only sparsely vegetated. Var-ious types of grass and moss are mainly found. Forests are non-existent, as such over wide ranges of Iceland.
Settlement in B´ıldudalur has started in the 18th century. Today, there are almost 300 people living in the village. The main economic factor is fishery. There is one fish factory and one shrimp factory near the harbour. B´ıldudalur has two petrol stations, a supermarket, several small companies, a school, a kindergarten, a phone office, a bank and post of-fice and a restaurant which is at the same time a caf´e as well as a guesthouse in summer time.
As stated above, within the community of B´ıldudalur sev-eral natural events occurred in the past and caused
dam-age. Natural processes posing a threat to the population
are mainly debris flows, rock falls, snow avalanches, slush flows and floods. Table 1 summarises the landslide and snow avalanche chronology presented in Glade and Jensen (2004). Two spectacular events have to be mentioned: In February 1939 a slush flow originating from the gully B´udargil passed the schoolhouse, capturing the headmaster, and brought him to the sea, where he was rescued. On 30 December 1971 a boulder moved downwards from the same gully, towards a house, and travelling through the housedoor, rebounding on the housefloor, and stopped finally on a bed. This hap-pened around 11 p.m. but luckily the owner was staying in the kitchen. There was no serious damage to the house however. Although localized, both events are fair examples demonstrating the significance of vulnerability.
Several studies have been carried out to analyse natural hazards and risks in B´ıldudalur and to propose risk mitiga-tion measures. In spite of the proposals by Studull consult-ing engineers (1990) and J´ohannesson et al. (1996) no new structural mitigation measures have yet been built. However,
the final hazard zoning is in progress and will be published soon. It includes the snow avalanche risk analysis as well as the roughly estimated landslide risk based on the landslide hazard assessment carried out by Glade and Jensen (2004). The hazard zoning will be followed by a decision-making process resulting in a plan of action in which the mitigation measures are mentioned which will be implemented.
5 Data
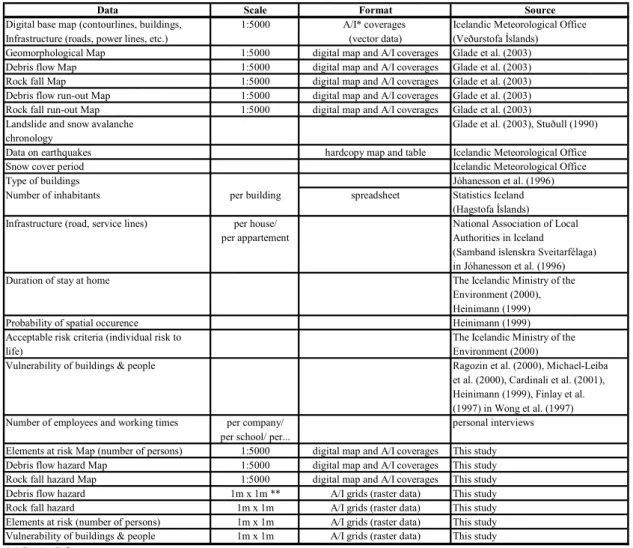
Several types of information have been used within this study. The GIS data provided is available in vector data for-mat. By using the proposed methodology, data needed to be transferred into raster data. Additional information were pro-vided in several other formats. Table 2 gives an overview on data used within this study.
6 Risk analysis
6.1 Hazard identification and analyses
6.1.1 Debris flows
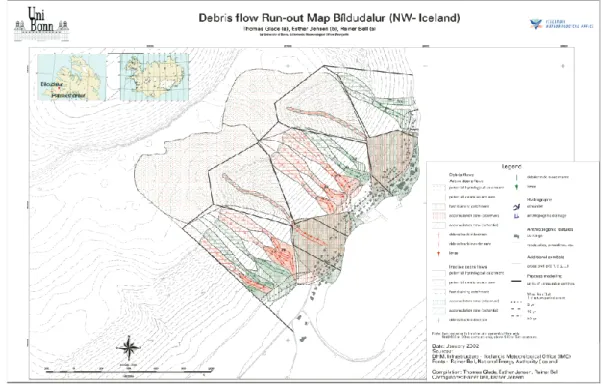
The debris flow map (Fig. 5) shows clearly that debris flows occurred throughout the whole study area. Debris flows are mapped along with debris flow paths, levees, potential water and sediment delivery catchments, actual and potential debris flow deposits and classified in active and currently not active debris flows.
Two main types of debris flows must be distinguished: slope or hillslope debris flows (originated on slopes) and gully or valley-confined debris flows (originated in large gul-lies). Slope debris flows have only a small water catchment given by the upslope rock wall. Water channels in small steep drainage lines eroding material from the sediment cov-ered bedrock terraces as well as from the top of the talus. Eroded material is transported downslope, but stop quickly before the debris flow reaches the valley bottom. Thus, the
Table 2. Overview on data used within this study.
Data Scale Format Source
Digital base map (contourlines, buildings, 1:5000 A/I* coverages Icelandic Meteorological Office Infrastructure (roads, power lines, etc.) (vector data) (Veðurstofa Íslands) Geomorphological Map 1:5000 digital map and A/I coverages Glade et al. (2003) Debris flow Map 1:5000 digital map and A/I coverages Glade et al. (2003) Rock fall Map 1:5000 digital map and A/I coverages Glade et al. (2003) Debris flow run-out Map 1:5000 digital map and A/I coverages Glade et al. (2003) Rock fall run-out Map 1:5000 digital map and A/I coverages Glade et al. (2003)
Landslide and snow avalanche Glade et al. (2003), Stuðull (1990)
chronology
Data on earthquakes hardcopy map and table Icelandic Meteorological Office
Snow cover period Icelandic Meteorological Office
Type of buildings Jóhanesson et al. (1996)
Number of inhabitants per building spreadsheet Statistics Iceland (Hagstofa Íslands)
Infrastructure (road, service lines) per house/ National Association of Local
per appartement Authorities in Iceland
(Samband íslenskra Sveitarfélaga) in Jóhanesson et al. (1996)
Duration of stay at home The Icelandic Ministry of the
Environment (2000), Heinimann (1999)
Probability of spatial occurence Heinimann (1999)
Acceptable risk criteria (individual risk to The Icelandic Ministry of the
life) Environment (2000)
Vulnerability of buildings & people Ragozin et al. (2000), Michael-Leiba et al. (2000), Cardinali et al. (2001), Heinimann (1999), Finlay et al. (1997) in Wong et al. (1997) Number of employees and working times per company/ personal interviews
per school/ per...
Elements at risk Map (number of persons) 1:5000 digital map and A/I coverages This study Debris flow hazard Map 1:5000 digital map and A/I coverages This study Rock fall hazard Map 1:5000 digital map and A/I coverages This study Debris flow hazard 1m x 1m ** A/I grids (raster data) This study
Rock fall hazard 1m x 1m A/I grids (raster data) This study
Elements at risk (number of persons) 1m x 1m A/I grids (raster data) This study Vulnerability of buildings & people 1m x 1m A/I grids (raster data) This study * A/I = Arc/Info
** 1m x 1m = cell resolution
run-out is rather short. Although the phenomena is not stud-ied in detail, it is supposed that the debris flow is drained very fast while flowing on the coarse sediment of the talus with large porosities and consequently high infiltration capacities. In contrast, gully debris flows have much larger water and sediment catchments. They originate either from deposits on foot slopes or on valley floors and are transported in in-cised river channels. Therefore, resulting run-outs are much longer. Due to the specific characteristics of debris flows, the debris flow path (river channels) shifted over time and large almost symetric debris cones were accumulated. Such large debris cones are indicators of high activity over long periods (Glade and Jensen, 2004). Several soil layers were found in between the debris layers of the debris cone below B´udargil, indicating that the activity varies over time (Studull consult-ing engineers, 1990).
Altogether fourteen debris flow paths have been mapped, eight of them have been classified active as can be seen on the debris flow map (red color). Furthermore, the difference in size and respective run-outs between the two main types is clearly shown.
Table 3. Vulnerability of people (Vpe), buildings (Vp), and
peo-ple in buildings (Vpep)dependent on the specific process and its
magnitude.
Magnitude low medium high
Process Vp Vpe Vpep Vp Vpe Vpep Vp Vpe Vpep
Debris flow 0.1 0.2 0.02 0.2 0.3 0.06 0.5 0.5 0.25 Rock fall 0.1 0.2 0.02 0.3 0.4 0.12 0.5 0.5 0.25
In the debris flow run-out calculations, different sized rain-fall events with 2, 10 and 50 year return period corresponding to intensities of 68, 92 and 117 mm/day rainfall, respectively, were applied (Glade, 2004a). Thus, the recurrence intervals, relating to the respective run-out zones, were used to deter-mine the probability of occurrence (the hazard) and to trans-late the run-out zones into hazard zones of high, medium and low hazard.
Fig. 5. Debris flow map (including calculated run-out zones) (Glade and Jensen, 2004).
6.1.2 Rock falls
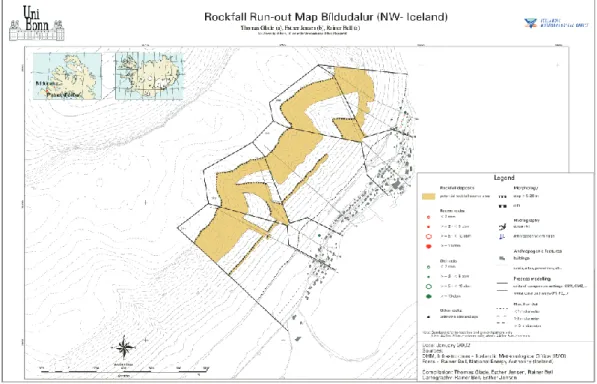
With regard to rock falls potential source areas (bare bedrock) and singular deposited boulders larger than a di-ameter of one meter were mapped. Boulders were classified based on age (roughly estimated as recent or old) and size. Although the rock fall map (Fig. 6) shows extensive poten-tial source areas for boulders covering the whole length of the community most boulders could be found in the most north-eastern part and only sporadically in the other parts. In addition, the results of the run-out modelling are displayed on the same map.
Initially, the supplied rock fall run-out map needed to be transferred into a hazard map. Unfortunately, fallen boul-ders have not yet been absolutely dated and the landslide and snow avalanche chronology shows only one rock fall event (Table 1 and Glade and Jensen, 2004). Therefore, the deter-mination of the hazard was carried out by a rough estimation of the recurrence interval of boulders according to the boul-der size categories used within the run-out calculations by Glade and Jensen (2004). Boulders of the smallest class (up to 2 m diameter, 1.4 t) frequently occur. A return period of 10 years was thus estimated. The second class is defined by boulders of a size up to 3m diameter (11.3 t). They occur less frequently and the estimated return interval is once in 50 years. A boulder of the largest class (more than 3 m diameter, 38.1 t) was found only once within the study area and there-fore, a return period of 100 years was assigned. These return periods were used to turn the respective run-out zones into hazard zones. For the run-out calculations Glade and Jensen (2004) assumed that the boulders remain intact during travel
and do not break apart in their fall. Therefore, results give the worst case scenario.
6.2 Consequence analysis
6.2.1 Elements at risk
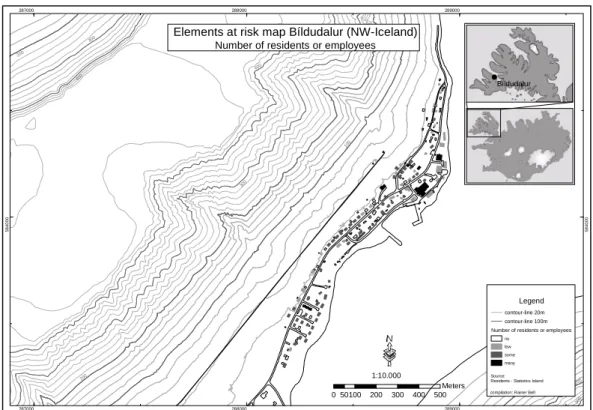
Figure 7 shows the spatial pattern of residents and employ-ees. As detailed data is confidential, following four classes were defined: no, few (1–2 persons), some (3–6 persons), many (7–56 persons). 89 buildings belong to the class “no people” (most of them are garages or barns). 46 buildings ac-commodate “some people”, “few persons” reside in 26 build-ings and only two buildbuild-ings belong to the largest class. 6.2.2 Vulnerability (Vp, Vpe, Vpep)
Vulnerability values (vulnerability of buildings (Vp), people
(Vpe), and people in buildings (Vpep)) are determined
de-pending on the process and its magnitude. Table 3 shows the final values used in the risk calculation.
6.2.3 Probability of spatial impact (Ps)
Referring to the benchmarks given in Heinimann (1999) rather low values were estimated for the probability of spa-tial impact of the various processes due to the fact that even large debris flows or snow avalanches would not cover the whole extent of the settlement. Applied values are presented in Table 4.
Fig. 6. Rock fall map (including calculated run-out zones) (Glade and Jensen, 2004).
Table 4. Probability of spatial impact of each process dependant on its magnitude.
Magnitude low medium high Process
Debris flow 0.1 0.2 0.3
Rock fall 0.01 0.01 0.02
6.2.4 Probability of temporal impact (Pt)
For residential houses a value of 75% (18 h a day) was cho-sen. For companies a common value is 9 to 10 h, determined by the respective length of working time. For the school, holidays were not considered so that a value of 9 h a day was applied in the study.
6.2.5 Probability of seasonal impact (Pso)
The available historical data clearly shows that debris flows and rock falls can occur during the whole year in the study area. Usually, debris flows occur only in summer and au-tumn. In winter, when there is a snow coverage, rainfall ac-companied with a temperature increase would more likely
cause slush flows. However, the historical records show
that from 10 debris flows, for which exact dates were avail-able, 1 occurred in summer, 3 in autumn, 2 in spring and 4 in winter. Referring to the average snow cover period in the study area (Sect. 4) even 6 events occurred in this time. Within this study, it was not possible to investigate historic sources whether the winter events were debris flows or slush flows. Regarding rock falls, it could not be excluded that
such events occur in winter, as the only rock fall event, men-tioned in the historical database, dates from 30 December, 1971. Thus, the probability of seasonal occurrence for both debris flows and rock falls is set to 1.
6.3 Risk calculation
6.3.1 Debris flows
The risk analysis results with regard to individual risk to life caused by debris flows show a highest risk value of 2.8×10⁻³/year and a lowest value of 5.7×10⁻⁴/year. Thus, all cells are either related to the highest risk class or to the no risk class. The final map (Fig. 8) displays a homoge-nous pattern across all hazard zones only being disturbed by cells with the value “0”. The most risky places are below the two large gullies, B´udargil and Gilsbakkagil, and the south-western part of Milligil.
The results calculated for the object risk to life are very similar to the results of the individual risk to life with all ,,risk cells“ remaining in the highest risk class. But the object risk to life is still higher, with maximum and minimum risk values determined at 7.8×10⁻²/year and 6.3×10⁻⁴/year, re-spectively. The respective debris flow risk is exactly the same as the map for individual risk to life. Therefore, this map is not presented here. The determined total risk caused by de-bris flows is 0.63 deaths per year.
6.3.2 Rock falls
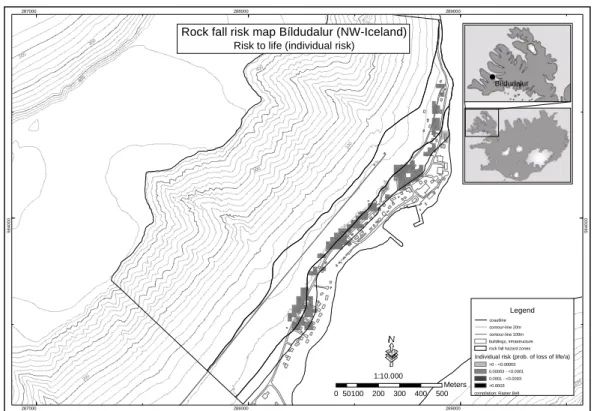
The individual risk to life due to rock falls is relatively
400 300 100 200 100 300 400 200 300 200 287000 287000 288000 288000 289000 289000 5 8 4 0 0 0 5 8 4 0 0 0 Bíldudalur
Elements at risk map Bíldudalur (NW-Iceland)
050100 200 300 400 500
Meters 1:10.000
Number of residents or employees
Legend contour-line 20m contour-line 100m Number of residents or employees
no few some many
compilation: Rainer Bell Source: Residents - Statistics Island
Fig. 7. Elements at risk map – Number of persons at each building.
400 300 100 200 300 200 100 200 400 287000 287000 288000 288000 289000 289000 5 8 4 0 0 0 5 8 4 0 0 0 5 8 5 0 0 0 5 8 5 0 0 0 050100 200 300 400 500 Meters Bíldudalur 1:10.000 Risk to life (individual risk)
Debris flow risk map Bíldudalur (NW-Iceland)
Legend coastline contour-line 20m contour-line 100m buildings, infrastructure debris flow hazard zones Individual risk (prob. of loss of life/a)
0 >0 - <0.00003 0.00003 - <0.0001 0.0001 - <0.0003 >=0.0003 compilation: Rainer Bell
Fig. 8. Debris flow risk map – Individual risk to life.
1.1×10⁻⁵/year and 5.6×10⁻⁵/year, respectively. Thus, no cells are accorded a high or medium risk. 92% belongs to low risk and the rest (8%) to very low risk. The rock fall risk
map (Fig. 10) shows that no “risk cells” are located within the high hazard zone. Furthermore, it is shown that risk caused by rock fall exists below the two large gullies, the Milligil
area and below the slope adjacent to B´udargil, to the north. Cells with no risk encompass the “risk cells”.
Taking all the number of people in a building into ac-count (object risk to life), the risk increases, which can eas-ily be seen on the respective rock fall risk map (Fig. 11).
The highest risk value is 1.6×10⁻³/year and the lowest
2.1×10⁻⁵/year. The increase results in the following dis-tribution: very low risk (4%), low risk (27%), medium risk (58%) and high risk (11%). The latter can be found mainly below B´udargil (in particular around the school) and Gils-bakkagil. Cells with the value “0” encompass the “risk cells”. The calculated total risk is 9×10⁻³deaths per year.
7 Uncertainties
Due to the uncertainties inherent in each input factor of risk analysis, the resulting risk values also indicate a considerable uncertainty. In Table 5 respective factors are listed along with a rough qualitative estimation of the degree of uncertainty, the reason for uncertainty and the assumed significance of the factor in relation to final results. Furthermore, possible improvements are given.
In spite of all improvements which may be carried out a certain amount of uncertainty will always remain in haz-ard and risk analyses. Thus, a way must be found on how to deal with such uncertain values. IUGS Working Group on Landslides – Committee on Risk Assessment (1997) and Heinimann (1999) recommended that final results should be treated as relative results and not as absolute ones. This is probably the only way of using the very many valuable tools of hazard and risk analysis in natural disaster mitigation on one hand, but not to loose the trust in the results on the other.
8 Discussion
The final risk maps point out the critical regions in relation to the respective processes (hazards) and the elements at risk.
The highest risks by far throughout all of the analyses (in-dividual risk to life and object risk to life) are caused by de-bris flows. The high dede-bris flow risks are mainly caused by the low return periods of 2, 10 and 50 years of the debris flows which were applied in this study. As stated earlier, the risk calculation based on these low recurrence intervals is a worst-case scenario. However, final risk values give a first approximation of the order of the risks caused by debris flows.
Rock fall risks are relatively low. The reason for this is that rock falls are a very local phenomena and therefore, the probability of spatial impact is very low. Nevertheless, the case of the rock fall stopping on a bed demonstrates very well, that such low risks are also not to be neglected, as they may also cause fatalities.
Referring to the final risk maps, the distribution of the “risk cells” is closely related to the distribution of the respec-tive hazard zones. The variation of the risk values within a specific risk map is caused by the hazard, the vulnerability
of the respective elements at risk, the probability of spatial impact or the number of people in a building and the prob-ability of temporal impact. Within a specific hazard class, only the latter two causes the variation, as the other factors remain constant in such a class. The probability of seasonal occurrence for debris flows and rock falls was set to 1 and therefore does not have any influence on the height of risk values.
The differences between individual and object risk to life can be significant, as the final risk maps have demonstrated. The vulnerability of the elements at risk plays a crucial role in natural risk assessments. The actual risk can always be reduced by reducing the vulnerability of the elements at risk. Further analyses (not presented in this study) show that risk may be decreased by a maximum factor of 104. Thus, in rela-tion to the defined risk classes, acrela-tions to reduce vulnerability may change the unacceptable risk to an acceptable risk.
There are several inherent uncertainties in the methodol-ogy as well as in the available data, as discussed in the pre-vious chapter. This must always be considered when dis-cussing risk analysis results. However, the final results show that the investigated processes pose high risks to the commu-nity, at least to some part of it. In particular, the areas below the large gullies, Budargil and Gilsbakkagil, are places such at risk. But also below Milligil the risks should not be ne-glected. Although the debris flow risk maps show no risk in large parts of the area below Milligil, it is assumed that there is a considerable risk prevalent such that past events have demonstrated. A general statement must be given on the areas below the hazard zones, showing no risk on the fi-nal risk maps. Even though no risk is shown, one must be aware that there always exist a rest risk which may lead into future disasters.
Recommendations on how the applied methodology and its results can be improved are given in the following. One of the most important aspects in improving the results of this study is to more accurately define the return periods of the respective processes, as they are crucial in hazard and risk analyses. As has been pointed out, the frequency, especially of the debris flows, should be investigated in detail. This can be carried out using investigations to determine the sediment supply rate from the plateau to the slopes and the gullies. Such information can then be used to estimate the time nec-essary to refill the sediment stores, so that new debris flows can be triggered. Sediment availability should then be com-bined with the frequency of potential debris flow triggering rainstorm events, in order to get a more accurate recurrence interval of debris flows. In addition, dating the soil layers in between the debris layers of the debris cone below Budargil may provide excellent information on the activity of debris flows in the past. Maybe, the other debris cones also contain such information. In relation to rock falls, the return period estimations may be improved by dating the falling boulders (for example: lichen dating). This may give information on how many boulders of a given size has fallen in a specific period.
400 300 100 200 200 400 200 100 300 287000 287000 288000 288000 289000 289000 5 8 4 0 0 0 5 8 4 0 0 0 050100 200 300 400 500 Meters Bíldudalur 1:10.000 Risk to life (individual risk)
Rock fall risk map Bíldudalur (NW-Iceland)
Legend coastline contour-line 20m contour-line 100m buildings, infrastructure rock fall hazard zones Individual risk (prob. of loss of life/a)
>0 - <0.00003 0.00003 - <0.0001 0.0001 - <0.0003 >0.0003 compilation: Rainer Bell
Fig. 9. Rock fall risk map – Individual risk to life.
400 300 100 200 100 400 300 200 200 287000 287000 288000 288000 289000 289000 5 8 4 0 0 0 5 8 4 0 0 0 050100 200 300 400 500 Meters Bíldudalur 1:10.000 Risk to life (object risk)
Rock fall risk map Bíldudalur (NW-Iceland)
Legend coastline contour-line 20m contour-line 100m buildings, infrastructure rock fall hazard zones Object risk (prob. of loss of life/a)
0 >0 - <0.00003 0.00003 - <0.0001 0.0001 - <0.0003 >=0.0003 compilation: Rainer Bell
Fig. 10. Rock fall risk map – Object risk to life.
In reference to the debris flow run-outs, the calculations should be reviewed and revised, if possible, as historical data show that in particular the calculated run-outs are
underesti-mating the extent of past events, especially in the area below Milligil. Currently, the debris flow calculations are based on empirical models due to the high parameter demand of
Table 5. Qualitative estimation of uncertainties inherent in input data and results of risk analysis within this study.
factor uncertainty reason significance improvement
scanning/digitizing very low standard inaccuracies very low -hazard identification low - medium subjectivity high education, training,
hazard mapping standard mapping methods hazard analysis medium - high limitations of models, very high improvement of models,
insufficient data, increase of data collection, basic assumptions, new concepts vulnerability high - very high insufficient data, very high back analysis of past events,
only very little research development of physical vulnerability concepts probability of low - medium average values low - medium -temporal impact (Pt)
probability of medium subjectivity medium back analysis of past events spatial impact (Ps)
economic value (Ep) very low detailed information low
-number of persons very low detailed information on low -(Epe) number of residents
medium no official data on detailed field investigations employees
probability of low - medium rough estimation low detailed analysis seasonal
occurence (Pso)
risk classes - medium - high subjectivity high risk perception studies economic risk
risk classes - low - medium risk classes used high risk perception studies risk to life in regulation
resulting risk high uncertainties in input very high reduction of uncertainties in factors input factors, improvement of risk analysis methodology
physically-based models. More analyses are important to calculate debris flow processes in more detail. However, cur-rent results are based on empirical data, and are thus of high value for the respective region. If the revision results in new debris flow run-outs, new hazard and risk analyses should be carried out to update respective hazard and risk maps.
Because of the imposition of high risks, mitigation mea-sures are needed to be carried out in B´ıldudalur. It has to be pointed out, that existing mitigation measures have not been considered in hazard and risk analysis. Therefore, the results include the failure of these structural mitigation measures and thus, reflect the hazard and risk as naturally given. De-spite the strength of this study, the actual size and dimension of the mitigation measures needs to be calculated based on detailed data (local scale analysis). A combination of a sys-tem of dams and the relocation of the most endangered build-ings is recommended. However, one must also be aware that such protection structures are only short- and mid-term solu-tions, causing huge efforts and costs of maintenance. Thus, long-term solutions should be sought for, being part of a pre-ventive and sustainable hazard and risk management.
It can be concluded that the newly developed method is applicable to further catchments in Iceland, and potentially to further countries with different environmental settings. Acknowledgements. We are very grateful to E. Jensen and the staff of the Icelandic Meteorological Office for financial support and the provision of data. Without their assistance, this study could never be carried out in the presented form.
Edited by: P. Reichenbach
Reviewed by: P. Budetta and J. Stemberk
References
Aleotti, P., Baldelli, P., Polloni, G., Govi, M., and Villandi, B.: Hydrological Risk Assessment of the Po River Basin (Italy), in: Landslides in research, theory and practice, edited by Bromhead, E., Dixon, N., and Ibsen, M.-L., Thomas Telford, Cardiff, 13–18, 2000.
Aleotti, P. and Chowdhury, R.: Landslide hazard assessment: sum-mary review and new perspectives, Bulletin of Engineeringg Ge-ology and Environment, 58, 21–44, 1999.
Anbalagan, R. and Singh, B.: Landslide hazard and risk assessment mapping of mountainous terrains – a case study from Kumaun Himalaya, India, Engineering Geology, 43, 237–246, 1996. Cardinali, M., Reichenbach, P., Guzzetti, F., Ardizzone, F.,
An-tonini, G., Galli, M., Cacciano, M., Castellani, M., and Salvati, P. : A geomorphological approach to the estimation of landslide hazards and risks in Umbria, Central Italy, Natuaral Hazards and Earth System Sciences, 2, 57–72, 2002.
Carrara, A.: Uncertainty in evaluating landslide hazard and risk, in: Prediction and Perception of natural hazards, edited by Nemec, J., Nigg, J. M., and Siccardi, F., Proceedings Symposium, 22– 26 October 1990, Perugia, Italy. Advances in Natural and Tech-nological Hazards Research, Kluwer Academic Publishers, Dor-drecht, 101–109, 1993.
Cruden, D. M. and Varnes, D. J.: Landslide types and processes, in: Landslides: investigation and mitigation, edited by Turner, A. K. and Schuster, R. L., Special Report. National Academey Press, Washington, D.C., 36–75, 1996.
Dai, F. C., Lee, C. F., and Ngai, Y. Y.: Landslide risk assessment and management: an overview, Engineering Geology, 64, 1, 65–87, 2002.
Dikau, R., Brunsden, D., Schrott, L., and Ibsen, M. (Editors): Land-slide Recognition. Identification, movement and causes, John Wiley & Sons Ltd., Chichester, 251, 1996.
Dombrowsky, W. R.: Die globale Dimension von Katastrophen, in: Naturkatastrophen – Ursachen, Auswirkungen, Vorsorge, edited by Plate, E. and Merz, S., Stuttgart, 229–246, 2001.
Einstein, H. H.: Special lecture: Landslide risk assessment pro-cedure, in: Proceedings of the 5th International Symposium on Landslides, edited by Bonnard, C., 10–15 July 1988, A. A. Balkema, Lausanne, Switzerland, 1075–1090, 1988.
Einstein, H. H.: Landslide risk – Systematic approaches to assess-ment and manageassess-ment, in: Landslide risk assessassess-ment – Proceed-ings of the Workshop on Landslide Risk Assessment, Honolulu, Hawaii, USA, 19–21 February 1997, edited by: Cruden, D. M. and Fell, R., A. A. Balkema, Rotterdam, 25–50, 1997.
Eusebio, A., Grasso, P., Mahtab, A., and Morino, A.: Assessment of risk and prevention of landslides in urban areas of the Italian Alps, in: Landslides – Gliessements de Terrain, edited by Sen-neset, K., A. A. Balkema, Rotterdam, 190–194, 1996.
Fell, R.: Landslide risk assessment and acceptable risk, Canadian Geotechnical Journal, 31, 2, 261–272, 1994.
Fell, R.: Landslide Risk Management Concepts and Guidelines – Australian Geomechanics Society Sub-Committee On Landslide Risk Management, in: Landslides, International Union of Geo-logical Sciences, Cardiff, UK, 51–93, 2000.
Fell, R. and Hartford, D.: Landslide risk management, in: slide risk assessment – Proceedings of the Workshop on Land-slide Risk Assessment, Honolulu, Hawaii, USA, 19–21 February 1997, edited by: Cruden, D. M. and Fell, R., A. A. Balkema, Rotterdam, 51–109, 1997.
Flentje, P. and Chowdhury, R.: Slope instability and risk associated with a rainstorm event – a case study, in: Landslides in research, theory and practice, edited by Bromhead, E., Dixon, N., and Ib-sen, M.-L., , Thomas Telford, Cardiff, 559–566, 2000.
Glade, T.: Landslide hazard assessment and historical landslide data – an inseparable couple?, in: The use of historical data in natural hazard assessments, edited by Glade, T., Frances, F., and Albini, P., Advances in Natural and Technological Hazards Research, Kluwer Academic Publishers, Dordrecht, 153–168, 2001. Glade, T.: Ranging scales in spatial landslide hazard and risk
anal-ysis, in: Third International Conference on Risk Analanal-ysis, edited by Brebbia, C. A., 19–21 June 2002, Sintra, Portugal, 719–729, 2002.
Glade, T.: Linking natural hazard and risk analysis with geomor-phology assessments, Geomorgeomor-phology, in press, 2004a. Glade, T.: Vulnerability assessment in landslide risk analysis, Die
Erde, 134, 2, 121–138, 2004b.
Glade, T., Frances, F., and Albini, P. (Editors): The use of histori-cal data in natural hazard assessments, Advances in Natural and Technological Hazards Research, 7, Kluwer Academic Publish-ers, Dordrecht, 220, 2001.
Glade, T. and Jensen, E. H.: Recommendations for landslide haz-ard assessments in Bolungarvik and Vesturbyggd, NW-Iceland, Icelandic Metereological Office, Reykjavik, http://www.vedur.is/ utgafa/greinargerdir/, 2004.
Glade, T. and von Davertzhofen, U.: GIS-based landslide risk anal-ysis in Rheinhessen, Germany, Natural Hazards, submitted. Hardingham, A. D., Ditchfield, C. S., Ho, K. K. S., and
Small-wood, A. R. H.: Quantitative risk assessment of landslides – a case hsitory from Hong Kong, in: Slope Engineering in Hong Kong, edited by Li, K. S., Kay, J. N., and Ho, K. K. S., A. A. Balkema, Hong Kong, 145–151, 1998.
Heinimann, H. R.: Risikoanalyse bei gravitativen Naturgefahren – Methode, Umwelt-Materialien, 107/I, Bern, 115, 1999. Hollenstein, K.: Analyse, Bewertung und Management von
Natur-risiken, vdf Hochschulverlag AG, ETH Z¨urich, Z¨urich, 220, 1997.
IUGS Working Group on Landslides – Committee on Risk Assess-ment: Quantitative assessment for slopes and landslides – The state of the art, edited by Cruden, D. M. and Fell, R., slide risk assessment – Proceedings of the Workshop on Land-slide Risk Assessment, Honolulu, Hawaii, USA, 19–21 February 1997, A. A. Balkema, Rotterdam, 3–12, 1997.
J´ohannesson, T. and ´Ag´ustsson, K.: Hættumat vegna aurskridna, grj´othruns, krapafl´oda og aurblandadra vatns-og krapafl´oda ´ı br¨ottum farvegum (Hazard zoning for debris flows, rockfall,slush flows and torrents and slush flows mixed with soil in steep slopes), Icelandic Meteorological Office, Reykjav´ık, 2002. J´ohannesson, T., Lied, T. K., Margreth, S., and Sandersen, F.: An
overview of the need for avalanche protection measures in Ice-land. V´I-R96003- ´UR02, Vedurstofa ´Islands, Reykjav´ık, 1996. J´onasson, K. and Sigurdsson, S.: Estimation of avalanche risk,
Ice-landic Meteorological Office, Reykjav´ık, 1999.
Kienholz, H.: Naturgefahren – Naturrisiken im Gebirge, in: Forum f¨ur Wissen, Naturgefahren, edited by S. Eidg. Forschungsanstalt f¨ur Wald and u. Landschaft, Birmensdorf, Switzerland, 7–21, 1993.
Lee, E. M., Brunsden, D., and Sellwood, M.: Quantitative Risk Assessment of Coastal Landslide Problems, Lyme Regis, UK, in: Landslides in research, theory and practice, edited by Bromhead, E., Dixon, N., and Ibsen, M.-L., Thomas Telford, Cardiff, 899– 904, 2000.
Leroi, E.: Landslide hazard – Risk maps at different scales: Ob-jectives, tools and development, in: Landslides – Glissements de Terrain, edited by Senneset, K., 7th International Symposium on Landslides, Balkema, Trondheim, Norway, 35–51, 1996. Michael-Leiba, M., Baynes, F., and Scott, G.: Quantitative
land-slide risk assessment of Cairns, Australia, in: Landland-slides in re-search, theory and practice, edited by Bromhead, E., Dixon, N., and Ibsen, M.-L., Thomas Telford, Cardiff, 1059–1064, 2000. Morgan, G. C., Rawlings, G. E., and Sobkowicz, J. C.: Evaluating
total risk to communities from large debris flows, Geotechnique and Natural Hazards, 6–9 May 1992, Vancouver, Canada, 225– 236, 1992.
P´etursson, H. G.: Skriduann´alar Patreksfjardar, Bolungarv´ıkur og B´ıludals, N´att´urufrædistofnun ´Islands (The Icelandic Institute of Natural History), Akureyri, 2000.
Smallwood, A. R. H., Morley, R. S., Hardingham, A. D., Ditch-field, C., and Castleman, J.: Quantitative risk assessment of land-slides: Case histories from Hong Kong, In: Proceedings Inter-national Symposium on Engineering Geology and the Environ-ment, edited by Marinos, P. G., Koukis, G. C., Tsiambaos, G. C., and Stournaras, G. C., 23–27 June 1997, A. A. Balkema, Athens, Greece, 1055–1060, 1997.
Studull consulting engineers: B´ıldudalur, Skriduf¨oll og skridu-varnir, (B´ıldudalur, debris flows and debris flows defence mea-sures), Studull, 1990.
The Ministry of the Environment: Reglugerd no. 505/2000 um hættumat vegna ofanfl´oda, flokkun og n´ytingu hættusvæda og gerd br´adabirgdahættumats (Regulation on hazard zoning for avalanches, debris flows and rockfall, the usage of hazard zones, and the making of preliminary hazard zoning), 2000.
T´omasson, G. G. and Hestnes, E.: Slushflow hazard and mitigation in Vesturbyggd, Northwest Iceland, Nordic Hydrology, 31, 4–5, 399–410, 2000.
Varnes, D. J.: Landslides hazard zonation: a review of principles and practice, Paris, 63, 1984.